ble of measuring vertical strain in asphalt concrete [8]. Six sen-
sors are installed and the responses are evaluated with the numerical analysis. A promising performance is observed be-
International Journal of Scientific & Engineering Research Volume 4, Issue 2, February-2013 1
ISSN 2229-5518
Field Measurement of Vertical Strain in Asphalt
Concrete
Md Rashadul Islam1, and Rafiqul A. Tarefder2
Abstract— Recently developed Mechanistic-Empirical Pavement Design Guide (MEPDG) determines the probable total rutting by summing up the deformations of all layers of the trial pavement. If all distresses outcomes including rutting are within the specification the trial section is de- signed for construction. Therefore, vertical deformation (or strain) needs to be measured to validate the MEPDG for local conditions. However, no direct procedure for measuring the vertical strain in flexible pavement is available to this date. Traditionally, Earth Pressure Cell (EPC) is used to measure the vertical stresses at different layers of pavement. Then, vertical strain is calculated using the measured stress and the stiffness of the corresponding material. The present study describes a procedure to measure the vertical strain of asphalt concrete based on field instrumen- tation. The vertical strain is measured using the Vertical Asphalt Strain Gauge (VASG) in an instrumented pavement section on Interstate 40 (I-
40) in the state of New Mexico, USA and compares the results with numerical model developed using ABAQUS. The numerical model is validat- ed with stress responses measured with installed four EPCs. The stiffness input of the numerical model is obtained from Falling Weight Deflec-
tometer (FW D) test. Promising agreement is observed between the strains measured in the field and determined from the numerical model. Therefore, the VASG can be considered an effective sensor to measure the vertical strain of asphalt concrete in flexible pavement.
Index Terms— Asphalt concrete, Vertical stain, Vertical stress, Vertical asphalt strain gauge, Earth pressure cell, Falling weight deflectometer test, Numerical analysis, Validation
—————————— ——————————
1 INTRODUCTION
utting is one of the major distress outcomes of Mechanis- tic-Empirical Pavement Design Guide (MEPDG). It is de- termined by summing up of permanent deformations of all layers along the wheel path [1]. Therefore, measuring vertical strain is so important for accurate rut prediction. Eq. 1 is used
to calculate the permanent deformation in asphalt concrete:
crete is much cumbrous. Several researchers measured the vertical deformation or vertical stress, not the vertical strain. Scullion et al. [2] used Multi Depth Deflectometer (MDD) to measure the vertical deflection under Falling Weight Deflec- tometer (FWD) and vehicle loads. A 38 mm diameter (1.5") and 2.1 m (7.0 ft.) deep borehole was prepared in the pave-
ment to install the sensors. The researchers measured the rela-
∆p HMA p HMA HMA 1r z r HMA n T
(1)
tive and the total permanent deformation. However, determin- ing actual deformation from this data is near impossible.
where ∆p(HMA) = Accumulated plastic vertical deformation in
Hot Mix Asphalt (HMA) (in.),
Ep(HMA) = Accumulated plastic vertical strain in HMA layer,
Er (HMA) = Elastic strain calculated by structural response model
at mid-depth of each sub layer,
ℎHMA = Thickness of HMA layer, (in.),
n= Number of axle-load repetitions,
T= Pavement temperature (⁰F),
kz = Depth confining factor, function of HMA total depth and
the depth concerned,
{31r,2r,3r = Local field calibration constants,
k1r,2r,3r = Global field calibration constants,
Therefore, Er (HMA) is the only parameter needed to be meas-
ured to determine the plastic deformation. Accurate meas-
urement of vertical strain is necessary for probable rut estima- tion.
Measuring vertical deformation or strain of asphalt con-
————————————————
1Ph.D. Student, Dept. of Civil Engineering, University of New Mexico, MSC
2Associate Professor, Dept. of Civil Engineering, University of New Mexico.
Schaevitz HCD-500 Linear Variable Displacement Trans- ducer (LVDT) was used to measure the vertical deformations of the asphalt and concrete and subgrade base in Minnesota Road Research Project [3]. A PVC pipe of 2.4 m (8 ft.) long and
112 mm (4.5") diameter was inserted into the pavement in which a reference rod of 3.6 m (12 ft.) long and 25 mm (1.0 in.) diameter was inserted into the pipe. The pipe was mounted to
25 mm (1.0") below the pavement surfaces. The LVDT was
placed at a certain depth on the reference cap. The process is really cumbersome and the inserted 112 mm pipe also deterio- rates the quality of pavement and the hole may act as stress focal point. This installation procedure was not followed in any future studies.
National Center for Asphalt Technology (NCAT) performed several instrumentation projects in 2003 and 2006 and studied the vehicle-pavement interaction and effects on pavement deterioration [4], [5]. Vertical stress and horizontal strain of asphalt concrete were measured in these studies with Geokon
3500 Earth Pressure Cells (EPCs) and Construction Technology
Laboratories Inc. (CTL) supplied Horizontal Asphalt Strain Gauges (HASGs). Twelve flexible pavements were instru- mented in Virginia Smart Road project [6], [7]. The researchers installed Dynatest Strain Gauges to measure horizontal strain in asphalt concrete and Geokon 3900 EPC to measure vertical
MSC 01 1070, 1 University of New Mexico, Albuquerque, NM 87106; USA. IJSER © 2013 http://www.ijser.org
International Journal of Scientific & Engineering Research Volume 4, Issue 2, February-2013 2
ISSN 2229-5518
stress at the layer interfaces.
The deformation of the asphalt concrete can be calculated by using the vertical stress with the stiffness of the asphalt concrete. However, HMA stiffness is fully dependent on age of the pavement, temperature profile of the pavement and frequency of loading. These factors make the output quite challenging to be accurate.
A new procedure is described in the present study to
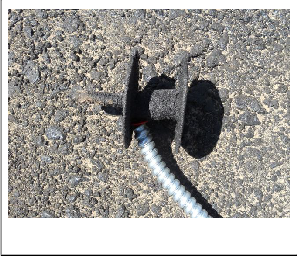
measure the vertical strain in asphalt concrete. CTL has devel- oped Vertical Asphalt Strain Gauges (VASGs) which are capa-
plates and hand compacted to acquire the required density. It has Teflon polymer coated braided lead wire to avoid electri- cal noise and withstands temperature up to 400 ⁰F (205 ⁰C). Fig. 1 also shows that the cable is inserted into aluminum con- duit to protect it from larger aggregates.
The resistance to electrical current provided by a conductor of uniform cross-section is given by the well-known preliminary physics equation (Eq. 2) given below:
ble of measuring vertical strain in asphalt concrete [8]. Six sen-
sors are installed and the responses are evaluated with the numerical analysis. A promising performance is observed be-![]()
R = p A
(2)
tween the measured vertical strain and the numerical model determined vertical strain. The details of this sensor, working principle, installation procedure and functionality are de- scribed in the following sections.
where R is the resistance of the conductor in ohms, p is the
resistivity of the material, and L and A are the length and
cross-sectional area of the conductor respectively. If the con- ductor is stretched the length increases and the cross-sectional area decreases. The relationship of the change in resistance with change in length and diameter is expressed as in Eq. 3:
∆R ∆L
The main objective of this study is to evaluate the performance of the VASG to measure the vertical strain of asphalt concrete. Numerical model is developed to determine the strain re- sponse at the VASG sensors’ elevation. This model is validated with the stresses responses measured with the pressure cells installed at four other depths.
The VASG measures the vertical strain in asphalt concrete for repeated traffic loading. It has a sharp leg to be inserted into the underlying base layer. The gauge area is secured by two stainless steel circular plates as shown in Fig. 1.![]()
![]()
Ro = FG Lo (3)
The term FG is commonly referred to as gauge factor, or
strain sensitivity factor and is a function of the alloy character- istics, L0 and R0 are the initial length and resistance of the con-
ductor respectively and ∆R is the change in resistance for change in length (∆L). The change of resistance produces some
voltage of a bridge circuitry (Fig. 2). An analog to digital con-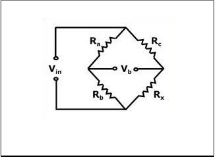
verter changes the analog voltage to a digital signal that is interpreted by data acquisition system.
Fig. 2. W heatstone bridge. Ra, Rb, Rc are the fixed resistances. Rx is changeable.
Vin is zero for balanced condition. It yields the following condition as in Eq. 4:
Ra Rc
(4)![]()
![]()
Rb = Rx
Fig. 1. Vertical Asphalt Strain Gauge. The cable is inserted into aluminum conduit to protect it from larger aggregates.
The bottom plate helps the sensor to remain in position without tilting. The top plate transfers the applied load uni- formly on the sensors. HMA is inserted between these two
where Ra, Rb, Rc and Rx are the four resistances of the bridge. The bridge becomes unbalanced if any resistance changes. One of the resistors, in this case Rx, is replaced by strain gauge to measure the strain. If the gauge experiences a change in re- sistance, the voltage across the meter is then related to the change in resistance. The strain in the gauge can be calculated from this voltage if gauge factor is known. The manufacture
provides this factor and is to be verified in laboratory.
IJSER © 2013 http://www.ijser.org
International Journal of Scientific & Engineering Research Volume 4, Issue 2, February-2013 3
ISSN 2229-5518
A small hole of around 0.375 mm diameter and 100 mm deep is drilled. Some sand binder mixtures are applied to fill the hole and cover the surroundings. The gauge is gently pressed down into the hole until the bottom plate comes into full con- tact with the surface. The top plate of the gauge is removed and HMA mixture is placed around each gauge immediately before paving. The mixture is then compacted with tamping rod without damaging the sensor. The top cap is then replaced and some mix is applied on top of it. Then, contractors can pave over it.
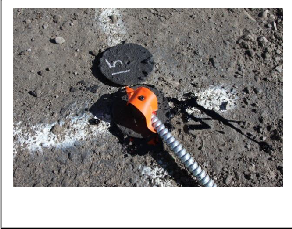
Earth pressure cell is used to measure the vertical stresses in base, subbase and subgrade. Two circular stainless steel plates are welded together along their boundaries as shown in Fig. 3. Fluid is used to fill the narrow gap between the plates. The fluid gets stressed when vertical load is applied on top of it. A pressure transducer is connected with stainless steel tube. The transducer transforms this fluid pressure into an electrical sig- nal (usually voltage) which is noticed by the data acquisition system.
Fig. 3. Earth pressure cell. The two circular steel plates are welded along their peripheries.
mile post 141 near Albuquerque in the state of New Mexico,
USA. The cross section of the instrumented section is shown in
Fig. 4. The section has four layers with 300 mm (12") Surface,
144 mm (5.75") Base, 200 mm (8.0") Process Place and Compact
(PPC) and Subgrade.
The asphalt concrete used in this pavement is a dense graded SuperPave (SP) mix, type SP-III, which is widely used in the New Mexico Department of Transportation (NMDOT). This mix containes plant screened Recycled Asphalt Pavement (RAP) materials around 35%. Performance Grade (PG) binder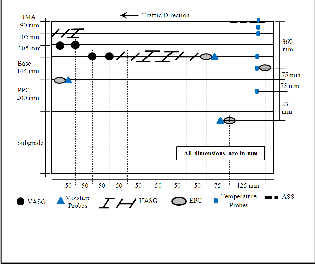
PG 70-22 is 4% (by weight of mixture). The maximum aggre- gate size is 25 mm (1 in.). About 5% of the materials passes through No. 200 sieve (0.075 mm).
Fig. 4. Longitudinal profile of the instrumentation section. The layers of the section and the elevations of the sensors are presented.
A total of twenty two vertical and horizontal strain gauges, four pressure cells, three moisture probes, and six temperature probes were installed inside the pavement at different layers. Sensor data are gathered continuously by a high speed data acquisition system and recorded in a computer.
EPCs were installed at the layer interfaces and at the mid-
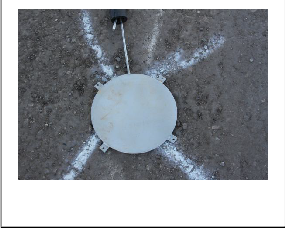
dle of the base. A 300 mm (12.0") square, was prepared to ac- commodate the 225 mm (9.0") diameter EPC as shown in Fig.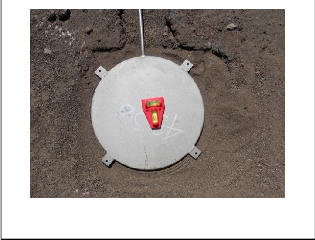
5. The depth of the hole was approximately 60 mm. A 75 mm (3.0") wide by 75 mm (3.0") deep trench was prepared with pick axes to accommodate the cable.
Fig. 5. Installation of EPC on top of the base. Some fine mate- rials were placed at the top and at the bottom of the plate.
The bottom 25 mm (1.0") was filled with sieved PPC mate- rial passing #8 and compacted with Marshall Hammer to make a smooth and level bed. Then, the sieved PPC material passing #16 was placed approximately 18.75 mm (0.75") thick.
The EPC was then placed such that it attained the exact eleva-
IJSER © 2013 http://www.ijser.org
International Journal of Scientific & Engineering Research Volume 4, Issue 2, February-2013 4
ISSN 2229-5518
tion in the section. The EPC was also leveled as best as possi- ble as shown in Fig. 5. All positions and elevations of the sen- sors were surveyed and recorded for analysis. Six vertical strain gauges were installed at the bottom of the asphalt layer. The holes for the gauges were made by drilling machine. Some sand-binder mix was placed into the hole and then the gauges were inserted into it.
Fig. 6. Installation of VASG. The top steel plate is re- moved for applying some sieved mixtures over it.
Prior to paving over the gauges, the top plate was taken off as shown in Fig. 6 and some -#4 HMA mixtures were applied and compacted with tamping rod. The top plate was then re- turned and covered with more sieved mixtures. Then, the truck dumped the mixture over the sensors and compacted with no vibration. The density of the compacted mix was checked through field coring and measuring with nuclear density measuring device.
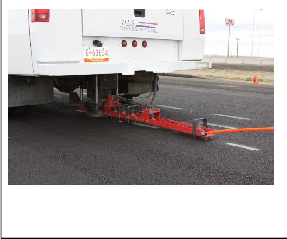
FWD tests were conducted on the final lift of the pavement in late May, 2012 in early morning as shown in Fig. 7.
Fig. 7. Conducting FW D on top of the HMA. Three types of loads were applied and the resulting surface deflec- tions were measured.
Two types of loads were used, 9 and 12 kips with two drops
of each at 0.6 m (2 ft.) interval for a length of 18 m. The result- ing surface deflections at different radial distances were measured with the sensors. The tests data were analyzed by backcalculated software ELMOD. The stiffnesses were calcu- lated using the linear elastic theory and the method of equiva- lent thickness. The average stiffness of both these methods was used numerical analysis. The pavement temperature dur- ing the FWD was not measured. However, both the FWD test- ing and sensors’ data recording were conducted at the same time to avoid the temperature incongruity. The average stiff- nesses are measured to be 2410 MPa (350 ksi), 185 MPa (27 ksi), 158 MPa (23 ksi) and 103 MPa (15 ksi) for HMA, base, PPC, and Subgrade respectively.
An axis-symmetric model is developed in ABAQUS to deter- mine the vertical strain at the installed VASGs’ elevation. The modeled section has four layers with 300 mm Surface, 144 mm Base, 200 mm Process Place and Compact (PPC) and Subgrade as shown in Fig. 8. The radius of the section and the tire pres- sure are used as 2.5 m (100") and 150 mm (6.0") respectively. The moduli of the material are taken from the Falling Weight Deflectmeter (FWD) test. These values are 2410 MPa, 185 MPa,
158 MPa and 103 MPa for HMA, base, PPC and subgrade re-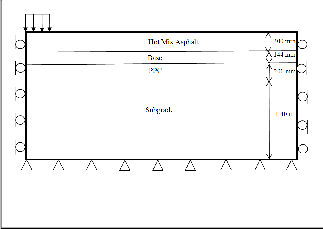
spectively. Poisson’s ratios are used as 0.35, 0.4, 0.45 and 0.45 for HMA, base, PPC and subgrade respectively [9].
Fig. 8. The developed FEM model. The section has four layers with 300 mm Surface, 144 mm Base, 200 mm PPC and Sub- grade.
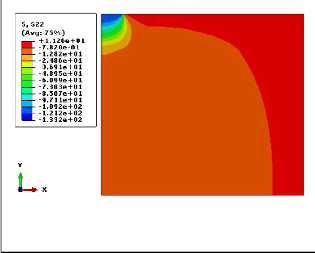
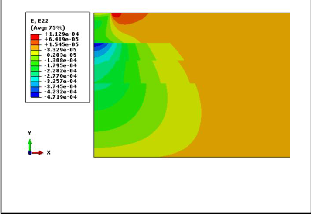
A linear elastic analysis is performed with axisymmetric, second order, and quadrilateral element, CAX8. No lateral displacement at the edges of the pavement, no vertical dis- placement at the foundation and no slip between layers are assigned as boundary conditions. The tire inflation pressure of eighteen-wheel vehicle 0.83 MPa (120 psi) is assigned in static manner. The vertical stress and the vertical strain contour plots are presented in Fig. 9 and in Fig. 10 respectively. The vertical stress decreases with the depth. However, the vertical
strain pattern depends on the stiffness of the material and
IJSER © 2013 http://www.ijser.org
International Journal of Scientific & Engineering Research Volume 4, Issue 2, February-2013 5
ISSN 2229-5518
sharply changes with change in material. The detailed results are discussed in following section.
Fig. 9. Vertical stress distribution in the section. The area under the load is highly compressed and decreases with depth. Far away, the stress is almost zero.
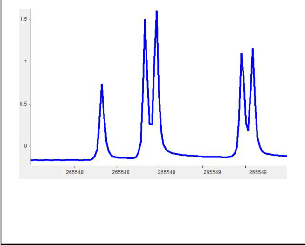
Typical vertical stress response and vertical strain strain re- sponse are presented in Fig. 11 and Fig. 12 respectively. These are the screen shots of the outputs. These show that the re- sponses of all the wheels are not same. In this study, the read- ing of the third axle wheel is considered. The calibration fac- tors are provided by the manufacturers and verified in the laboratory.
TABLE 1
VERTICAL STRESS COMPARISON TO VALIDATE FEM![]()
![]()
Top of Subgrade 0.0335 0.0337
Fig. 10. Vertical strain distribution over the section. The high- est compressive strain occurs at the top of the base. Some tensile strain develops beside the tire load.
Fig. 11. Typical stress response for an eighteen-wheel vehi- cle. The x-axis shows the time (sec) of collection and y-axis shows the output volatage. The voltage is multiplied by the calibration factor to get the stress response in psi.
The VASG measures the vertical strain at 268 mm (10.7")
depth. The EPC measures the stress response at 300 mm (12"),
369 mm (14.75"), 444 mm (17.75") and 750 mm (30") depths. Same depth response is needed to evaluate the results. FEM is developed to determine the vertical strain at 268 mm depth. The model is validated with the measured stresses at different depths. The stresses are measured with the installed EPCs. Therefore, the FEM response at 268 mm is representative of the EPC response. The stress responses at different locations of the pavement are compared with numerical analysis. The re- sults are shown in Table 1. The vertical stress on the top of base is 0.0957 MPa which is very close to the measured value (0.0961 MPa). This value decreases to 0.0337 MPa on the top of subgrade and the measured value is 0.0333 MPa. The percent- age error between stresses (FEM and measured) varies -0.43 to
1.04%, which is negligible. Thus, the EPCs responses validate
the numerical model. Now, FEM determined strain is suitable for comparison with field measured strain.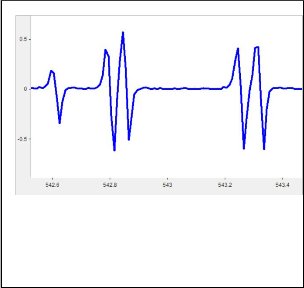
Fig. 12. Typical vertical strain for an eighteen-wheel vehicle at the depth of 268 mm. The x-axis shows the time (sec) of collection and y-axis shows the output volatage. The voltage is multiplied by the calibration factor to determine the strain response in µε.
The strain value at the VASG location is determined by the numerical analysis. The FEM output is 196 µε. The responses for VASGs are taken for 21 passes of the vehicle. The data
IJSER © 2013 http://www.ijser.org
International Journal of Scientific & Engineering Research Volume 4, Issue 2, February-2013 6
ISSN 2229-5518
ranges 192-203 µε with the mean (same with median) value of
198 µε and standard deviation of 1.63% of the mean. The dis-
tribution of the data is plotted in Fig. 13. It shows that the
mean and the mdian value are almost same. The maximum and the minimum value are 203 and 192 µε respectively. This mean value of the measured strain is 1.02% higher than the FEM (or EPC) response. This difference is very negligible. Therefore, it can be concluded that VASG correctly measurs the vertical strain in asphalt concrete.
Fig. 13. Boxplot of the measured strain data. The minimum and the maximum values are 192 and 203 µε respectively, with the mean and the median value of 198 µε and standard deviation of 1.63% of the mean value. The lower whisker is larger than the upper whisker.
The measured stress responses with the EPC at different loca- tions of the pavement are correlated with numerical study. This correlation validates the developed numerical model. The numerical response (vertical strain at 268 mm depth) of this model is then compared with the VASG response. Results show an outstanding match between the FEM and the VASG readings. Therefore, the VASG can be considered an effective
sensor to measure the vertical strain of asphalt concrete.
The authors highly acknowledge the research funding from New Mexico Department of Transportation. The authors would like to express their sincere gratitude and appreciation to Virgil Valdez, Parveez Anwar, Jeff Mann and Robert McCoy for their regular support, advice and suggestions.
[1] AASHTO, “Mechanistic-Empirical Pavement Design Guide.” A manual of Practice, AASHTO. July 2008, Interim Edition, American Associa- tion of State Highway and Transportation Officials, Washington D. C, 2008.
[2] T. Scullion , J. Uzan, J. Yazdani, and P. Chan “Field Evaluation of the
Multi-Depth Deflectometer.” FWHA Report No. TX-88/1123-2, 1988, submitted by Texas Transportation Institute, Texas A&M University, Texas.
[3] H. B. Baker and Bath, M. R. (1994). ''Minnesota Road Research Project:
Load Response Instrumentation Installation and Testing procedures.'' Report No. MN/PR-94/01, Submitted to Minnesota DOT, St. Paul, Minnesota 55155.
[4] D. Timm, A. Priest, and T. McEwen, ''Design and Instrumentation of
the Structural Pavement Experiment at the NCAT Test Track.'' NCAT Report 04-01, 2004, Submitted to Alabama DOT, Auburn, Alabama.
[5] D. Timm ''Design, Construction and Instrumentation of the 2006 Test
Track Structural Study.'' NCAT Report 09-01, 2009, Submitted to
Alabama DOT, Auburn, Alabama.
[6] A. Loulizi, I. Al-Qadi, S. Lahour, and T. Freeman, ''Data Collection and Management of the Instrumentated Smart Road Flexible Pavement Sections.'' Transportation Research Record 1769, Paper No. 01-2668,
2001, Washington D. C.
[7] W. Nassar, ''Utilization of Instrument Response of SuperPave Mixes at the Virginia Smart Road to Calibrate Laboratory Developed Fatigue Equations.'' PhD Dissertation, Department of Civil and Environmental Engineering, Virginia Polytechnic Institute and State University, Blacksburg, Virginia, 2001.
[8] www.ctlgroup.com
[9] M. R. Islam, M. U. Ahmed and R. A. Tarefder R. A. “Performance Evaluation of the Embedded Sensors in I-40 Pavement in New Mexico.” 2nd International Conference for Sustainable Design, Engineering and
Construction, ASCE, Fort Wroth, Texas, 2012, pp. 519-526.
IJSER © 2013 http://www.ijser.org