International Journal of Scientific & Engineering Research, Volume 4, Issue 9, September-2013 1204
ISSN 2229-5518
aDepartment of Chemistry, Deenbandhu Chhotu Ram University of Science and Technology
b Department of Chemistry, Kurukshetra University Kurukshetra
ABSTRACT:
A rapid, simple, selective and sensitive method for the determination of palladium in trace amounts has been developed, which is based on the reaction of 3-Hydroxy-2-(2’-thienyl)-4H-chromen-4-one with the metal ion in alkaline medium(pH 8.5-9.2). The yellow colored palladium complex formed is quantitatively extracted into chloroform, whose absorbance is measured at 455nm. A large number of cations do not interfere; whereas , amongst anions/complexing agents , only nitrite ,thiourea and Ascorbic acid show interference. It
obeys Beer’s law in the range 0.01-0.1 µg. PdmL-1. The molar absorptivity and Sandell’s sensitivity of the system are 3.301x10⁴ Lmol-1
cm-1 and 0.0032µgPdcm-1 respectively. The ratio of metal to ligand in the extracted complex is determined as 1:1.The validity of the method is tested by carrying out analysis of various samples with satisfactory results.
Key Words: palladium, 3-Hydroxy-2-(2’-thienyl)-4H-chromen-4-one, Sodium bicarbonate, chloroform, spectrophotometry.
In a wide variety of samples , palladium is generally present in very low concentrations. This fact calls for laying out better methods of trace determination, based on specific and sensitive reaction of metal ions with different ligands , which will go a long way towards its enrichment in the byproducts of many industrial processes and use in a large number of alloys with other transition elements and also as a catalyst. Though several mono- and di-oximes (1-5) have earlier been earlier been employed for complexation of palladium in acid solutions for carrying out determination after extraction into organic solvents, but the methods still![]()
*Corresponding author:
Department of Chemistry, Deenbandhu Chhotu Ram
UniversityofScience and Technology
E-mail: sonianain.chem@dcrustm.org
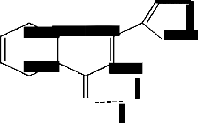
suffer from serious interferences and low sensitivity. An attempt has , therefore ,been made to work out a simple spectrophotometric method using 3-Hydroxy-2-(2’- thienyl)-4H-chromen-4-one as a complexing agent in slightly alkaline medium with a view to contain these problems to the minimum, the details of which are as under:
The reagent HTC is prepared by (10) as per details available in the method wherein solution of o- Hydroxyacetophenone(4.08g in 30 ml ethanol) and NaOH (4g in 8 ml in 50% ethanol) are mixed and stirred (2h, below 60°C) after adding thiophene-2- aldehyde (3.6g) drop wise. The orange- red mass (I,
m.p. 100°C ) thus obtained is neutralized with 0.2 molL-
1HCL and crystallized from ethanol and water . Solution of compound 1 (2g in 20 ml methanol),NaOH
IJSER © 2013 http://www.ijser.org
International Journal of Scientific & Engineering Research, Volume 4, Issue 9, September-2013 1205
ISSN 2229-5518

(8ml of 20% in methanol) and H2 O 2 (4 ml of 70 volume) are mixed , stirred (2h, below 10°C) and neutralized with CH3COOH. The yellow compound so obtained after crystallization from ethanol and water is HTC (m.p.200 °C) as under:
O
S
OH
once with an equal volume of chloroform for 30seconds. The two phases were allowed to separate and the organic layer was filtered through a whatman’s filter paper no.41 into a 10 ml volumetric flask which was made up to mark with pure chloroform. The contents were gently mixed and absorbance of the yellow colored species was measured at 455nm against pure chloroform using 1cm quartz cells. The amount of the metal ion was determined from standard curve obtained by plotting a graph between different µg amounts of Pd(11) and corresponding absorbance value following above procedure.
O
10 mm matched quartz cell was used .A stock solution of (1mg/mL) of palladium was obtained by dissolving
0.167g of PdCl2 (Sisco) in 0.75 mol L-1 HCL and was
standardized gravimetrically (6). Working solutions at the concentration level of µgmL-1 were obtained by dissolving their commonly available sodium or potassium salts in deionized water or dilute acids .The solution of 3-Hydroxy-2-(2’-thienyl)-4H-chromen-4- one(HTC) , 0.1%(m/v) was prepared by dissolving it in ethanol. Sodium bicarbonate 1M was used . Chloroform
(Ranbaxy,.A.R.) is employed for extraction
10g Pd and /or other ions in a 100ml separating funnel, add 0.9 ml of 0.1% Of HTC solution, and 0.2 ml of NaHCO3 (1M) and make up to 10 ml with distilled
water .The contents were gently mixed and equilibrated
3.1 Effect of acids/bases; Palladium (II) forms a yellow colored complex with HTC in alkaline as well as in acidic medium. The extractability and absorbance of the metal complex is high in NaHCO3 solution ,whereas it shows a relatively downward trend in Na2CO3 and NaOH. Similarly, there is a decline in absorbance value if HClO4, HCl and H2 SO4 are used under comparable aqueous conditions. Hence alkaline medium, NaHCO3 , is preferred for the system. The effect of various parameters on absorbance of Pd(II)- complex is shown in Table 1.
In neutral medium ,the absorbance of Pd- HTC complex is 0.220 and it keeps increasing with further increase in NaHCO3 concentration and is 0.310 at 0.1 to 0.3 ml of NaHCO3 (1M). At still higher alkalinity a downward trend in absorbance is observed and is 0.240 for 1 ml of NaHCO3. Therefore, 0.1-0.3 ml of NaHCO3 (1M) is considered suitable for the system.
0.310 for 0.8-1 mL of the reagent and thereafter shows a gradual fall. Therefore. 0.9 mL of HTC is considered sufficient for maximum formation of complex under experimental conditions as indicated in Table 1.
IJSER © 2013 http://www.ijser.org
International Journal of Scientific & Engineering Research, Volume 4, Issue 9, September-2013 1206
ISSN 2229-5518
![]()
![]()
![]()
![]()
confirmed by mole ratio method(9). The probable composition of the Complex is as under:
O
S
O
O Pd
H2O OH2
A-Absorbance of Pd complex measured against reagent blank
B- Absorbance of reagent blank measured against pure chloroform
0.190, ethyl acetate 0.170, amyl acetate 0.150, isobutylmethylketone 0.100, and butyl alcohol 0.110. . Therefore, Chloroform is recommended as extracting solvent for the system.
1.However, as evaluated from Ringbom plot, the
optimum concentration range of determination of Pd is
0.25-1.09gPd mL-1. The molar absorptivity and
Sandell’s sensitivity of the complex at 455nm are
3.301x10⁴ molL-1cm-1 and 0.0032 µgPdcm-2 respectively. The ratio of Pd (II) to HTC in the extracted complex was found to be 1:1 by Job’s method of
continuous variations and the same was further
)
IJSER © 2013 http://www.ijser.org
International Journal of Scientific & Engineering Research, Volume 4, Issue 9, September-2013 1207
ISSN 2229-5518
having different volume (1-10 mL) are contracted to obtain the different ratio of HTC and Pd(II). Absorbance of organic phase was plotted against mole fraction of palladium. The ratio of metal ligand was found to be
1:1.
,Sr(II),As(˅), Ti((I˅), Ag((I), Ca(II), Mg(), 10mg each ; Cr(˅I), Ba(II), Cr(III) 5mg each, Os(˅III) 2.9 mg; Co(II), Cu(II), V(˅), Zr(I˅), W(˅I), U(˅I) Mo(˅I), Rh(III),Cd(II) 1mg each; Ru(III),0.425mg ; Re(˅II)
0.3 mg; Se(I˅) 0.250mg ; Ni(II) 0.2 mg ; Ta (˅) 0.100
mg; Zr(I) 0.08 mg; Nb (˅), Zn(II) 0.050 mg each; Pt(II)
0.025mg do not show any absorbance. Fe(II, III) cause interference.
The proposed method for the micro determination of palladium is satisfactory for carrying out analysis of a wide variety of samples shown in Table -1. The method
is free from the interference of a large number of other elements of analytical interest which are generally found to be associated with the metal ion in natural samples and alloys .The results obtained are quite reproducible with a standard deviation of 0.0021% for ten replicate measurements each time with the same amount of metal ion . The method compares favourably with the existing methods (10-19) in terms of selectivity, sensitivity and rapidity.
TABLE-2
S.No. | Sample Composition Matrix* | Pd added, g | Pd found,**g |
1. | Re(0.1), W(0.1),V(0.05) | 5 | 5.3 |
2. | U(0.1), Mo(0.1),As(0.1) | 10 | 9.7 |
3. | Rh(0.100), W(0.106) | 10 | 10.5 |
4. | Cd(0.050), Os(0.05) | 4 | 4.2 |
5. | Cd(0.010), Re(0.010) | 7 | 7.3 |
6. | Ni(0.030), Pt(0.0025),V(0.0025) | 2.5 | 2.7 |
7. | Au(0.04) | 10 | 9.6 |
8. | Au(0.0025),Cu(0.013), Ag(0.012) | 6 | 5.84 |
9. | Ag(0.014),Co Ag(0.001) | 5 | 5.0 |
10. | Au(0.09) | 10 | 9.6 |
11. | Pd-charcoal catalyst | 1% | 0.98% |
*Amount of metal ion shown in parentheses is in mg.
**Average of triplicate analyses
***Composition of samples 6,7,8,9,10 corresponds to
Palau-, Palau-, Palladium-gold, copper and white gold.
IJSER © 2013 http://www.ijser.org
International Journal of Scientific & Engineering Research, Volume 4, Issue 9, September-2013 1208
ISSN 2229-5518
[1] Mensis O. and Rain T.C., Anal. Chem. ,27,1932(1955). [2] Paria P.K. and Majiumdar S.K. ; Fresenius Z. Anal.
Chem.; 275, 205(1975).
[3] Deshmukh B.K. and Kharah R.B. ; Indian J. Chem.; 14
A,214(275).
[4] Deshmukh B.K. and Awari M.S. ;
Chem.Anal.(Warsaw),32,369(1987).
[5] uesugi K. and yamaguchi S.; Bunseld kaga ka,
28,268(1979).
[6] Vogel A.I.; A Text book of Quantitative Inorganic
Analysis, 4th edn. Longmans, London,1978,P.474. [7] 7.Ringbom A.; Fresenius Z. Anal. Chem.
115,332(1938).
[8] A. Carvaiser, Bull. Soc.Chem. ;Fr.528,(1962). [9] Job A.; Ann Chim,9, 113(1928).
[10] Desai B.J. and Shinde V. M. ; Fresenius Z. Anal.
Chem.;298,158,(1979).
[11] Majumdar S.K.; Chattopadhyay P.; Paria, P. K.; J.
Indian Chem. Soc.; 62, 544,(1985).
[12] Barhate V.B.; Paul M.R.; Indian J. Chem.; 29A ,
827*(1990).
[13] Saraswati K, Lakshmi A VS; Ramanna UV; J. Indian
Chem. Soc.; 69, 795,(1992).
[14] Paria P.K.; Sarkar A.; Majumdar S.K.; Indian J.
Chem.; 32 A,647(1993).
[15] Kawatkar S.G. and Ramchandra ,Nimbalkar V.; J.
Indian Chem. Soc.;74, 69(1997).
[16] Ren. M, F4 L.; Bai J . Dong. B. and Ren Y.; jilin Daxul
Ziran Kexue Xuebao, 94(1998).
[17] 17.Wang Bi.; Qin S.; Liu Y.; Ruan S.; Zhang M.; Lihua
Jianyan , Huaxue Fence,39(6), 349-352(2003).
[18] 18. Li H.; Y Lu Y.; Jinan Daxue Boo, Ziran Kexueban,
17(3), 271-273(2003).
[19] 19. Patel ,K.S. Sharma , P. L. ; Aggarwal S. G.; Hoffmann P.; Anal Left., 33(3), 503-119(2000).
IJSER © 2013 http://www.ijser.org