International Journal of Scientific & Engineering Research, Volume 5, Issue 9, September-2014 640
ISSN 2229-5518
Experimental and Simulation based
comparative analysis of UFAD and OHAD in
Air-conditioning of room
Om pr akash Ah ir war 1 , N eer aj k umar Ah ir war2 , Ishwar Singh3
1ahirwar.omprakash@gmail.com
3ishwar.manit@gmail.com
Scope College of Engineering, Bhopal, M.P., India1, 2, 3
Abstract: This research compared the air use for under floor and over head air supply displacement ventilation system in a close chamber. It has several potential advantages compared to conventional overhead (OH) mixing systems. However, most of the energy simulation programs widely used by the industry are not able to represent two distinct features of UFAD systems: room air stratification and the underfloor supply plenum. This study reports a field study of simulation of the result analysis UFAD and OHAD system in terms of relative humidity, ventilation performance and temperature stratification one of the sources of energy use. Overall, the performance of UFAD was substantially better than would be expected for an overhead mixing ventilation system.
Keywords: UFAD, OHAD, Air-conditioning, CFD technology, Diffusers, Relative Humidity (%), Velocity (m/sec), Temperature(°C),
—————————— ——————————
I. INTRODUCTION
In this era of technology, humans have facing a serious shortage of resources. Saving energy has become the focus in countries around the world. In energy consumption, buildings section is the main energy consumer, among which air conditioning system is up to 60%~70%. There-fore, to save energy, the prospect of energy efficiency of air conditioning is very broad. In addition, as people's indoor retention time increase gradually, indoor air quality is directly related to the personnel health and work efficiency. Sick building syndrome caused by the bad indoor ventilation has aroused wide attention of all social sectors, so the improvement of the indoor air quality (IAQ) has become one of the problems which should be solved in air conditioning system.
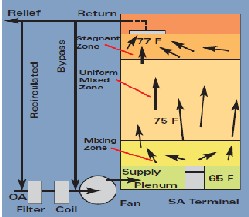
Underfloor air distribution system (UFAD) is a mechanical air distribution strategy in which the conditioned air is primarily delivered to the zone from a pressurized plenum through floor-mounted diffusers. The benefits include indoor air quality, thermal comfort, and reduced energy use. The energy benefits depend on the climate conditions. These systems are increasingly popular alternatives to the traditional overhead systems, which attempt to condition the air in the whole volume of space.
Under-floor air distribution system has been used
more and more widely in office buildings because of its superiority of flexibility, energy saving, lower investment, improvement of comfort and health, and satisfaction with individual requirement of local thermal environment control. In this paper first a review on the application and development of under-floor air condition system has been carried. Then an office room with under- floor air condition has been simulated to learn the indoor temperature field, velocity field and thermal comfort in the circumstances of under floor air distribution.
Through the simulation and analysis, when human
feel the most comfortable in under floor air distribution room, parameters such as air temperature, air velocity and air supply
volume have been obtained. This research work aims to demonstrate how CFD technology can be used to under floor air distribution and overhead air distribution parameter like velocity, temperature, and different mole fraction relative etc, and compare them a practically.
(a)
(b)
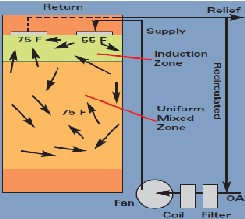
Figure 1: (a) UFAD and (b) OHAD system [22]
IJSER © 2014 http://www.ijser.org
International Journal of Scientific & Engineering Research, Volume 5, Issue 9, September-2014 641
ISSN 2229-5518
The systems are designed for the lower occupied zone only. The temperature conditions in the upper zone are allowed to float above normal comfort ranges. To avoid occupant discomfort, air is introduced into the space between 65°F and
68°F.
For overhead air distribution system, cooled air enters the occupied zone through an inlet located at the ceiling level supplying a vertical downward inflow. Three different locations of the inlet diffuser are considered. For overhead air distribution system, the inlet is located on the ceiling with slower and cooler inflow. For overhead well mixed systems, one should select a unit with throw at max, and minimum, flow that meets ADPI guidelines based on diffuser spacing and T50 (throw to 50 fpm). Additionally, select for maximum mixing:
Noise can be good.
Dirt on the ceiling is not bad.
Air Distribution Effectiveness (ADE) is a new term describing room air mixing, and is a parameter with all delivery methods.
II. UFAD SYSTEM DESIGN
The key UFAD system components that are unique to this system type are the raised floor and the floor diffusers. Figure 2 shows a typical raised floor construction where wood walls space length 2 meter and space width 1.2 meter, Ceiling height = 0.022 m, are supported on each corner by steel pedestals. Typical heights for raised floors are in the range of
12 to 15 inches from top of the structural floor to top of the raised floor. Many times the raised floor is made accessible so that data and other building services can be run in the supply plenum, although this is not always the case.
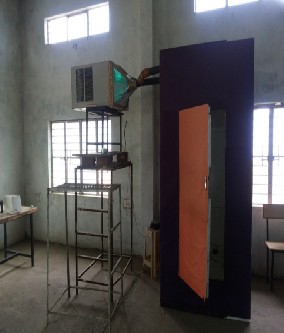
Figure 2: Typical Raised Floor Construction
that mixes cold supply air quickly with room air. The design airflow quantity for a swirl diffuser is usually around 85 cfm per diffuser at roughly 0.5” pressure drop. Air discharged through the diffuser generally reaches a velocity of 50 feet per minute somewhere in the range of 4 to 5 feet above the diffuser. There are basically two major types of UFAD
diffusers: swirl and variable area. Figure 3 shows floor
diffuser.
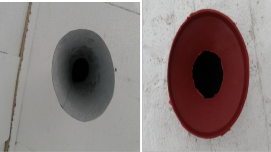
Figure 3: Typical floor diffusers
TABLE 1: UFAD DIFFUSER COMPARISON DATA
Model | Discharge Setting | Airflow [ft3/min] | Vertical Throw to 50 fpm [ft] | Clear Zone Radius [ft] |
Swirl | Vertical Vertical | 100 75 | 4 – 6 2.5 - 4.5 | 1.5 1.5 |
Variable Area | Vertical Full Spread | 150 110 | 8 5 | 2.0 4.5 |
Both VA diffusers and swirl diffusers can be used in VAV applications of UFAD systems. With a VA diffuser, because the exposed area of diffuser plate varies proportionally to the airflow demand, the discharge velocity of the air leaving the diffuser stays relatively constant as the diffuser turns down. The momentum, mixing vs. buoyancy and stratification characteristic of a VA diffuser does not change nearly as much as a swirl diffuser as described above.
B: Mathematical Formulation
This chapter is a review of general theory of the governing equations for fluid flow. The governing equations of fluid flow are called the Navier-Stokes equations. In this section, concisely we will discuss the principles of the CFD with its components. Moreover, fundamental description of turbulence will be described. The Governing Equations are;
Mass Conservation Equation:

𝜕𝜌 + ∇. 𝜌𝑈 = 0 (1)
𝜕𝑡
Momentum Equation:

𝜕𝜌(𝑢,𝑣,𝑤)𝑇 + (∇𝜌𝑈𝑢, ∇. 𝜌𝑈𝑣, ∇. 𝜌𝑈𝑤)𝑇 +
𝜕𝑡
A: The Diffusers

(− 𝜌𝑤 2
𝑟
, 𝜌𝑔,

𝜌𝑢𝑤
𝑟
)𝑇 = −∇𝜋 + ∇. 𝜏 (2)
The diffusers are the other unique element of UFAD
systems. Diffusers are passive HVAC elements that have no moving parts. The blades of the diffuser are arranged in a radial pattern and are designed with an outward throw angle. The concept behind the swirl is a high induction characteristic
Energy Equation:

𝜕𝜌ℎ + ∇. 𝜌𝑈ℎ = ∇. 𝜆 ∇𝑇 − ∇. 𝑞 + ∇. ∑ 𝜌ℎ (𝑇)𝐷 ∇𝑌
𝜕𝑡
(3)
Species Equation
IJSER © 2014 http://www.ijser.org
International Journal of Scientific & Engineering Research, Volume 5, Issue 9, September-2014 642
ISSN 2229-5518
𝜕𝜌𝑌𝑖 + ∇. 𝜌𝑈𝑌 = ∇. 𝐷 𝜌∇𝑌 − 𝑅

𝜕𝑡
𝑖 𝑒 𝑖
𝑖
(4)
The enthalpy h is defined by:
ℎ = ∑𝑖 𝑌𝑖 ℎ𝑖 (𝑇) (5)
Where ℎ𝑖 (𝑇), is the specific enthalpy of species i, includes
the heat of formation of i. When needed, T is computed using
h, Yi. Where Y, h, λe, ρ and Ri are the enthalpy mass fraction, effective diffusivity and the flow density and mass rate of consumption of species respectively.
C: Turbulence Model
Turbulence is simulated using the Standard k-ε model. In this model, the model transport equations are solved for two turbulence quantities i.e., k and ε. The Standard k-ε model turbulence model solves the flow based on the assumption that the rate of production and dissipation of turbulent flows are in near- balance in energy transfer. The k and ε equations are given by:
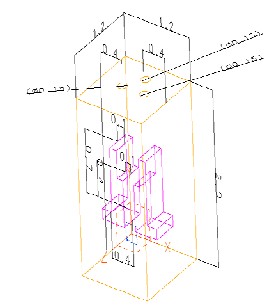
Figure 4: CAD model of Underfloor air distribution system
𝜕𝜌𝑘 + ∇. 𝜌𝑈𝑘 = ∇. (𝛼𝜇∇. 𝑘) − 𝑅
𝜕𝑈𝑖 − 𝜌𝜖 (6)

𝜕𝑡

𝑖𝑗 𝜕 𝑥𝑗


2
Overhead air distribution system supplying air
farther to the


𝜕𝜌𝜖 + ∇. 𝜌𝑈𝜖 = ∇. �𝜇𝑡 + 𝜇� ∇ϵ − C . ϵ R
∂Ui − C ρ ϵ
standard approach Fresh air is delivered
(
𝜕𝑡
𝜎𝑡
1 k ij ∂xj 2 k
occupants.ceiling-to-ceiling air flow pattern provides improved
The standard value of k-є is used.
(7)
Indoor air quality in occupied zone.The suppy air temperature
can be 2-5°C higher than that in a ceiling based system
D: Model formulation for the System
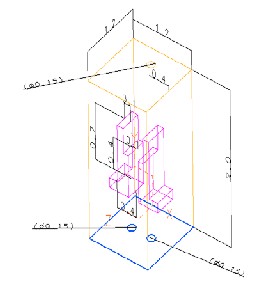
The numerical simulation of the ceiling air distribution (CAD) system and numerical simulation of the under floor air distribution (UFAD) system, based on the dimensions of the air conditioning of a room, is studied using a computational fluid dynamics (CFD) technique. The CAD system of the air conditioning of a room included three cone diffusers. The analysis of the experimental system is made and a simplified geometry of the air conditioning of a room for UFAD and CAD system simulation is generated .The initial computational domain data for simulating the CAD and UFAD systems of air conditioning of a room is shown in Figure 4 and Figure 5.
Parameters for test space of the air conditioning of a room were:
• Space length = 2.0 m
• Space width = 1.2 m
• Ceiling height = 0.022 m
• Plenum height =0 .022 m
• Space floor area = 1.47 m2
• Air diffusion performance index >80
• Room wall surface temp, Temp = 36 (°C).
Underfloor approachFresh air is delivered closer to the occupantsFloor-to-ceiling air flow pattern provides improved Indoor air quality in occupied zone (up to 6 ft [1.8 m]).Local air supply improves air motion, preventing sensation of stagnant air.The suppy air temperature can be 2-5°C higher than that in a ceiling based system.
Figure 5: CAD model of over head air distribution system
E: Experimental Setup & Initial Boundary Conditions
The principle of this task compared the performance of UFAD and CAD systems. The conventional air distribution system has two ceiling diffusers, and one return air diffuser ceiling, as shown in Figure 6 and Figure 7. The UFAD system has an under floor plenum, and two floor diffusers, as shown in Figure 8 and Figure 9. The return air diffuser is the same as the CAD system.
IJSER © 2014 http://www.ijser.org
International Journal of Scientific & Engineering Research, Volume 5, Issue 9, September-2014 643

ISSN 2229-5518
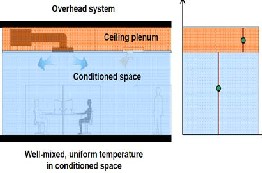
Figure 6: Model of Overhead air distribution system
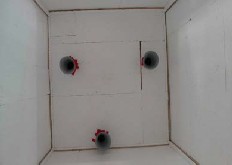
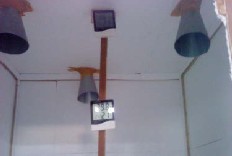
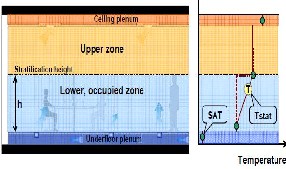
Figure 7: Experimental model of Overhead air distribution system
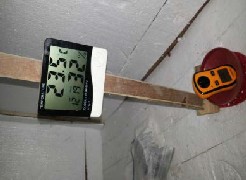
Figure 8: Model of Underfloor air distribution system
Figure 9: Experimental model of UFAD system
The meshing of UFAD and OHAD systems are shown in Figure 10 and Figure 11 respectively with following details. No .of nodes are 2342 and No. of element are 1605.
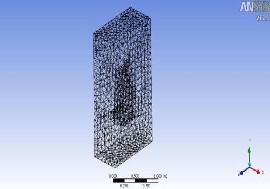
Figure 10: Meshing of under floor air distribution system
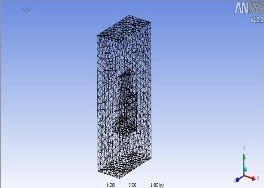
Figure 11: Meshing of overhead air distribution system
TABLE 2: INITIAL BOUNDARY CONDITIONS
Air Distribution System | Underfloor | Overhead |
Inlet temperature of air | 20°C | 18°C |
Inlet speed of air | 1.0 m/s | 0.6 m/s |
Inlet direction | Vertical upward | Vertical downward |
IJSER © 2014 http://www.ijser.org
International Journal of Scientific & Engineering Research, Volume 5, Issue 9, September-2014 644
ISSN 2229-5518
Human body temperature considers is 40°C. Sidewall
temperature considers is 36°C. Ceiling temperature considers is 36°C. Floor temperature considers is 36°C. Turbulent intensity is 1% and turbulent viscosity ratio is 1 and the Pressure of air in outlet condition is atmospheric pressure and gauge pressure is zero.
F: Problem Solution
The following Solution method is as follows:
a) Pressure of air consider as atmospheric pressure
Energy equation:

𝛿 �𝜌𝑢 𝐶 𝑇� = 𝛿
�𝜆 𝛿𝑇 − 𝜌𝑢���′�𝑇��′ � (8)


𝛿 𝑥𝑗
𝑗 𝑝
𝛿 𝑥𝑗


𝛿 𝑥𝑗 𝚥
Where ρ is the density, μ is the viscosity, p is the pressure, CP is the specific heat capacity, λ is the thermal conductivity. Momentum equation:


𝛿 �𝜌𝑈 𝑈 � = − 𝛿𝑃 + 𝛿
�𝜇 �𝛿𝑈𝑖 + 𝛿𝑈𝑗 � − 𝜌𝑢� �′�𝑢� �′ � − 𝜌𝑔


𝛿 𝑥𝑗
𝑖 𝑗
𝛿𝑥𝑖
𝛿𝑥𝑗


𝛿 𝑥𝑗
(9)
𝛿 𝑥𝑖
𝚤 𝚥 𝑖
Where ρ is the density, μ is the viscosity, p is the pressure,
CPis the specific heat capacity, λ is the thermal conductivity.
b) Turbulent kinetic energy turbulence dissipation
The specific turbulence dissipation  is the rate at which turbulence kinetic energy is converted into thermal internal energy per unit volume and time. Sometimes the specific turbulence dissipation,
  , is also referred to as the mean frequency of the turbulence. This is mainly based on dimensional analysis. The SI unit of ω is 1/s.
There is no strict mathematical definition of the specific turbulence dissipation, ω. Instead it is most often defined implicitly using the turbulence kinetic energy, k and the turbulence dissipation, ε:
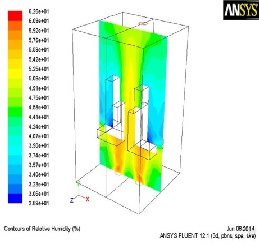
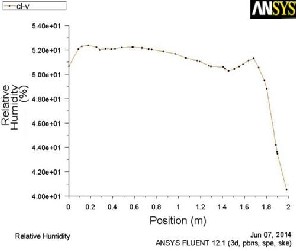
Figure 12: Analysis of Relative humidity (%) in under floor air distribution system

𝜔 = 𝜖
𝑘𝛽∗
(10)
Where β* a model is constant, most often set to:
β* = Cµ = 0.09
Please note that some models/codes instead use a different
definition without the model constant:

𝜔 = 𝜖

𝑘
(11)
Solution initialization- Solution initialization at inlet condition
Run calculation-Number of iteration is 500
RESULTS
A: Result of Underfloor Air Distribution System
TABLE 3: EXPERIMENTAL RESULTS OF UFAD SYSTEM
(a)
S. No | Time (min) | Temp (°C) | RH (%) | Velocit y (m/s) | Heigh t (m) | Power (Kwh) |
1 | 30 min | 25 | 47 | 1.5 | .4 | 1122.5 |
1 | 30 min | 24.5 | 49 | 2.1 | .8 | 1122.5 |
1 | 30 min | 25 | 50 | 1.7 | 1.2 | 1122.5 |
1 | 30 min | 27 | 51 | 1.5 | 1.6 | 1122.5 |
2 | 30 min | 26 | 50 | 1.6 | .4 | 1123.2 |
2 | 30 min | 24 | 49 | 2.1 | .8 | 1123.2 |
2 | 30 min | 25 | 52 | 1.6 | 1.2 | 1123.2 |
IJSER © 2014 http://www.ijser.org
International Journal of Scientific & Engineering Research, Volume 5, Issue 9, September-2014 645
ISSN 2229-5518
UFAD Relative Humidity Graph
UFAD Velocity Graph
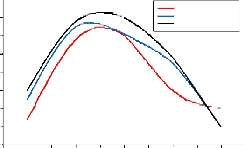
55
Relative Humidity-1
54 Relative Humidity-2
Relative Humidity-3
53
2.4
2.2
2.0
Velocity-1
Velocity-2
Velocity-3
52
1.8
51
1.6
50
49 1.4
48 1.2
47
0.2 0.4 0.6 0.8 1.0 1.2 1.4 1.6 1.8 2.0 2.2
Height(m)
(b)
1.0
0.0 0.5 1.0 1.5 2.0
Height
(b)
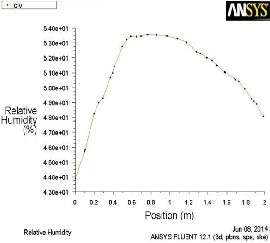
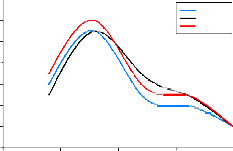
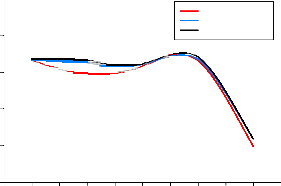
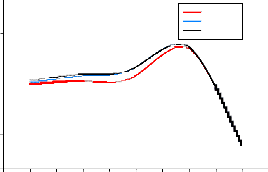
Figure 13: (a) Simulated Graph and (b) Experimental based Graph between Position & Relative Humidity (%) in UFAD system
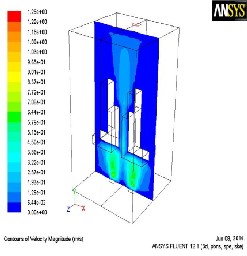
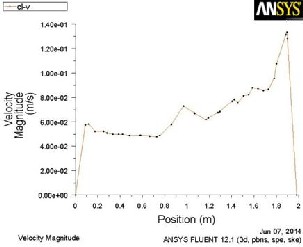
Figure 14: Analysis of Air Velocity in Under floor air distribution system
(a)
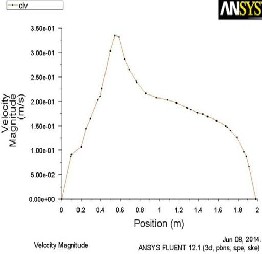
Figure 15: (a) Simulated Graph & (b) Experimental based Graph between Position and Velocity (m/s) in UFAD system
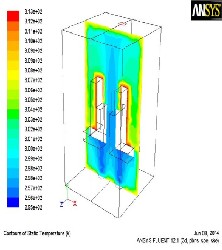
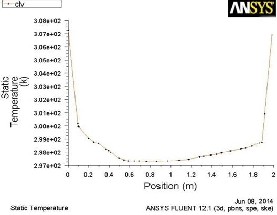
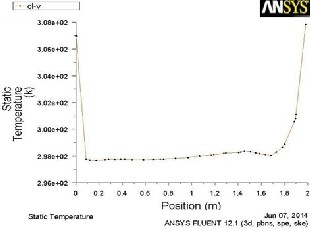
Figure 16: Analysis of air Temperature in UFAD system
IJSER © 2014 http://www.ijser.org
International Journal of Scientific & Engineering Research, Volume 5, Issue 9, September-2014 646
ISSN 2229-5518
UFAD Temprature Graph
30
29
28
27
26
25
Temprature-1
Temprature-2
Temprature-3
(a)
24
0.2 0.4 0.6 0.8 1.0 1.2 1.4 1.6 1.8 2.0 2.2
Height(m)
(b)
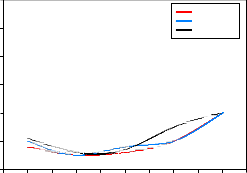
Figure 17: (a) Simulated Graph & (b) Experimental based graph between Position and Temperature (oC) in UFAD systems
B: Result of Overhead Air Distribution System
TABLE 4: EXPERIMENTAL RESULTS OF OHAD SYSTEM Sub Meter Reading-Initial Reading:-1115.1 Kwh
(a)
OHAD Relative Humidity Graph
Relative Humidity-1
Relative Humidity-2
Relative Humidity-3
55
50
45
40
35
0.2 0.4 0.6 0.8 1.0 1.2 1.4 1.6 1.8 2.0 2.2
Height(m)
(b)
Figure 19: (a) Simulated Graph & (b) Experimental based Graph between Position and Relative Humidity (%)) in Overhead air distribution system
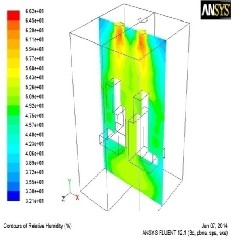
Figure 18: Analysis of Relative Humidity (%) in Overhead air distribution system
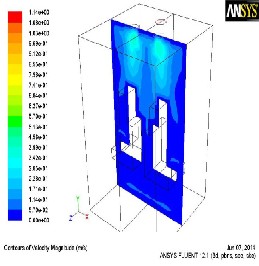
Figure 20: Analysis of air Velocity in Overhead air distribution system
IJSER © 2014 http://www.ijser.org
International Journal of Scientific & Engineering Research, Volume 5, Issue 9, September-2014 647
ISSN 2229-5518
(a)
OHAH Velocity Graph
(a)
OHAD Temprature Graph
10 40
Velocity-1
Velocity-2 38
8 Velocity-3
36
Temprature-1
Temprature-2
Temprature-3
6 34
32
4
30
2 28
26
0
0.2 0.4 0.6 0.8 1.0 1.2 1.4 1.6 1.8 2.0 2.2
Height(m)
(b)
24
0.2 0.4 0.6 0.8 1.0 1.2 1.4 1.6 1.8 2.0 2.2
Height(m)
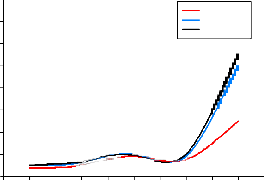
Figure 21: (a) Simulated Graph & (b) Experimental based graph
between Position and Velocity (m/s)) in Overhead air distribution system
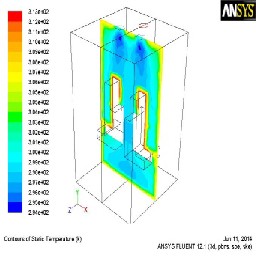
Figure 22: Analysis of air Temperature in Overhead air distribution system
(b)
Figure 23: (a) Simulated Graph & (b) Experimental based Graph between position and temperature (OC) in OHAD system
C: Comparative analysis of energy consumption
TABLE 5: COMPARISON OF ENERGY CONSUMPTION
Air Distribution System | Under Floor | Over head | Energy Saving |
Power consumption for cooling the occupied space | 1.4 KWh | 1.8 KWh | 22% |
D: Comparative Analysis of UFAD & OHAD system
TABLE 6: ANALYSIS BASED COMPARATIVE VARIATION BETWEEN UFAD & OHAD
IJSER © 2014 http://www.ijser.org
International Journal of Scientific & Engineering Research, Volume 5, Issue 9, September-2014 648
ISSN 2229-5518
CONCLUSIONS
Generally speaking, both systems will allow for good occupant comfort. Control for the underfloor system is achieved through the use of adjustable diffusers. It is easy to add or remove diffusers as needed without the use of specialized equipment or technicians. The overhead system does not offer the same level of flexibility as the under floor system .UFAD allow for maximum flexibility during staff movement in building layouts without being restricted by the design of the HVAC and electrical systems. The schematic model that is completed to compare the energy consumption on the systems shows that UFAD is more energy efficient then OHAD systems and by allowing personal control of the local thermal environment. Experimental results are in good agreement with simulated results which validates the design strategy and the UFAD system. In future systems have to be designed and operated in such a manner that they produce hot and cold complaints similar to existing conventional systems despite the potential to achieve better comfort performance in UFAD systems.
ACKNOWLEDGEMENT
I express my deep gratitude to my guide, Prof. Ishwar Singh who gave me the inspiration to pursue the project and guided me in this endeavour. He has been a constant source of motivation and encouragement for us. I thank him for all the initiative and zeal he filled us with throughout the work.
My profound sense of gratitude is due to our Head of mechanical Engineering department, Prof. Anurag Kulshrestha for constant encouragement and valuable guidance. I am thankful to all the respected faculty members of Scope College of Engineering; Bhopal without their support at various stages, this project wouldn't have materialized. We are also thankful to all the supporting staff at the institute who directly or indirectly helped us in completing our project.
I am very thankful to Dr. D.S. Raghav, Principal, SCE Bhopal for their blessing and encouragement. I am also thankful to Prof. Sanjeev Gupta, Dean (Academic) and Prof. V.S. Agarwal, Dean (PG Studies) for providing all the facilities that was needed for this cause. (O mprak as h A hirwar)
REFERENCES
[1] American Society of Heating, Refrigerating, and Air Conditioning Engineers, Inc., Atlanta, “ASHRAE Handbook of Fundamentals”, ASHRAE 2003.
[2] Brown, M. "Underfloor Air Conditioning Systems: Principles and Applications", Carrier Global Engineering Conference, 2000.
[3] Son H. Ho, Luis Rosario and Muhammad M. Rahman, “Comparison of underfloor and overhead air distribution systems in an office environment”, Building and Environment, 46 (2011), 1415-1427.
[4] Bauman, F. and T. Webster, 2001. "Outlook for
Underfloor Air Distribution", ASHRAE Journal, June
2001, 18-27. American Society of Heating, Refrigerating and Air-Conditioning Engineers, Inc ASHRAE Journal Pp 18-27 June 2001
[5] Tom Webster, Fred Bauman and Jim Reese, “Underfloor
Air Distribution: Thermal Stratification” American
Society of Heating, Refrigerating, and Air Conditioning
Engineers (ASHRAE) Journal, May 2002.
[6] Y.J.P. Lin, T.Y. Tsai, “An experimental study on a full- scale indoor thermal environment using an Under-Floor Air Distribution system”, Energy and Buildings, 80 (2014), 321–330.
[7] Y.J.P. Lin, P.F. Linden, A model for an under floor air
distribution system, Energy and Buildings 37 (4) (2005)
399–409.
[8] Erik L. Olsen, Qinyan (Yan) Chen, “Energy consumption and comfort analysis for different low-energy cooling systems in a mild climate”, Energy and Buildings 35 (2003) 561–571.
[9] B.F. Yu, Z.B. Hu, M. Liu, H.L. Yang, Q.X. Kong, Y.H.
Liu, “Review of research on air-conditioning systems and indoor air quality control for human health”, International journal of refrigeration 32 (2009) 03–20.
[10] Kwang Ho Lee, Stefano Schiavon, Fred Bauman, Tom Webster, “Thermal decay in underfloor air distribution (UFAD) systems: Fundamentals and influence on system performance”, Applied Energy 91 (2012) 197–207.
[11] C.Y.H. Chao, M.P. Wan, “Airflow and air temperature distribution in the occupied region of an underfloor ventilation system”, Building and Environment 39 (2004)
749–762.
[12] Jae Dong Chung, Hiki Hong, Hoseon Yoo, “Analysis on the impact of mean radiant temperature for the thermal comfort of underfloor air distribution systems”, Energy and Buildings”, 42 (2010) 2353–2359.
[13] Kwang Ho Lee, Sang Min Kim, Jong Ho Yoon, “Supply
air temperature impact in underfloor air distribution systems under Korean climatic conditions: Energy, humidity and comfort”, Energy and Buildings 58 (2013)
363–371.
[14] Gon Kim, Laura Schaefer, Tae Sub Lim, Jeong Tai Kim, “Thermal comfort prediction of an underfloor air distribution system in a large indoor environment”, Energy and Buildings 64 (2013) 323–331.
[15] Kai Zhang, Xiaosong Zhanga, Shuhong Li, Xing Jin, “Experimental study on the characteristics of supply air for UFADsystem with perforated tiles”, Energy and Buildings 80 (2014) 1–6.
[16] Yan Xue, Qingyan Chen, “Influence of floor plenum on energy performance of buildings with UFAD systems”, Energy and Buildings 79 (2014) 74–83.
[17] Dusan Katunsky, Martin Lopusniak and Anna Vaskova, “Temperature Stratification of Underfloor and Ceiling Based Air Heating Distribution System in an Experimental Room”, SSP - Journal Of Civil Engineering Vol. 8, Issue 1, pp 43-50, 2013.
[18] Peter V. Nielsen, Tine S. Larsen, Claus Topp, “ Design methods for air distribution systems and comparison between mixing ventilation and displacement ventilation” Nov 2003
[19] Marlin S. Addison & Daniel H. Nall, “Cooling via Underfloor Air Distribution: Current Design Issues and Analysis Options” Cooling Frontiers: The Advanced Edge of Cooling Research and Applications in the Built Environment, College of Architecture and Environmental Design, Arizona State University, Dec 2001
[20] Eduard Cubi Montanya, David Keith, and Jim Love, “Integrated Design & UFAD” American Society of
IJSER © 2014 http://www.ijser.org
International Journal of Scientific & Engineering Research, Volume 5, Issue 9, September-2014 649
ISSN 2229-5518
Heating, Refrigerating and Air-Conditioning Engineers,
Inc. ASHRAE Journal, Vol. 51, pp30-40, July 2009.
[21] Allan Daly, “Underfloor Air Distribution: Lessons Learned”, American Society of Heating, Refrigerating and Air-Conditioning Engineers, Inc. ASHRAE Journal pp 21-24 May 2002.
[22] James E. Woods, “What Real-World Experience Says
about the UFAD Alternative”, TABB Talk for ASHRAE, Testing Adjusting and Balancing Bureau, (http://www.tabcertified.org) pp 03-14.
[23] K. Fukao, M. Ichihara, M. Oguro, Comparison of underfloor vs. Overhead air distribution systems in an office building, ASHRAE Transactions 108 (1) (2002) Pp
64–71.
[24] Dennis P. Sczomak, P.E., Member ASHRAE, and Thom Barry, P.E., Member ASHRAE, "Underfloor for Technology Firm". American Society of Heating, Refrigerating and Air-Conditioning Engineers, Inc. ASHRAE Journal (www.ashrae.org). Vol. 48, Pp 57-59, April 2006.
IJSER © 2014 http://www.ijser.org