International Journal of Scientific & Engineering Research Volume 4, Issue 2, February-2013 1
ISSN 2229-5518 1
Experimental Study of Water Hammer Phenomena in Drinking Water Pipeline Distribution Using Video Camera Method
Agus Maryono, Suhanan, Adhy Kurniawan, Masrur Alatas, Alan Maris Ridho Akhita, Arif Budi Wicaksono
Abstract— The huge energy potencies in the pressure release chamber on the drinking water pipeline distribution can be utilized by installing the micro hydropower turbine. The problem that may be occurred is the water hammer effect which is caused by sudden closure of a valve or malfunction of the turbine. Water hammer means a transient condition of fluid that is occurred while hydraulic operation. An initial steady state hydraulic flow suddenly changes because of valve off or clogging. This transient wave leads to a high pressure change dramatically that may damage the penstock, break the seal or break the turbine. Therefore prevention of water hammer phenomena should be taken in account properly. This research is an experimental study on micro hydropower turbine in the laboratory scale intended to provide solutions for reducing water hammer effect. The research is conducted to observe the effect of time closure of the valve to water hammer and the solution due to installation of bifurcation pipe as a release valve before the turbine inlet. This research proposes a simple method by using a video camera and slow motion playback to observe the water hammer effect, so that the pressure transient can be captured. This research resulted that the method using video camera and slow motion playback can be used effectively to visualize the pressure transient, and the water hammer effect can be reduced with the delaying of time closure of the valve. The bifurcation did not give significant result in reducing the water hammer effect compared to pipe with turbine without bifurcation. These results are also comparable with the theoretical calculation.
Index Terms— bifurcation pipe, drinking water pipeline, micro hydro, turbine, water hammer, valve closure, video camera.
—————————— ——————————
NDONESIA fulfills drinking water needs of its people through Water Companies (PDAM). Water supply sys- tems including piping are managed by PDAM of each district and/or city. Water is delivered by large diameter steel pipelines into a hundred of small pipelines leading to resi- dents. Generally, drinking water pipelines come from high head reservoir with high pressure that can be utilized for al- ternative energy resources by installing micro hydropower plant. Unfortunately, until today those potencies are allowed
to simply fall apart on the pressure release chamber.
Micro hydropower plant is the best way to utilize those po-
tencies. However, the development of micro hydro power
plant (using a drinking water pipeline as a penstock) is con- strained by the effect of water hammer (pressure shock) which is mainly caused by faulty system operation such as an instan- taneously closure of the valve. The impacts of the water ham-
mer are the rupture of pipes, pipe holders, pipe fittings, valves, and as well as turbines.
Water hammer has become an interesting assessment in applied hydraulics and mechanic fluid since ninetieth century. Theoretically, there are several methods to calculate or predict a maximum pressure change and the character of transient pressure due to water hammer. Ghidoui et.al (2005) gives a description of derivation from mass momentum equation and continuity equation. Together these equations provide a nu- merical solution that can be solved by using several appropri- ates software. The implementation of finite element method called Method of Characteristics (MOC) was conducted by Hariri [7]. The author compared transient pressure properties for different material and dimension of penstock as an eco- nomical consideration for the further. MOC is believed to be the simplest numerical method among the others after Sarma
[10]. It transforms the partial differential equation to be an ordinary differential equation and pressure change by varying a friction factor of the penstock. Furthermore, for calculating the pressure change occurred due to water hammer, the sim- ple empirical formula after Joukowski in Ghidaoui et.al [3] can be used.
This research is a laboratory scale experiment which re- flects to PDAM pressured drinking water pipeline as a pen- stock for micro hydropower plant. The test rig was designed using PVC pipe 3 inch in diameter, equipped by a ball valve with a same diameter. Briefly, pressure change that is oc- curred due to water hammer effect was observed by using manometers which is installed along the penstock. Each ma- nometer will describe a changing in static pressure of inner surface of the penstock. The simple empirical formula known as Joukowski formula in Ghidaoui [3] is playing a role as a comparison.
This research aims to describe the water hammer characteris- tics in PDAM pipeline (penstock of micro hydropower plant), represent by the test rig in laboratory. This research proposes a solution to reduce water hammer, by varying a time closure of the valve from 1 second until 10 seconds (gradual closure). Meanwhile, the measurement of pressure change was per- formed by using manometer. This device was installed in 4 point of observations along the penstock; point A, B, C and D. This research also provides the new method in observing wa- ter hammer using video camera. At the time the valve is closed (1 second, 2 seconds, etc.) any movement of mercury
IJSER © 2013 http://www.ijser.org
International Journal of Scientific & Engineering Research Volume 4, Issue 2, February-2013 2
ISSN 2229-5518 2
inside the manometer will be simply recorded by this video camera.
Then, the character of transient flow which is represented by movement of mercury will be clearly visible in slow motion video playback. Each peak point can be marked and then de- picted in X and Y coordinates by using Microsoft Excel. This method will be implemented in three conditions; free pen- stock, penstock with cross flow turbine installation and pen- stock with turbine together with bifurcation pipe installation. The most important objective in this research is to obtain a description of water pressure change due to the water ham- mer with a variation of time closure of the valve in the pen- stock, including the maximum and minimum pressure oc- curred.
The impact of variation time closure of the valve from 1 se- cond until 10 seconds (gradual closure) in reducing pressure change will be revealed as the experimental results which are being compared with the theoretical one. The reliability of video camera recording method also will have shown as trend lines from comparison graphs that revealed (see 2.3). The re- sults of video camera indicates that the maximum and mini- mum pressure change in all of points A, B, C and D and also the pressure change at every experimental condition.
The test rig installation was begun with elbow and PVC pipe (penstock) assembling (Fig.1). Those have a same diameter from the inlet of reservoir to the valve. PVC assembling pro- cess is using PVC glue to unsure there is no leakage occurred on the fitting pipe (penstock).
This installation is continued with valve assembling. The valve that used in this experiment is ball valve and has the same diameter with the PVC penstock. The ball valve is the most appropriate one for this research, due to the convenience in closing it with the variety of time i.e. 1 second until 10 se- conds closure.
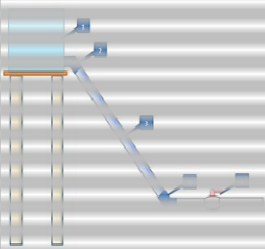
Fig. 1 shows the main concept of experimental device in- stallation. It contains of reservoir (number 1), PVC elbow 45° (number 2), PVC pipe as penstock with 3inch in diameter and
3,5 meters in length (number 3), PVC elbow 45° at the bottom (number 4) and ball valve 90° shut-open with 3 inch in diame- ter (number 5). Bifurcation pipe then was being installed next to the valve.
————————————————
Suhanan received his doctoral in mechanical engineering from Universite Henri
Poincare Nancy I, France. He interests in heat transfer and low temperature re- frigeration and joined in thermodynamic and combustion research group. Today he
is active as a lecturer in Faculty of Engineering, Gadjah Mada University. PH-
08122700638
Fig.1 Test rig in laboratory
As stated above, manometer was installed in PVC penstock (number 3) for 4 point of observations which were made with- in 25 cm in distance respectively. The observation activity is explained by these pictures below:
Fig.2 Points of pressure change observation in test rig
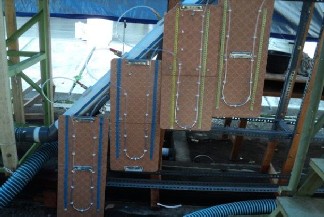
Fig.3 Manometers (with mercury) to observe the pressure change
IJSER © 2013 http://www.ijser.org
International Journal of Scientific & Engineering Research Volume 4, Issue 2, February-2013 3
ISSN 2229-5518 3
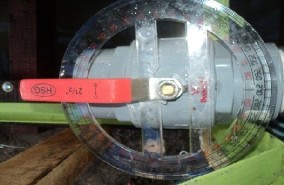
Fig.4 Ball valve with 90° shut-open
stock, length of the penstock, water velocity, water density, discharge; total head and speed of propagation that must be known from the beginning.
Water hammer problem could be a complex calculation by considering every aspects which are involved on it, such as change in flow structure from laminar to fully turbulent, and
pressure oscillations. Basically, water hammer ( P ) is greatly
influenced by speed of propagation ( a ), water velocity in pipe ( v ), water density ( ), total head (H) and cross section area of penstock ( A ). Meanwhile, the magnitude of pressure rise ( P ) depends on the valve time closure ( t ).
Before water hammer occurred, speed of wave propagation can be written as an initial form in Ghidaoi [3]:
![]()
![]()
![]()
1 d dA
a2 dP A dP
(5)
Observation by using a video camera is the simplest method
in describing the changing of pressure change (water ham-
mer). As explained before, water hammer is simulated by var-
ying the time closure of a valve gradually from 1 second until
Meanwhile, mass and momentum equation and continuity equation for 1D water hammer are:
10 seconds and the camera will be stand by during the exper-![]()
![]()
g H v 0
(6)
iment to capture manometer movement. That the character and peak of the pressure change of each time closure which
a2 t x
are clearly visible in video playback, is the advantage of this![]()
![]()
![]()
V g H w D 0
(7)
method. t
Validity of this method to described the water hammer
x A
character can be explained statistically when it is being com- pared with the theoretical results. Regression will create a
‘power trend line’ and the coefficient of correlation will indi- cate the effect of gradual valve closure in reducing the water
Since this research examines the water hammer effect for
gradual closure of the valve (t>2L/a) those two equations
above should be derived into a Joukowski formula, written as:
hammer effect. The regression and the coefficient of correla- tion can be calculated from formula from Sudjana [11] as stat- ed below:
P Lv / t
Head increase for each point is:
H P / ( g )
(8)
(9)
Y axb
log a i b i
(1)
(2)
Meanwhile, water velocity v in (7) can be calculated from an
log Y
log X
energy equivalent concept using Bernoulli equation which is
stated in Potter (2008):
n n
n( log X i log Yi ) ( log X i )( log Yi )
(3)
P v1 z
P2
v2 z
(10)
2 2
![]()
![]()
1
![]()
n( log2 X ) ( log X )2
g 2g
![]()
![]()
1 g 2g 2
i i
R2
![]()
((n)( XY ) ( X )(Y ))2
(n( X 2 ) ( X )2 )(n(Y 2 ) (Y )2 )
(4)
Where:
P1 = Pressure of point 1 (Pa) v1 = Velocity of point 1 (m/s) z1 = Elevation of point 1 (m)
In which:
Yi = Value of each point in Y axis
Xi = Value of each point in X axis
R2 = Coefficient of correlation
a , b = Constant
The experimental results must be compared by theoretical calculation to get an idea how the water hammer phenomena occurred. Moreover, in the real situation it is required to pre- dict the maximum and minimum pressure caused by water hammer. Theoretical study refers to maximum pressure change (water hammer), total pressure acquired by the pen-
P2 = Pressure of point 2 (Pa) v2 = Velocity of point 2 (m/s) z2 = Elevation of point 2 (m)
Validity of video camera method is necessary to ensure that the data of pressure change which are captured is trusted and reliable. Generally the video camera method is valid if it meets these following conditions:
IJSER © 2013 http://www.ijser.org
International Journal of Scientific & Engineering Research Volume 4, Issue 2, February-2013 4
![]()
ISSN 2229-5518
4
a. The video camera method is able to show both maximum and minimum pressure change clearly.
b. The video camera method can trace events started from the beginning valve closure towards the end of pressure change.
c. The observed values which are captured by video camera are comparable with the theoretical calculation results. For the example the maximum value.
Regarding to this research, video camera which is used can fulfill those requirements above as evidenced by graph below: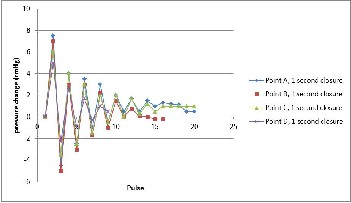
Fig.5 Maximum and minimum value and the trace of pressure change
This Fig.5 leads to an understanding that the water ham- mer characteristic in piping system can be shown by using a manometer and video camera recording method.
Fig.6 Comparison between experimental results and theoretical calculation
Both Fig.5 and Fig.6 indicate that the video camera method in this research fulfills three main requirements of validity.
TABLE 1
LIST OF EACH TREND LINE IN FIGURE 6
and bifurcation pipe
Those high coefficients of correlation once again show the affectivity of recording method with video camera and ma- nometer in describing water hammer characteristics. Record- ing method is also helpful for researcher to determine the peak value of pressure transient both in the laboratory and in the field.
All of the graphs in this section are the observation results that showed the mercury movement in manometer which is cap- tured by the camera as a sign of water hammer. These data were obtained by simulating time closure of the valve from 1 second until 10 seconds.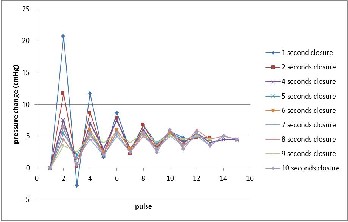
Fig.7 Water hammer characteristic for point A (free penstock condition
The rest of pressure in Fig.7 is not turning back to the ini- tial condition. This phenomenon occurred due to natural pres- sure in reservoir which is always getting larger.
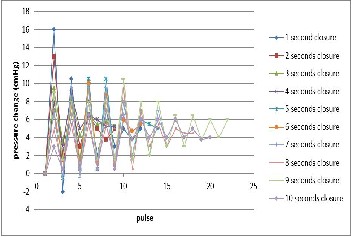
Fig.8 Water hammer characteristic for point D
In this research the period of oscillation is neglected, be- cause this research is focusing on the observation of the max- imum and minimum pressure change also the character of depletion of it. As the consequence, each X axis in every oscil- lation graph doesn’t show the oscillation period but it pro-
IJSER © 2013 http://www.ijser.org
International Journal of Scientific & Engineering Research Volume 4, Issue 2, February-2013 5
ISSN 2229-5518
5
vides number of pulse occurred while water hammer.
From Fig.7 and Fig.8, can be concluded that the maximum
pressure change becomes lower for each point of observation
as it is getting further away from the valve (ΔH point A > ΔH
point B> ΔH point C > ΔH point D).
Those graphs also provide evidence that the gradual valve closure gives a significant effect in reducing the water ham- mer. The faster time closure of the valve, the greater pressure occurred. The greatest pressure occurs at the valve closing of 1
second, 2 seconds, and 3 seconds respectively. For 10 seconds valve closure the maximum pressure is decreasing until 68.3% in point A, 75.6% in point B, 60% in point C and 60.3% in point D compared to 1 second time closure.
This experiment aims to get the water hammer effect due to turbine installation. Turbine installation directly gives a re- sistance to water which flows inside the penstock and it leads to the discharge reduction.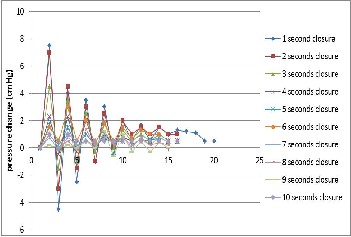
Fig.9 Water hammer characteristic in point A (when turbine is installed
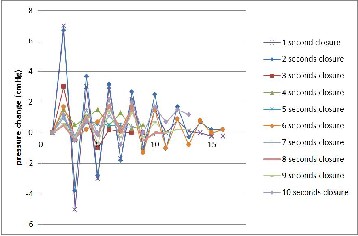
Fig.10 Water hammer characteristic for point B (when turbine is installed)
Turbine installation evidently reduces the water hammer effect in the penstock compared to free penstock condition by similar time closure. Fig.9 shows the maximum delta head pressure in point A is 7.5 cmHg. This value is much far below
the maximum value when the turbine doesn’t exist, which is
20.75 cmHg.
Meanwhile, Fig.10 indicates the maximum pressure change
in point B is 7 cmHg. This phenomenon leads towards verifi-
cation that the delta head pressure is directly influenced by
water velocity inside the pressured pipe.
Bifurcation pipe was installed between cross flow turbine and valve (see Fig.1). This branch pipe is 20% opened among its cross sectional area. This installation leads to minor hydraulic losses and velocity reduction. The results of this experiment will show the significance reducing of water hammer compared to free penstock condition. Nevertheless, it doesn’t have significant difference compared to penstock with turbine without bifurcation pipe.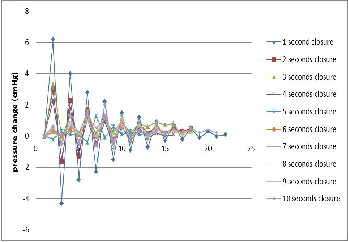
Fig.11 Water hammer characteristic for point A (with turbine and bifurca- tion pipe installation)
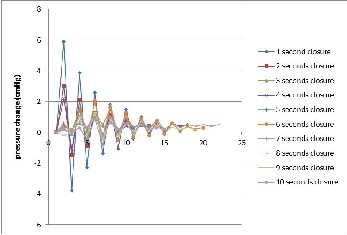
Fig.12 Water hammer characteristic for point B (with turbine and bifurca- tion pipe installation)
It can be ensured that the pressure in this section (with tur- bine and bifurcation pipe) is much lower than the pressure value without turbine (free pipe). Fig.11 indicates the highest pressure change in point A is 6.2 cmHg. This is slightly adrift
IJSER © 2013 http://www.ijser.org
International Journal of Scientific & Engineering Research Volume 4, Issue 2, February-2013 6
ISSN 2229-5518
6
below the value with turbine installation without bifurcation pipe, which is 7.5 cmHg. Here, bifurcation pipe installation makes only 17.33% in water hammer reduction.
Fig.12 shows the highest one in point B is 5.9 cmHg. It is similar to the previous results; it creates a small difference from value with turbine installation without bifurcation pipe (7 cmHg). Now, bifurcation pipe installation acquires only 2% in water hammer reduction. In this case, the small percentage predicted might caused by a small opening of bifurcation pipe, which is 20% from its cross sectional area.
According to (7) and (8), theoretical results can be compared with the experimental one by knowing pipe and hydraulics specification. For the experimental results, the peak values for each time closure must be determined first before they are being compared with experimental. It is easier for time closure
1 second until 3 seconds, because the values of pressure rise are directly visible after the valve is closed. Another case for 4 seconds until 10 seconds, the value of pressure is more influ- enced by the ‘human error’ in closing the valve.
This section purposed to get an idea about the comparison
plained yet.
TABLE 2
LIST OF EACH TREND LINE IN FIGURE 13
between theoretical water hammer and experimental results. Other words, how the experiment results are considered from the theory’s perspective. Another reason is to describe the reli- ability of water hammer observation by using a video camera method with gradually closure of the valve.
3.5.1 In Free Pipe Condition
By using (8) and (9), the highest pressure change for each time closure is possible to be calculated correctly. This condition provides discharge 31.45 l/s and velocity is 6.9 m/s. The com- parison between theoretical and experimental is stated below: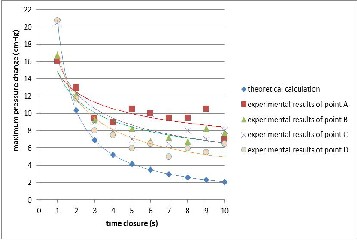
Fig.13 Comparison of theoretical and experimental results for water ham- mer peak values in free pipe condition
Fluctuation of pressure change was occurred in all of point of observations. Fig.13 indicates that increasing in distance between the points (25 cm) provides a clear influence to the declining of pressure change due to water hammer. Neverthe- less, the values of pressure change are relatively higher than the theoretical one. This because of a high velocity of water flows in the penstock. This phenomenon cannot be clearly ex-
Compared with the theoretical calculation, the experi-
mental results made large disparities especially from 4 se-
conds until 10 seconds. The largest disparity in average was
made by point A on 9 seconds closure with 8.19 cmHg. Point
A’s trend line stays in the highest position, followed randomly
by point B, C and the last one D. Overall, the coefficient of
correlation value stays high which is directly signed that the
gradual closure of the valve reduces water hammer clearly.
3.5.2 With Crossflow Turbine Installation
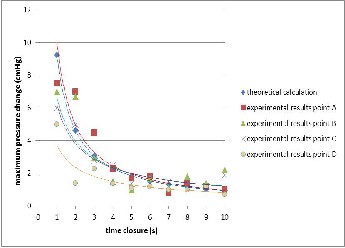
Fig.14 Comparison of theoretical and experimental results for water ham- mer peak values with crossflow turbine installation
Moreover, Fig.14 shows that valve closure delay provides a significant effect to reduce pressure change due to water hammer, for each point of observation. Fig.14 indicates in point A, the pressure values are spread normally, without any significant disparities. The theoretical results (blue line) have a regression in power trend line with R² value of 1. Trend line of experimental result for point A is drawn by y=10.051 x (^-
IJSER © 2013 http://www.ijser.org
International Journal of Scientific & Engineering Research Volume 4, Issue 2, February-2013 7
ISSN 2229-5518
1.017). It is supported by the highest value of R², which is
0.8812. This correlation value is high; it means that the obser-
vation results in this point have proved that valve closure de-
lay gives a significant influence in reducing the water hammer
effect.
Point B shows a fluctuating pressure value, especially in 2 seconds and 10 seconds time closure. In 2 seconds the pressure is too high from theoretical result, which pressure change is
6.7 cmHg from its initial. It is getting lower dramatically in 5 seconds closure, which is 1 cmHg. Another is slightly shifted from a trend line. Even the value of R² in point B (0.6387) is the lowest among the others, but it is still large enough to show the significant decreasing trend line.
TABLE 3
LIST OF EACH TREND LINE IN FIGURE 14
Nu | Result trend line | Regression | Coefficient of correlation (R²) |
1 | Theoretical Results | y = 9.2462x-1 | 1 |
2 | Experimental Results point A | y = 10.051x- 1.017 | 0.8812 |
3 | Experimental Results point B | y = 6.6751x- 0.748 | 0.6387 |
4 | Experimental Results point C | y = 6.2332x- 0.709 | 0.8404 |
5 | Experimental Results point D | y = 3.7336x- 0.659 | 0.7847 |
By using (1) the regression of trend line is easily deter- mined. Meanwhile, (4) is very helpful to find the coefficient of correlation as shown in Table 2.
Overall, experimental results presentation for each point of observation seems spread evenly. Point A as the nearest spot to the valve provides the closest trend line to the theoretical. It is followed by the next point which is sequentially getting fur- ther to theoretical trend line. Statistically, the coefficient of correlation for each trend line of point of observation is high. It confirms the fact that the highest pressure will be acquired by the closest point to the valve. In other words, the delaying in the valve closure provides a significant effect in reducing pressure change. It also affirms that water hammer observa- tion with gradually valve closure by using video camera is one of a feasible method that could be directly implemented in the field.
3.5.3 With Crossflow Turbine Installation and Bifurcation
Pipe (20% opening)
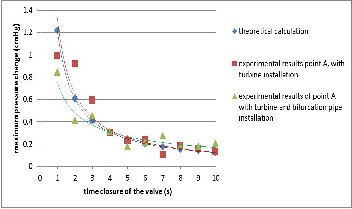
Another condition, when the bifurcation pipe is being in- stalled together with the turbine discharge is becoming 11 l/s and velocity is 2.4 m/s. Similar to the previous calculations, theoretically pressure change (peak values) for each time clo- sure can be determined by using equation (7) and equation (8).
Clearly in this case, water hammer effect is reduced due to decline of water velocity. The comparison between theoretical and experimental results is stated below.
Fig.15 indicates a better data distribution for each point of observation. Point A, gives the highest value pressure change in biggest portion, almost in every time closure of the valve.
The lowest correlation is found in experimental results point B. The R² value is 0.7521. This means that the contribu- tion of time valve closure delays to the decreasing of water hammer effect is only 75.21%, the rest depends on another factor. However, since R² extends from 0 to 1, the correlation of these two variables is still large. From the previous observa- tion results including “with crossflow turbine installed” condi- tion, the coefficient of correlation (R²) has showed a satisfying high value. Practically, the delaying of time valve closure is significantly reducing the pressure change and the results can be drawn graphically in power trend line.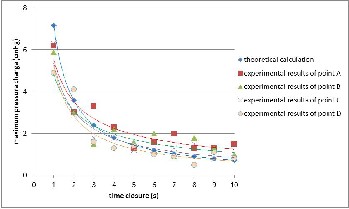
Fig.15 Comparison of theoretical and experimental results for water ham- mer peak values when cross flow turbine and bifurcation pipe are being installed
TABLE 4
LIST OF EACH TREND LINE IN FIGURE 15
Nu | Result trend line | Regression | Coefficient of correlation (R²) |
1 | Theoretical Results | y = 7.1736x-1 | 1 |
2 | Experimental Re- sults point A | y = 5.533x-0.649 | 0.852 |
3 | Experimental Re- sults point B | y = 4.8367x-0.648 | 0.7521 |
4 | Experimental Re- sults point C | y = 5.3595x-0.803 | 0.907 |
5 | Experimental Re- sults point D | y = 5.2421x-0.889 | 0.852 |
When they are being compared with the theoretical, the experimental results spread surrounding. Point A’s trend line stays in the highest position, followed uniformly by point B, C and D.
IJSER © 2013 http://www.ijser.org
International Journal of Scientific & Engineering Research Volume 4, Issue 2, February-2013 8
ISSN 2229-5518
1. This research has confirmed that the method using video 8 camera can be implemented to observe the water hammer
effect (pressure change) in the laboratory scale satisfacto- ry.
2. Pressure change due to water hammer can be reduced by lengthening valve closure time (gradual closure of the valve), and the reduction can be explained clearly through power trend line controlled by coefficient of correlation and also match to the theoretical calculation results.
3. Pressure change due to water hammer was decreased sig- nificantly by installing the bifurcation pipe before turbine. So, this method can be implemented in order to minimize the dangerous of water hammer effect on micro hydro- power plant.
This research might be continued; to describe the cause of large disparities between experimental results and theoretical calculation in determining pressure change especially in free penstock condition, to observe the period of oscillation using video camera method and also to find out the appropriate so- lution to reduce water hammer effect using energy valve.
[1] S. Batterton, Water Hammer: An Analysis of Plumbing Systems,Intrusion, and Pump Operation, Virginia: Virginia Polytechnic Institute and State University, 2006
[2] A. Bergant, Tijesseling, Vitkovsky, Covas, Simpson and Lambert, "Further Investigation of Parameters Affecting Water Hammer Wave Attenuation, Shape and Timing Part 1: Mathematical Tools".
[3] Ghidaoui, Zhao, Mclnnis and Axwhorty, "A Review of Water
Hammer Theory and Practice," Applied Mechanics Reviews, pp. 49-76,
2005
[4] J. S. Gudmundsson and B. Pierre, "Coincidental match of numerical simulation and physics," in IOP Conf. Series: Earth and Environmental Science 12 (2010) 012062, 2010
[5] K. A. Hariri, "Numerical Modeling for Transient Flow; Some Engineering Aspects and Economical Hints," Journal of Economics and Engineering, ISSN: 2078-0346, №3, August, 2010, pp. 18-24, 2010
[6] Z. M. Lahlou, "Water Hammer," National Drinking Water
Clearinghouse, Virginia, 2003.
[7] Mondal, Pressure Transients in Wellbores: Water Hammer Effects and Implications for Fracture Diagnostics, Texas: University of Texas in Austin, 2010
[8] Potter and Wiggert, Fluid Mechanics Schaum’s Outline Series, New
York: McGRAW-HILL Companies, 2008
[9] K. M. Sahib and A. Hussam, "The Effect of Water Hammer upon
Pipes at Suddenly Closed Valve," Journal of Thi-Qar University, pp. 29-
39, 2010
[10] Sarma, D. S. Mimi and A. Kumar, "Simulation of Water Hammer Flows With Unsteady Friction Factor," ARPN Journal of Engineering and Applied Sciences, pp. 35-40, 2006
[11] Sudjana, Metoda Statistika, Bandung: Tarsito, 2002
IJSER © 2013 http://www.ijser.org