Thus, Nuclear Medicine can be divided into three main categories: in vivo, in vitro and Therapy. The
deviation of a region of interest. The moment equation is expressed as in equation 1.
International Journal of Scientific & Engineering Research, Volume 4, Issue 9, September-2013 2026
ISSN 2229-5518
1Medical Radiation Physics Centre
Radiological & Medical Sciences Research Institute
Ghana Atomic Energy Commission
P. O. Box LG 80
Legon - Accra
Ghana Fax: (+233 302) 400807
Office: (+233 289) 542201
Contacts: +233 (208) 152864, +233 (243) 388063, +233 (264) 945805, +233 (244) 754733
2Graduate school of Nuclear and Allied Sciences
University of Ghana, legon, Ghana
P. O. Box LG 80
Legon - Accra
Ghana.
Contact+233 (208) 147517
3National centre for Radiotherapy and Nuclear Medicine
Department of Nuclear Medicine
Korle-Bu Teaching Hospital, Accra Ghana. Contact: +233 (302) 676222
ABSTRACT
The aim is to evaluate the effect of acquisition parameters (matrix size, count density and object collimator distance)
on the quality of SPECT images using the Statistical Moment Method. Images were acquired by placing the quadrant-bar phantom on flood field uniformity Phantom filled with a 99m-Tc solution using Low Energy High Resolution (LEHR). The method involved keeping two parameter constant while varying the other one parameters. The experimental results demonstrate that as the matrix size increases from 64x64 to 1024 x 1024 the image quality improved 26.4% in image resolution and the acquisition time increase by 18.63%, hence more image details is observed. Also, image quality is degraded as the distance between the object and the collimator increased. At 80mm object-collimator distance the image quality is worsen by 30.5% from the default setting of 40mm and improves by
46.4% from the default setting when the detector is in contact with the object, however the acquisition time increase by 9.63%. Furthermore, even though count density has a minimal influence on image quality just about 3.39%, the acquisition time increase substantial to about 166.2%. Matrix size of 512x512 produce the best image resolution, taken into account the acquisition time and stability factors in producing an image, hence should be adopted for used and the detector should be as close to the object as possible. However, the count density should be 20 Mcts since the result produced exactly the same image resolution with higher count densities but with shorter acquisition time.
.
KEYWORDS: LEHR, acquisition time, quadrant bar phantom, flood field phantom, matrix size, count density object-collimator distance.
Nuclear medicine imaging is a major diagnostic tool in medicine. In the past, physiological detail was limited in order imaging studies; however imaging in nuclear medicine in recent past has helped to resolve this problem by displaying physiological function of organs. For instance, the excretory function of the
kidneys, iodine concentrating ability of the thyroid and blood flow to heart muscle can be measured using nuclear medicine imaging processes [1].
Nuclear medicine may also be referred to as
molecular medicine or molecular imaging and therapeutics. This is because it enables understanding of biological processes in the cells of living organism which allow visualization, characterization, and quantification of biologic processes at the cellular and subcellular levels. Its reputation is mainly
IJSER © 2013 http://www.ijser.org
International Journal of Scientific & Engineering Research, Volume 4, Issue 9, September-2013 2027
ISSN 2229-5518
because of the non–invasive nature of its investigation [2].
Thus, Nuclear Medicine can be divided into three main categories: in vivo, in vitro and Therapy. The
deviation of a region of interest. The moment equation is expressed as in equation 1.![]()
𝐹𝑊𝐻𝑀 =
4 (𝜇𝑅𝑂𝐼)
main aim of In vivo procedures is to accurately![]()
1.058 𝑋 𝐵𝑎𝑟 𝑤𝑖𝑑𝑡ℎ 𝑋�𝐼𝑛[𝜋 { }]
2 (𝑓 )−𝜇
(𝑓 )�
measure the distribution of radioactivity within the
human body which has specifically localised in an organ of interest and the production of images exhibiting the best diagnostic quality with the least
….. (1)
�2�𝜎𝑅𝑂𝐼 𝑏
𝑅𝑂𝐼 𝑏
possible patient radiation exposure. The aim of in vitro is to study components of an organism that has been isolated from its usual biological context in order to permit a more detailed or more convenient analysis than can be done with whole organisms using radiation while, the main aim for therapy is for treatment with radiation [1].
In Ghana, Nuclear medicine is mainly used for diagnostic purposes using an in vivo procedure. This is done with other imaging modalities in the department of radiology in other to completely diagnose the extent of a disease-process in the body, mostly in oncology cases. However, it is also use for thyroid therapy in limited cases.
Single Photon Computed Tomography SPECT is used for patients study at Nuclear Medicine Department, hence the need for the study of its input parameters to assess and compare with international standards.
This study was based on the theory of statistical moment equation which is based on the first and second statistical moment of region of interest as applied to bar phantom images. This leads to the estimate of the modulation transfer function (MTF) and the full width at half maximum (FWHM) of line spread function (LSF). Hence, the relationship between FWHM, bar width, mean and the standard deviation is established after a series of integration.
This method is accepted as the best method for measuring the resolution of SPECT systems. The theory has been applied successfully by the medical physics unit of the Department of Radiology, University of Texas [2]. It is also accepted by International Atomic Energy Agency (IAEA) and American Association of Physicist in Medicine (AAPM) as the best method for measuring resolution of SPECT systems [3].
Statistical Moment Equation is used to calculated FWHM values with known values of the bar width of least resolved bars, the mean and the standard
The image quality was assessed using the calculated
FWHM values to estimate the resolution. The acquired data were evaluated and interpreted based on the effect of the three acquisition parameters on the FWHM values in relation to the Acquisition time, which is the time require to acquire an image.
Matrix size is deals with the division of field of view into square areas (pixel), and expressed mathematically as;![]()
𝒎𝒂𝒕𝒓𝒊𝒙 𝒔𝒊𝒛𝒆 = 𝑭𝑶𝑽 ……………………. (2)
𝑷𝑰𝑿𝑬𝑳 𝑺𝑰𝒁𝑬
Selection of the matrix size for the projection views
forms an important aspect of SPECT imaging.
During imaging, the computer divides up the gamma camera field of view (FOV) into square areas (pixels). The total number of pixels for a particular FOV forms the matrix size for that FOV. Essentially,
64x64, 128x128, 256x256, 512x512 and 1024x1024 matrix sizes are available for selection with Siemens SPECT machine at Korle-Bu Teaching Hospital in Accra, from which 256x256 matrix size is the default setting on the computer system.
Count density or photon density is the number of counted events recorded in scientigraphic per square centimeter or per square inch of imaged area.
IJSER © 2013 http://www.ijser.org
International Journal of Scientific & Engineering Research, Volume 4, Issue 9, September-2013 2028
ISSN 2229-5518
An acquisition time that allows adequate image statistics is mandatory for the production of diagnostic images. This is in large part determined by count rate, matrix size, and number of projections per orbit. Obviously, the longer the acquisition, the more counts collected and the better the image resolution. However, typical patient tolerances for acquisition times make 30 to 45 minutes a realistic maximum. Thus times per projection (stop) must be predicted on an appraisal of the patient’s ability to remain still. Any significant motion of the patient during acquisition may render the results unusable.
Object-collimator distance is the distance between the object and the detector surface. The resolution of the gamma camera degrades as the distance between the camera and object being imaged increases [5]. Also, a certain fraction of gamma rays from an object is attenuated (absorbed) when they are emitted in an attenuating medium, such as a patient. This phenomenon varies according to the depth of attenuating medium between the object and the collimator of the gamma camera. In clinical SPECT, opposing projection views will never be the same, hence, 360° of arc is required for accurate reconstruction in most SPECT studies [6]. This allows anterior and posterior view of the imaged organ.
The materials used include; Flood-field uniformity phantom, Quadrant bar phantom, SPECT System, Radioactive source (Tc-99m), Mo/Tc Generator and LEAP Collimators.
The flood field uniformity phantom at Korle-Bu Nuclear Medicine Center is a rectangular perspex container with internal dimensions of 180 mm x 300 mm, the total volume of the empty container is approximately ten liters’ and with filled weight of approximately 13.0 kg. This phantom is designed to provide the periodic performance testing for the SPECT systems. It offers a single system for measuring resolution and uniformity.
The container has three removable metal screws which are fixed at the two opposing corners on the top surface of the container and made water tight with rubber rings. This arrangement made it easy to fill in water. During usage the three removable
using syringe and an attached needle. In the case of this study the phantom was filled with 25mCi of Tc-
99m water solution. This together with Quadrant bar phantom was combined for imaging.
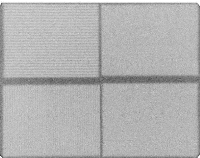
The quadrant bar phantom consists of four quadrants, A, B, C, D with lead strips of different thicknesses but the same length embedded in Perspex glass. At the Nuclear Medical center of the Korle-Bu Teaching Hospital, the Quadrant bar phantom has lead strips of thickness 2.0mm (A), 2.5mm (B),
3.0mm (C) and 3.5mm (D). These represent the distance between two lead strips. It is used for quantitative measurements of resolution.
The combination of the two phantoms allowed photons from the flood-field water to pass through the spacing between the lead strips in the quadrant- bar phantom and detected by the camera. The combined phantom (quadrant bar phantom on flood field uniformity phantom) was positioned on the SPECT gamma camera patient bed, by ensuring that the flat axis of the phantom was positioned parallel to the axis of the gamma camera detector, within the field of view (FOV) of the detector[7]. Before placing the combined phantom on the patient bed quality control (intrinsic) was done after which the LEAP collimator was first mounted and homed to position the camera system ready for imaging. The acquisition protocol on the computer system software was selected and the process of imaging carried out. After the acquisition was done, circular ROIs was drawn on the smallest set of bars that was least
resolved and the average counts per pixel (𝜇𝑅𝑂𝐼 ) in
the ROI for the chosen bar width and variance of the
count ( 𝜎 2 ) in each pixel in each case read from the
e-soft display which have been generated by the
system[8]. By using the moment equation, the
FWHM values were calculated. RESULTS AND DISCUSSIONS MATRIX SIZE
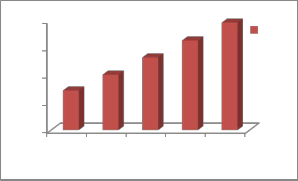
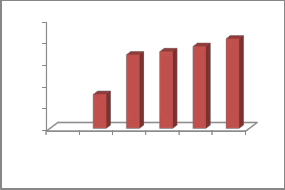
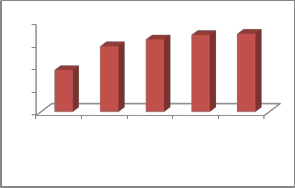
Table 1 shows data collected with constant count density and object-collimator distance at 20 Mcts and
20mm respectively while varying the matrix size from 64x64 to 1024x1024 using Low Energy All Purpose (LEAP) collimator. While Figure 1 and 2 represent variation of matrix size with FWHM and acquisition time respectively.
![]()
screws are removed and filled slowly with water
IJSER © 2013 http://www.ijser.org
International Journal of Scientific & Engineering Research, Volume 4, Issue 9, September-2013 2029
ISSN 2229-5518
8
6
4
2
0
Matrix Size (pixels)
FWHM (LEHR)
FWHM (LEHR)
8
6
4
2
0
Matrix Size (pixels)
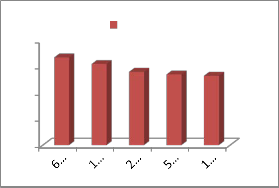
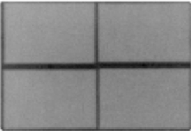
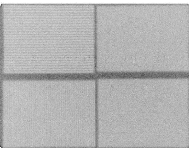
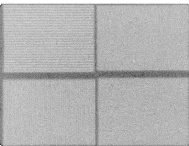
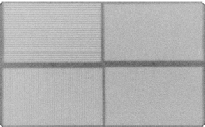
Figure 3.1 to 3.5 shows the gradual improvement of image quality as the matrix size varied from 64x64 to
1024x1024 pixels at a constant object collimator distance and count density of 20mm and 20Mcts respectively.
IJSER © 2013 http://www.ijser.org
International Journal of Scientific & Engineering Research, Volume 4, Issue 9, September-2013 2030
ISSN 2229-5518
5.9
5.8
5.7
LEHR
5.6
15 Co2u0nts De2n5sity (M3c0ts) 35
Table 2 shows data collected by keeping the matrix size and
object-collimator distance constant at 256x256 pixels and
20mm respectively while varying the count density from 15
Mcts to 35 Mcts using the LEAP Collimator. Also, figure 4 and 5 represent variation of Count Density with FHWM and acquisition time
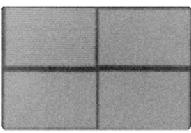
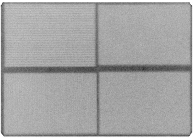
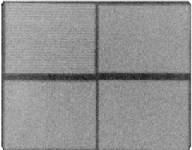
Figure 6.1 to 6.5 shows the gradual improvement of image quality as the count density varied from
15Mcts to 35Mcts at a constant matrix size and object collimator distance of 256X256 and 20mm respectively. Here, the lead strips show slight improvement in appearance from 15Mcts to 35Mcts.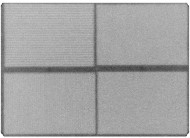
20 LEHR LEHR
15
10
5
0
15 20 25 30 35
Counts Density
IJSER © 2013 http://www.ijser.org
International Journal of Scientific & Engineering Research, Volume 4, Issue 9, September-2013 2031
ISSN 2229-5518
15
14.5
14
13.5
13
12.5
O/C (0)
O/C (2)
O/C (4)
O/C (6)
O/C (8)
Object-Collimator Distance
8
6
4
2
0
O/C (0) O/C (2)
O/C (4)
O/C (6)
O/C (8)
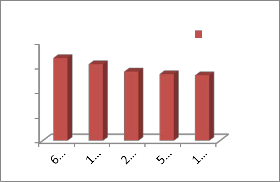
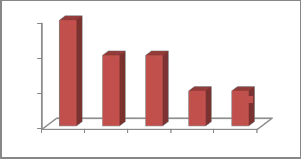
Table 3 shows data collected by keeping the count
density and matrix size constant at 20 Mcts and
256x256 pixels while varying the Object-collimator
distance from 0 mm to 80 mm using LEAP collimator. Figure 7 and 8 represent the variation of Object-Collimator and FWHM and acquisition
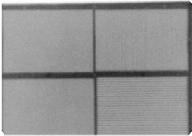
Object-Collimator Distance (mm)
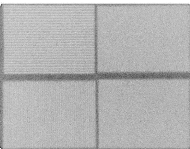
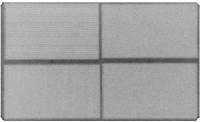
Figure 9.1 to 9.5 shows the gradual improvement of image quality as the object collimator distance varied from 80mm to 0mm at a constant matrix size and count density of 256x256 and 20Mcts.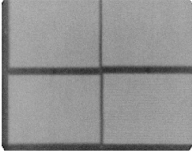
IJSER © 2013 http://www.ijser.org
International Journal of Scientific & Engineering Research, Volume 4, Issue 9, September-2013 2032
ISSN 2229-5518
The variation of matrix size from 64x64 to
1024x1024 with constant count density and object-
collimator distance using Low energy High Resolution Collimator (LEHR) shows a gradual reduction in the value of FWHM which indicates
26.4% improvement in resolution. Between the default matrix of 256x256 and the matrix size of
512x512 the FWHM Value decrease from 5.6mm to
5.5mm, which shows 1.78% improvement in resolution. The improvement in resolution is indicative of an improvement in the image quality as resolution indicates how best the camera system can distinguish or resolved between two closely placed sources. Therefore, higher matrix size with smaller FWHM value has better resolution than lower matrix size with larger FWHM for all other conditions being constant.
However, higher matrix sizes resulted in an increase in the acquisition time. For instance, in figure 1 the acquisition time increases from 9.5minutes to
11.27minutes from an increase in matrix size of
64x64 to 1024x1024, this is an increase of 18.71% processing time. Also, when the matrix size was varied from the default setting(256x256) to 512x512 matrix size the processing time increases by 9.5%. The result for the increase in matrix size from
256x256 to 512x512 is significant and can be
adopted for use. Also, it is still within typical patient tolerances of acquisition times for approximately 30 to 45 minutes a realistic maximum for imaging [7]. Thus times per projection (stop) must be predicted on an appraisal of the patient’s ability to remain still. Any significant motion of the patient during image acquisition may introduce artifacts into the image.
When the count density was varied from 15Mcts to
35Mcts with constant acquisition matrix size and
object-collimator distance at 256x256 and 20mm respectively using LEHR, there was consistent little reduction in the value of FWHM, which is just about
3.39% improvement in resolution.
In other words, the effect of the change in the count density shows a little change in the value of the FWHM as shown in figure 3, hence little change in the image quality. However there is a significantly increase in acquisition time from 8.42 to
22.43minutes in figure 4 which saw over 166.19%
increase in acquisition time. This increase in acquisition time is significant as this will affect the quality of the image. In other words the design of the collimator determined the number of photons that were received by the detector and also the energy and the availability of the radionuclide in a specified volume determine the count density. The flood-field uniformity or the response to uniform irradiation describes the degree of uniformity of count density in
IJSER © 2013 http://www.ijser.org
International Journal of Scientific & Engineering Research, Volume 4, Issue 9, September-2013 2033
ISSN 2229-5518
the image when the detector is “flooded” with a spatially uniform flux of incident gamma radiation.
The object-collimator distances increases with decrease in resolution. In table 3 when the object- collimator distance was varied from 0mm to 80mm with respect to the bed height of 135mm at a constant matrix size and count density using LEHR, there was an increase in the FWHM values from 3.7 to 6.9mm as shown in figure 5. This shows poorer resolution as the object-collimator distance increases. In other words as the detector moves away from the object the ability of the detector to distinguish between two adjacent points (resolution) reduces. This means that the further an object from the detector the poorer the image that will be captured. Theoretically, resolution of the gamma camera degrades as the distance between the camera and object being imaged increases [8]. This is because certain fraction of gamma rays from an object is absorbed when they are emitted in an attenuating medium, such as a phantom or a patient. This phenomenon varies according to the depth of attenuating medium between the object and the gamma camera.
The closer the detector to the object the better the resolution and the farther the detector from the object the poorer the resolution [8]. In other words the smaller the object-collimator distance the better the detector detects the source of photons in the radioactive object and finer details of two adjacent objects can be recorded.
The study revealed that as the object-collimator distance increased from 0mm to 80mm FWHM values increased from 3.7mm to 6.9mm as shown in Table 3 and figure 5, which is 86.49% reduction in resolution, resulting in an increase in acquisition time from 13.29 mins to 14.57 mins as in Table 3 and figure 6, an increase of 9.6% processing time.
It is proposed that all things being equal, to achieve
better resolution in gamma camera imaging, 512x512 matrix size should be used, object-collimator distance should be 20mm and count density should be 15-20
Mcts.
My sincere gratitude to the medical physics unit of the Department of Radiology, University of Texas,
USA for the use of their research material on the statistical moment method published.
My sincere thanks also go to staff of the Department of Nuclear Medicine, Korle-Bu Teaching Hospital for their support and cooperation.
[1] Paras, P.
“Performance and Quality Control of Nuclear Medicine Instrument”, in Medical Radionuclide Imaging. Proceedings of a symposium organized by IAEA in Co-operation with WHO, Heidelberg, 1980, IAEA, Vienna (1981). Vol. II.
[2] Trish A. Hander, Jack L. Lancaster, David T. Kopp, John C. Lasher, Ralph Blumhardt, and Peter T. Fox. Department of Radiology, University of Texas. Rapid objective measurement of gamma camera resolution using statistical moments.
Volume 24, Issue 2, February 1997
[3] Paras, P.
Quality Assurance in Nuclear Medicine in Medical Radionuclide Imaging. Proceedings of IAEA symposium. Los Angeles, 1976, IAEA, Vienna, Austria,
Pages 130- 143.
[4] P. P Dendy et al
An experimental study of the relationship between image quality and spatial resolution for the gamma camera.
pages: 150-155.
[5] P. S Soni et al
Quality Control of Imaging Devices in Handbook of Nuclear Medicine Practice in Developing Countries. IAEA – Vienna, 1991.
Page 95.
[6] Gray J.E., Winker N.T., Stears J., and Frank
E.D.
Quality Control in Diagnostic Imaging: A Quality
Control Handbook. University Park Press. Baltimore Maryland, (1983).
pages 16 – 32.
[7] International Atomic Energy Agency,
Quality Control of Nuclear Medicine Instruments,
IAEA-TECDOC-602, Vienna (1991). Pages; 15-19
IJSER © 2013 http://www.ijser.org
International Journal of Scientific & Engineering Research, Volume 4, Issue 9, September-2013
ISSN 2229-5518
2034
[8] NEMA.
Performance measurements of scintillation cameras. Washington DC.
Natimal Electrical Manufacturers Association
(NEMA), 1994, Standards Publication NU 1-1994. Pages 5-92