only working material that is self-generating.
Wood preservation can play an important role in bio-conservation and protection of environment. The main enemies of wood which damage it are fungus, termites, beetles, carpenter ants and marine borers.

International Journal of Scientific & Engineering Research, Volume 4, Issue 8, August-2013
ISSN 2229-5518
992
Md.Amzad Hossain, Prof.Dr.A.N.M.Mizanur Rahman, Md.Mahmudul Hasan, Srabani Karmakar, Md.Asad- uz-zaman
Abstract-Wood is a very valuable thing in this world. Wood is used in various purposes say for making house utilities, as a fuel. Most of the People around the world don’t have proper knowledge about wood preservation. Since the total amount of wood is reduced day by day hence it is the time to maintain environment al equilibrium by proper utilization of consumption of wood. First time ever in Bangladesh, the variation of wood properties was observed by applying most two effective methods namely pressure and non -pressure processes .the properties like as Moisture content (%), weight reduction (%), penetration depth, retention, nature of preservative coating was observed carefully. By applying full cell pressure process and various non- pressures process (Brushing, Deeping, and Steeping), it was observed that the treated wood life is increased by 5 to 10 times and it is clear from this project that the durability of wood under pressure process is much more greater than that of the durability of wood founded by non- pressure process. It is very effective method of wood preservation which protects the wood from various insects, termites, torrents etc. Hence in order to stable the Bio conservation and maintain the environmental equilibrium such types of wood preservation techniques will control and reduce the consumption of excessive wood and hence makes the environment more fresh and powerful.
Index Terms-wood preservation technology, enhancement of wood properties by new technology, preservation cost minimization
———————————————————
1 INTRODUCTION
OOD is one of the earth's most valuable and abundant renewable natural resources. It is a gift of nature and is the
only working material that is self-generating.
Wood preservation can play an important role in bio-conservation and protection of environment. The main enemies of wood which damage it are fungus, termites, beetles, carpenter ants and marine borers.
•Md. Amzad Hossain is a Lecturer and currently pursuing master’s degree in Department of Mechanical Engineering at Khulna University of Engineering & Technology, Bangladesh. E- mail: amzad59@mail.com
• Prof.Dr.A.N.M.Mizanur Rahman is a Professor, Department of Mechanical Engineering at Khulna University of Engineering & Technology, Bangladesh. E-mail: drmizan@me.kuet.ac.bd
• Md. Mahmudul Hasan is a student of Department of
Mechanical Engineering at Khulna University of Engineering & Technology, Bangladesh. E-mail: parvej.me@gmail.com
• Srabani Karmakar is a Masters student of Department of Mechanical Engineering at Khulna University of Engineering & Technology, Bangladesh. E-mail: sshraboni@rocketmail.com
•Md. Assad-Uz-Zaman is a student of Department of Mechanical
Engineering at Khulna University of Engineering & Technology, Bangladesh. E-mail: assad_kuet08@yahoo.com
Besides this temperature, rain and the ultra violet ray can damage the timber. The amount of damage by the second is negligible in comparison to the first enemy. By proper preservation method, it is possible to protect the wood from these enemies. Preservation is the way and the only appropriate way to make the timber toxic and protect it [1]. With suitable chemical treatment, the life of timber can be increased to 5-10 times its normal life and its fire resistive property to 2-3 times the normal. The preservative treatment depends on the wood species, moisture content and its anatomical structure. . The widely used preservation method in Bangladesh is Full-cell pressure process. Beside this, soaking or dipping method are used for different wood species because it is very simple method and anyone can treat wood by this method. Wood, bamboo and sun grass were treated with Chromated-Copper-Arsenate (CCA) but after some laboratory trials at Forest Research Institute (FRI), Chromated-Copper-Arsenate (CCA) is being replaced by Chromated-Copper Boric acid (CCB) due to low cost and availability in
IJSER © 2013 http://www.ijser.org
International Journal of Scientific & Engineering Research, Volume 4, Issue 8, August-2013
ISSN 2229-5518
993
the market [4.] Chromated-Copper-Boric acid
(CCB) is not only low cost material but also environmental friendly. A pilot system for wood
• A-Highly treatable, penetration range more than
4 cm
• B-Treatable, penetration range 2-4 cm
preservation was developed at
KUET where
• C-Moderately treatable, penetration range 1-2 cm
domestic aspect was in consideration. There is no
• D-Very hard to treat, penetration below 1 cm
doubt that huge amount of wood
is still in use
commercially without precise knowledge of wood preservation. So, there is a huge loss of timber which reduces the limited resources of wood. To
A process of preservative treatment of wood is that, which uses a pressure vessel and first draws a
find out the best way of saving wood and also find
vacuum on the charge of
wood and thee
out the cost effective way it is necessary to treat
introduces the preservative without breaking the
wood commercially. So treating wood
vacuum. This process is also
known as Bethell
commercially is the main concern of this project.
process. The sequence of procedures used in the
2MATERIALS AND METHODOLOGY
full cell process is shown in
summarized below:
Figure 3.1, and is
In the study, it appeared that mango was highly treatable. Maximum penetration occurred along the grain while the least in the tangential-radial directions in all the species studied. This is in
a)Dried wood were enclosed in a pressure cylinder or retort.
agreement with the literature that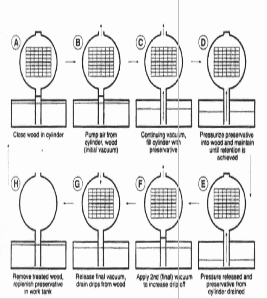
longitudinal
permeability of preservatives is usually several
thousand times greater than
transverse
permeability Wood structure pore size, pit aspiration and moisture content influence permeability. Out of that only moisture content was controlled.
Comparative studies of various illustrated below.
species are
Table 3.1:
Comparative study of life, durability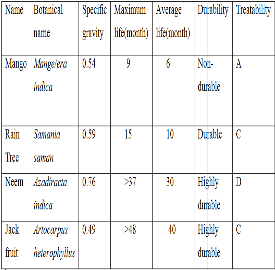
and treatability of various species.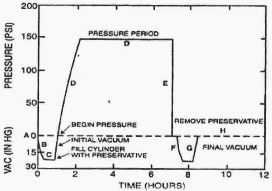
Fig. 3.1: Treating sequences and pressure change in the full cell process.
IJSER © 2013 http://www.ijser.org
International Journal of Scientific & Engineering Research, Volume 4, Issue 8, August-2013
ISSN 2229-5518
994
b) A vacuum pump to remove most of the air from
the cylinder was used. A partial vacuum of about
550 mmHg was hold to allow air to be removed from the wood.
c) Without releasing the vacuum, the cylinder was allowed to fill with preservative.
d) A pressure 7 bar was applied to the preservative by an air compressor to force into the wood cell previously occupied by air, now occupied by a partial vacuum.
e) When the desired and measured amount of liquid preservative has been absorbed; applied pressure was released and drained the cylinder.
f) A "final" vacuum 550 mmHg was applied to
expand the air remaining in the wood. This forced excess liquid to exude from the surfaces and run off.
g) Final vacuum was released. As the remaining air in the cells contacts, much of the surface wetness was reabsorbed into the wood. At last the treated wood products were released from the Cylinder.
penetration and retention. The penetration of
preservatives into the timber can easily be determined on site by using color reagents.
Exactly 10 gm turmeric with 90 gm ethyl alcohol was taken and was filtered to obtain clear solution.
Dilute 20 ml of concentrated hydrochloric acid was diluted to 100 ml with ethyl alcohol and then it was saturated with salicylic acid. Generally 13 gm salicylic acid is required per 100 ml solution.
The sample for penetration assay was dried prior to make the final cut to expose the surface for spraying. A smooth surface shows the results of the spot test better than a rough surface. The surface must be dried otherwise the test will not be satisfactory. Solution I was applied, preferably by spraying, or with a dropper, on the surface to be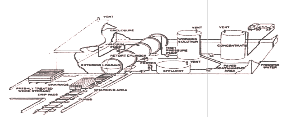
treated. The surface being
treated was then
Fig 3.2: Conceptual view of CCB Pressure Treating
Plant.
It gives the deepest possible penetration and the highest loadings (retentions) of preservative with easily-treated species. Virtually all of the air in the
allowed a few minutes to dry. Solution 2 was then applied in a similar manner to the areas that had been coloured yellow by the application of solution l. The color changes were observed carefully and had shown up a few minutes after application of the second solution. In the presence of boron, the yellow color of the turmeric solution was found
wood cells can be replaced with
preservative.
turned red.
Sometimes this may produce a higher loading than
necessary. The degree to which penetration and retention of preservative occurs depends on the permeability of the wood. For effective treatment, some species may need special preparation such as
Exactly 0.5 gm Chrome Azurol S concentrated and
incising, steaming, or boultonizing.
No vacuum-
5gms sodium acetate was dissolved in 80 ml of
pressure process is more effective than the full cell in maximizing the uptake or penetration of preservative.
Penetration is the depth to which there has been
water and dilute to 500 ml
The solution was sprayed over freshly cut surfaces of treated wood sample. Deep blue color reveals the presence of copper and dried wood gave better results. The chemical needed for testing the penetration of boron and copper is not available
penetration of preservative. After
dipping, the
and these are also costly. As this testing procedure
samples were dried for the determination of
IJSER © 2013 http://www.ijser.org
International Journal of Scientific & Engineering Research, Volume 4, Issue 8, August-2013
ISSN 2229-5518
995
is not cost effective so these methods have not been
done but easy method has been done to measure the penetration by using extended borer.
Considering a
efficiency, η = 70%
The thickness t =
welded joint with welding
PD
![]()
2*δt* η
Retention refers to the weight of dry salt absorbed
per cubic meter of wood. Preservative retention of
wood samples was calculated by the volumetric
Or, t =
7*105*0.60![]()
2* 6.53*107*0.7
analysis. To determine the retention, two weights
of every sample were taken i.e., oven dry weight
Or, t = 4.67*10-3 m
Or, t ≡ 4.67 mm
before treatment and oven dry
weight after
Or, t = 5 mm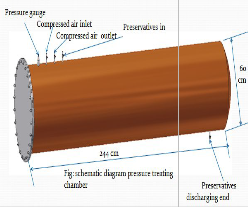
treatment. Then the weight of preservative
solution penetrated in the sample, was calculated from the difference of that two weights. Retention
was expressed as lb/cu ft. Finally,
the following
formula was used to determine the retention
Retention =
Weight of salt (preservative)
Volume of sample
The treating chamber is filled with preservatives and wood specimen is dipped into this preservative solution and the pressure will apply for treatment the wood efficiently. So, considering the pressure and the amount of preservative that
Fig 3.3: Preservative Treatment Cylinder.
use in treatment process, the design specification is
Pressure
chamber is designed considering its
made.
Calculation of cylinder wall thickness (for diameter
0.60m):
Considering,
Material AISI C1020 As Rolled
Yield strength, Sy = 3.27*108 N/m2
Factor of safety, Nsy = 5
Cylinder diameter D = 0.60m
Working pressure P = 7 bar = 7*105 N/m2
Design stress = (48/5) = 6.53*107 N/m2
According to the book of “strength of materials, fourth edition” the following formulas are used [15]: PD
Hoop stress, δt =
2t
7*105*0.60
Or, 6.53*107 = 2t
7*105*0.60![]()
Or, t =
2* 6.53*107
Or, t = 3.32*10-3 m
Or, t = 3.32 mm
resistance to withstand pressure 10 bar (Fig 3.3).
The design specifications are:
Cylinder diameter = 60 cm, Cylinder length = 244 cm
Gate diameter = 71 cm
Cylinder flange, outer = 71 cm, inner = 60 cm
Cylinder bottom = 60 cm
In full cell vacuum pressure process, a vacuum creating device (Fig 3.5),vacuum pump or air compressor with reverse flow of air is connected with the treating chamber to create initial vacuum about 550 mm Hg, or 73.36 kPa inside the closed chamber. The vacuum pump is selected of capacity
64 l/min or 1 hp.
The seasoning chamber (Fig 3.4) has been designed and constructed considering the temperature of that chamber. It consists of three major parts namely solar collector, storage and a chimney. The dimension of the storage is 244 cm×107 cm×153 cm. The dimension of the collector surface is 244 cm×183 cm. The temperature inside the dryer has
IJSER © 2013 http://www.ijser.org
International Journal of Scientific & Engineering Research, Volume 4, Issue 8, August-2013
ISSN 2229-5518
996
increased up to 530 C when outside temperature
was 330C.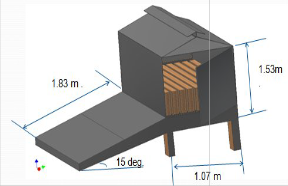
.
Fig 3.4: Schematic diagram of
Chamber
a Seasoning
A certain amount of pressure required to penetrate the preservatives into the wood specimen which is developed by pressing device. In full cell process, it is required to attain pressure ofabout 5 bars to 7 bars. A v-type2 cylinder compressor (Fig 3.6) is selected whose capacity rating is 8 bar and motor having capacity of 7.5 KW.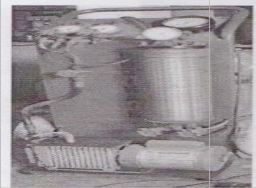
Figure3.5: Photograph of Vacuum Pump
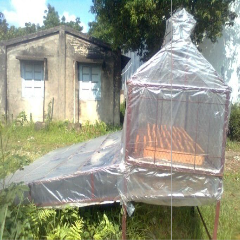
Figure 3.7A: photograph of seasoning chamber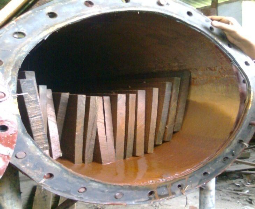
Figure 3.7B: wood stacking phenomena.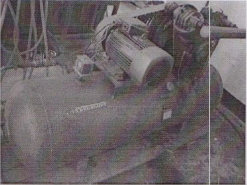
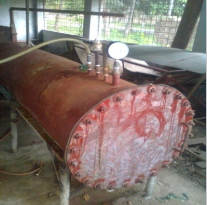
Figure
3.7C: photograph of pressure treating
Figure 3.6: Photograph of Air Compressor
chamber.
IJSER © 2013 http://www.ijser.org
International Journal of Scientific & Engineering Research, Volume 4, Issue 8, August-2013
ISSN 2229-5518
997
To construct the treating cylinder the following material were also used.
Table 3.2: Table of components and materials
Components | Materials |
1. Main Cylinder | 5 mm thick and 0.60m dia. MS sheet |
2. Cylinder Gate | 10 mm thick and 0.71m dia. MS plate |
3. Sealing Material | 0.71 m dia. rubber tube |
4. Nuts and Bolts | 24 nos MS nut and bolts |
5. Valve | 5 nos |
6. Pressure Gauges | 10 bar capacity |
7. Solution Tank | Plastic Tank |
8. Reservoir Tank | Plastic Tank |
chosen MS plate which was bended and welded to
desired shape as a cylinder. Gate of the cylinder
was made by 10 mm thick MS plate whose diameter was 0.71 m.
The components of preservative chemicals as Potassium Dichromate (K2Cr2O7), Copper Sulphate (CuS04) and Boric Acid (H3BO3) which are available in local market. The entire components are commercial grade, which should have in excess of 95% purity as per American Wood Protection Association (AWPA) Standard P5, 2002.
Since the moisture content of the testing sample is around 15% hence the required amount of chemical solution is 5% of CCB. So, for the first charging, the weight of Potassium dichromate, copper sulphate and boric acid in preparing CCB
chemicals solution of 291 litres are given below: Potassium Dichromate- 5.8 kg
Copper Sulphate- 5.8 kg
Boric Acid- 2.9 kg
Total- 14.50 kg
CCB chemicals of 14.50 kg weight having PH = 4 and mixed 291 litres of water for making 5% solutions. After first charging, the volume of chemical solution absorbed by testing wood sample is 111 litres. Hence, for the second charging, the remaining chemical solution is reused and mixed with new chemicals in order to create a solution of 347 litres .These volume of chemical solution is totally depends on the volume of testing wood sample placed in pressure treating chamber and also depends on the volume of air gap allowed here. For second charging, the PH of the chemical solution was maintain about 4.3 and for making 347 litres of chemical solution the total weight of the chemical component are:
Potassium Dichromate- 6.94 kg
Copper Sulphate- 6.94 kg
. Boric Acid- 3.47kg
Total- 17.35 kg
The numbers of treated wood samples are 52
pieces of size 183 cm×30.5 cm×2.54 cm and after that, these wood samples are placed in a seasoning chamber then all the physical properties of wood are measured.
In non-pressure process, green wood was first dried in seasoning chamber. When sufficient amount of moisture was reduced then wood is coated by coal-tar creosote. This coated wood was further dried in seasoning chamber up to oven dried weight. Then several properties of wood were measured.
In pressure process, firstly oven dried wood were placed in pressure treating chamber. Then chemical was charged into the pressure treating chamber and applied high pressure and kept it for
1 day in order to gain proper penetration of
chemical preservative into the wood. Then treated wood was released from pressure treating chamber and kept it in to seasoning chamber. When the oven dried weight was found then several properties of wood were measured.
IJSER © 2013 http://www.ijser.org
International Journal of Scientific & Engineering Research, Volume 4, Issue 8, August-2013
ISSN 2229-5518
998
In order to compare the properties of treated and
Table 4.2: table for change of percentage of weight reduction:
untreated wood several required
collected. These are listed below: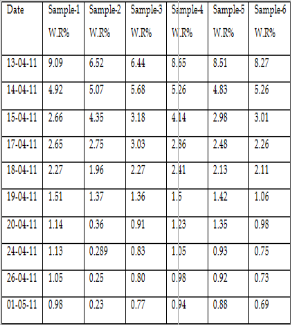
data were
At solar kiln wood was dried and all the data after removal of moisture was measured and presented here with Table 4.1.
Table 4.1: Table for change of weight of wood specimens during drying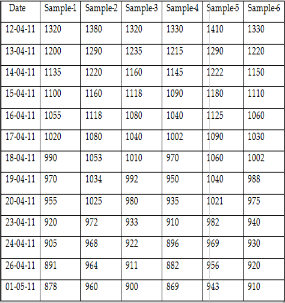
Due to change of weight,
density of wood
specimen also changed and this change is listed below at Table 4.2A & Table 4.2B.
Table 4.2A: Change of density of sample wood specimens treated by Brushing process:
Initially the amount of moisture
contained in
woods specimen is high so the rate of weight reduction is greater. During the seasoning process,
the moisture of wood specimen
decreased hence the percentage
is gradually
of weight
reduction is also decreased. The percentages of weight reduction of selected wood specimen are given below:
IJSER © 2013 http://www.ijser.org
International Journal of Scientific & Engineering Research, Volume 4, Issue 8, August-2013
ISSN 2229-5518
999
Table 4.2B: Change of density of sample wood
specimens treated by Dipping process:
For the good treatment of wood ,moisture content should maintain below 25%.At solar kiln, wood was dried and moisture content was reduced to average 71.5%.This reduction of moisture is listed below at Table 4.2E.
After
treatment of wood with preservative
Table 4.2E: Percentage reduction of moisture
solution, it was dried at solar kiln and weight was
measured and subtracted this weight with the
content of wood specimens.
weight of untreated wood which
indicate the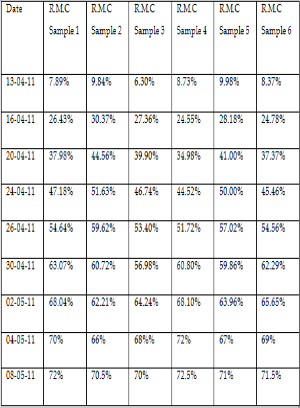
amount of preservative was retained and dividing it with unit volume of wood specimen retention was found. Retention of preservative in test wood specimen was calculated and listed in Table 4.2C &
4.2D.
Table 4.2C: Retention at different wood specimens treated by Brushing Process:
Sample No | Before Treatment Weight in, kg | after Treatment Weight in, kg | Retention in, kg/m³ |
01 | 0.801 | 0.918 | 99.15 |
02 | 0.812 | 0.925 | 95.76 |
03 | 0.839 | 0.929 | 76.27 |
04 | 0.834 | 0.940 | 89.83 |
Table 4.2D: Retention at different wood specimens treated by Dipping Process:
IJSER © 2013 http://www.ijser.org
International Journal of Scientific & Engineering Research, Volume 4, Issue 8, August-2013
ISSN 2229-5518
1000
Due to change of weight, density of wood specimen also changed and this change is listed below at Table 4.3A
Table 4.3A: Change of density of sample wood specimens treated by Full-cell Pressure process:
After treatment of wood with preservative solution, it was dried at solar kiln and weight was measured and subtracted this weight with the weight of untreated wood which indicate the amount of preservative was retained and dividing it with unit volume of wood specimen retention was found. Retention of preservative in test wood specimen was calculated and listed in Table 4.3B.
Table 4.3B: Retention at different wood specimens treated by Full-cell Pressure process:
This process is an adaptation of the Bethell process for use with waterborne preservatives like CCB. It achieves full penetration with a reduction in the weight of water left in the wood. So, drying is important before preservative treatments. Multistage solar kiln was used to dry the sample woods. At first wood specimen was sized as required dimension and collected and arranged in different stages. Proper sealing reduce the heat loss inside the chamber and helps to utilize the heat and dry quickly. A solar collector was attached with it to increase the amount of heat gain inside the kiln chamber. Transparent plastic was used to produce green-house effect and trap heat. This heat vaporized the water particle inside the wood and dried it.
Different types of relevant data were placed in chapter IV. Now the graphical representations of those data are given below:
Graphical representation of wood properties
treated by Non-pressure process:
The graphical representation of Table 4.2 is
IJSER © 2013 http://www.ijser.org
International Journal of Scientific & Engineering Research, Volume 4, Issue 8, August-2013
ISSN 2229-5518
1001
10
9
8
7
6 sample
5 01
4 sample
3 02 sample
2 03
1000
800
600
400
200
0
density, before
density,
% W.R1
sample
1 2 3 4
after
0 04
Time ![]()
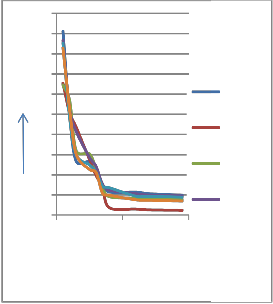
Figure 5.1: Percentage of weight reduction
Vs. Time
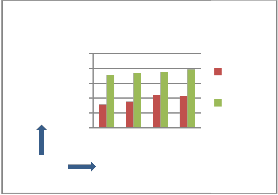
The graphical representation of Table 4.2A is: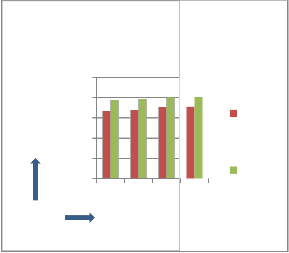
Figure 5.2B: Change of density before and after
treatment for individual four test sample in
Dipping process.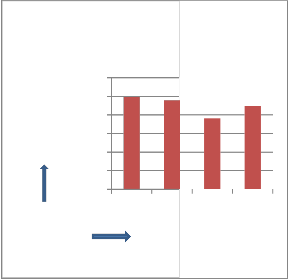
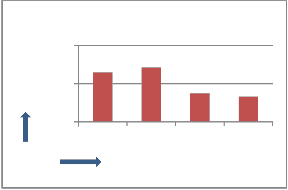
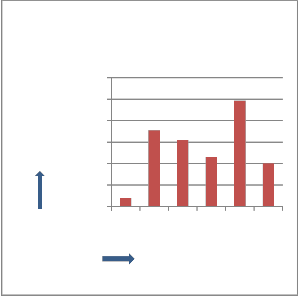
The graphical representation of Table 4.2C is:
850
120
100
800
750
700
650
600
1 2 3 4
density, before density, after
80
60
40
20
0
1 2 3 4
Figure 5.2A: Change of density before and after treatment for individual four test sample in Brushing process.
The graphical representation of Table 4.2B is:
Figure 5.2C: Retention of different test wood specimen in Brushing process.![]()
IJSER © 2013 http://www.ijser.org
International Journal of Scientific & Engineering Research, Volume 4, Issue 8, August-2013
ISSN 2229-5518
1002
The graphical representation of Table 4.2D is:
120
100
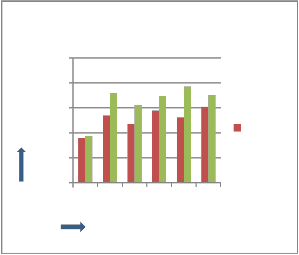
The graphical representation of Table 4.3A is:
1000
800
600
80
1 2 3 4
400
200
0
1 2 3 4 5 6
Density, Before
Figure 5.2D: Retention of different test wood
specimen in Dipping process.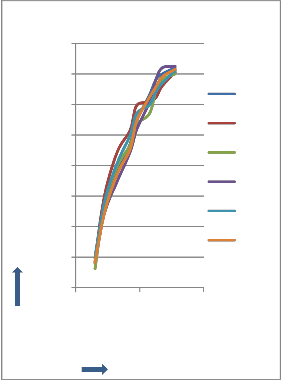
The graphical representation of Table 4.2E is:
Figure 5.3A: Change of density before and after treatment for individual six test sample in Full-cell pressure process.
80.00%
70.00%
60.00%
50.00%
40.00%
30.00%
20.00%
10.00%
0.00%
sample
01 sample
02 sample
03 sample
04 sample
05 sample
06
The graphical representation of Table 4.3B is:
300
250
200
150
100
50
0
Time
1 2 3 4 5 6
Figure 5.2E: Percentage change of reduction of
moisture content.
Graphical representation of wood properties
treated by Full-cell Pressure process:
Figure 5.3B: Retention of different test wood specimen in Full-cell pressure process.
IJSER © 2013 http://www.ijser.org
International Journal of Scientific & Engineering Research, Volume 4, Issue 8, August-2013
ISSN 2229-5518
1003
5.0 Cost analysis and comparison
Let, working days per year = 250
For drying each lot of wood requires 7 days in summer, 9 days in winter, 14 days in rainy season Average required days for drying each season =
10days
So, total 25 lots can be dried in 250 days
Capacity of drying chamber i.e. amount of wood in each lot = (7 inch×2.75 inch×3.5 inch) = 67.375 ft3 ≡
70 ft3 (here some spaces were kept free for easy
loading and unloading).
Total construction cost of drying chamber =
13,000Tk.Economic life = 1 yr.
So, construction cost per lot = (13000/25) = 520 Tk. Cost per cft = (520/70) = 7.43 Tk.
Here, one lot can be treated in each day So, total 250 lots can be treated in a year Amount of wood in each lot = 17 ft3
Total cost of pressure chamber = 30,000 Tk. Economic life = 5 yr.
So, cost per year = (30,000/5) = 6000 Tk. Cost per lot = (6000/250) = 24 Tk.
Cost per cft = (24/17) = 1.41 Tk.
For pressure process: 17 ft3 woods were treated in each charging Chemical cost per charging = 6000
Tk.
Chemical cost per cft = (6000/17) = 353 Tk.
For non-pressure process:
Cost of coal-tar creosote per day = 780 Tk.
Amount of treated wood specimen per day = 5 ft3
So, cost per cft = 156 Tk.
5.4 Labour Cost:
For pressure process:
Labour cost per cft = (200/17) = 11.76 Tk.
For non-pressure process:
Labour cost per cft = (200/10.08) = 19.84 Tk.
Labour cost per cft during loading and unloading of wood sample in drying chamber = (loading or unloading time ×cost per working hour)/volume of wood sample per lot in drying chamber = (50/70) =
0.72 Tk.
So, Actual labour cost per cft in pressure process =
11.76+0.72 = 12.48 Tk.
And actual labour cost per cft in non-pressure
process = 19.84+0.72 = 20.56 Tk.
IJSER © 2013 http://www.ijser.org
International Journal of Scientific & Engineering Research, Volume 4, Issue 8, August-2013
ISSN 2229-5518
1004
The wood has been treated by pressure and non- pressure process but the change of treated wood properties are different .these differences are given below:
The density of wood found by pressure process is
better than non-pressure process. Again in non- pressure process the density of wood found by Dipping process is better than Brushing process.
The chemical has penetrated highly in pressure process comparatively in non-pressure process. So, the depth of penetration is higher in pressure process than non-pressure process.
The value of retention in pressure process is greater than non-pressure process.
The cost per cft of wood in pressure process is
greater than non-pressure process.
The above comparisons are shown in table (4.2A to
4.2D, 4.3A, 4.3B) and graph (4.2A to 4.2D, 4.3A,
4.3B). From the above discussion it can be said that the pressure process is better than non-pressure process.
Weight of test wood specimen was reduced as it was dried at solar kiln. At cabinet type solar drier, the temperature was not fixed but fluctuated with solar intensity. As a result the loss of weight was not uniform which was shown in Figure 4.1. According to the Figure 4.1 at first the weight of wood reduces rapidly downward but after some days, this change was comparatively low. The amount of preservative penetrated in test wood specimen was indicated in Art. 5.0 after adding the solution named chrome azurol. This solution was reacted with CCB chemicals and forms a dark color zone which showed the length of penetration. Variation of pressure and duration of time of treatment, the penetration was also varied. For this project, the pressure was chosen 7 bar considering the treatability of mango wood and kept this pressure about 16 hours. In first case, 291 litres of CCB chemical was charged and in second case, additional 167 litres were added with previous 180 litres measured after treatment, total 347 litres of CCB chemical was charged and analyzed their comparative penetration.
Due to the mechanical difficulties associated with sealing a high pressure chamber and also
operating its valves and fluctuation of temperature in seasoning chamber.
The cost per CFT of treated wood sample in pressure process is 373.6 taka and in non-pressure process is 233.62 taka.
Wood is a renewable natural resource that typically is preservative treated to ensure structural integrity in many exterior applications. Treating wood can withstand fungal decay and insect damage and it is critical to producing a high quality wood product. Necessity of wood in our country is increased but our resources are limited. Again the durability is not same for all wood species. So that wood preservation process help for better utilization of wood. But sometimes wood preservation process is so expensive which also increase the price of wood. So proper design of a wood preservation system will minimize the price of wood and make it available to all.
In this project the following recommendation can be done.
Natural preservatives like Neem extract and NECB can be used as it is non-toxic which will reduce the cost of chemicals for making CCB solution.
Process time can minimize by increasing pressure
within limit of process plant. By using glass instead of polythene in cabinet type solar drier, temperature inside drier can raise more and give better result for reducing moisture content in less time.
Rain Tree can be used instead of mango tree as both of them are moderately durable but treatable species and have interlocked grain.
7.0 ACKNOWLEDGEMENT
The authors express their deep sense of gratitude, regard and sincere thanks to their Supervisor, Dr. A.N.M. Mizanur Rahman, Professor, Department of Mechanical Engineering, Khulna University of Engineering & Technology, for his magnanimous guidance and valuable counsel in execution, completion of the project work and immense help during the preparation of this report, without which it would have simply impossible to carry out the work. Thanks are extended to Dr. Mihir Ranjan Halder, Professor and Head, Department of
IJSER © 2013 http://www.ijser.org
International Journal of Scientific & Engineering Research, Volume 4, Issue 8, August-2013
ISSN 2229-5518
1005
Mechanical Engineering, KUET for providing various laboratory facilities of the department to finish this project work. Thanks to Prof. Dr. MuhammedAlamgir, Vice-Chancellor, Khulna University of Engineering & Technology to provide financial support for completing the project. Authors also extend their coral thanks to those teachers and seniors who have helped for this project work directly or indirectly to complete it. Finally, thanks to all of the officers and staffs of Heat Engine Laboratory, Machine Shop, Production Shop, Welding Shop & Chemistry Laboratory of KUET and Nordic Wood Limited, Khulna for their technical help.
8.0 REFERANCES
[1] Lahiry, AK., 1995b. Wood preservation science (In Bengali). Bangla Academy,Dhaka, 1st edition, vol. 1, 184p.
[2] Jayanetti, D. L. 1986. Wood preservation manual.FAOForestry-paper.1986, No. 76,152pp.
[3] Anon, 1970. Indian Forest Utilization.Volume 1.Forest
Research Institute andColleges, Dehra Dun, India, 357pp.
[4] Latif, M. A; Dasgupta, S. R.; De, B. C. and Zaman, Y. U.
1987.Preservativetreatment of bamboo and low cost housing.Wood preservation series, Bulletin 3,Bangladesh Forest Research Institute, Bangladesh, 1-5pp.
[5] Pohleven, F.; Humar, M.; Amartey, S. and Benedik, J.
2002. Tolerance of Wood Decay Fungi to Commercial
Copper Based Wood Preservatives. IRG/WP 02-30291, 12.
[6] Richardson, H. W. 1997. Handbook of copper compounds and applications. M. Dekker, New York, 93-122.
[7] Dickinson, D. J. and Murphy, R. J. 1989. Development of boron based wood preservatives. Presentation, BWPA Convention, (1989).
[8] Shrivastava, M. B. 1997. Wood Technology.Vikas
Publishing House (Pvt.) Ltd. 82-123pp.
[9] Barry A Richardson, Wood Preservation, Second Edition, E & F Spon, An imprint of Chapman & Hall [10]http://en.wikipedia.org/wiki/Wood_preservation#Histor
y
[11] F. Thomas Milton, the Preservation of Wood. A Self
Study Manual for Wood Treaters 1995,
[12] Rabbi, Fazle& Islam, Mahmudul, 2010. Project report on “Wood preservation by full cell process”, Dept. Of Mechanical Engineering, KUET. [13]http://www.fao.org/docrep/81146e/81146e04.htm
[14] http://en.wikipedia.org/wiki/Wood_preservation
[15] Pytel, Andrew& Singer, Ferdinand L.2006-2007, Strength of Materials, Fourth Edition, HarperCollins Publishers, Singapore.
.
IJSER © 2013 http://www.ijser.org