International Journal of Scientific & Engineering Research, Volume 4, Issue 11, November-2013 267
ISSN 2229-5518
Efficient Clustering Algorithm for Storage
Optimization in the Cloud
1, 2School of Computer Science and Engineering, VIT University, Vellore-632014, Tamil Nadu, India
Abstract— In this paper we define a clustering algorithm that efficiently tries to partition the data and assign it to the respective virtual data centers. The Hadoop Distributed File System defines a Namenode which supervises various Datanodes. Here Datanodes are already classified as clusters whereas the namenode acting as a server implements the algorithm to decide where to place the data. Data received from the client is tracked by the Namenode. The distance is measured based on the degree of closeness of the input data received from the client to the clusters present. A comparison is drawn between the data and the various clusters present. The cluster having the maximum degree of closeness is chosen to hold the data. Utilizing this algorithm we can reduce the access time and retrieval is made easier for the data enquired. Further an iterative process is carried out to form such clusters within the datanode itself to make access of data easier through parallelization.
Index Terms— Big Data, Canopy Method, Cloud Computing,CP Clustering Algorithm, HDFS, Hadoop, Map-Reduce
—————————— ——————————
HERE has been phenomenal growth in the use of internet for the exchange of information, ideas and opinions. Till recently the data acquired from various sources such as social media, social networking websites, organizations, industries, government, military etc. was contained in a relational database. Off late this format of data storage has reached its limits. With this exponential rise in the amount of data it has become difficult to manage and control data. This has invariably shown a shift from the traditional database systems to the cloud computing techniques to manage “Big
Big Data is a term used to describe large collections of data(also known as datasets). This data may be structured, unstructured or semi-structured. It is growing so largely that it is difficult to manage with regular database or statistics tools. With this massive quantity of data, businesses need fast, reliable, deeper data insight. Therefore, we make use of cloud computing techniques to manage this data.
Cloud Computing is the next stage in the internet’s revolution. As defined by NIST Cloud Computing is a model for enabling convenient, on-demand network access to a shared pool of configurable computing resources (e.g., networks, servers, storage, applications, and services) that can be rapidly provisioned and released with minimal management effort or service provider interaction. It is referred to as “cloud” since it provides all the above mentioned shared pool of configurable computing resources. Various types of services provided by the cloud are Software as a Service, Platform as a Service and Infrastructure as a Service. With the increase in the number of applications and data produced across various organizations a large amount of data is being brought into picture. Consider the products developed by Google, it has come up with a wide
variety of apps such as Google Docs, Google Maps, Google Opensocial and Gmail which are based on Software as a Service provided in the cloud. This clearly points out to the fact that with the explosion of ‘Data’ being collected, we are compelled to coin the new term ‘Big Data’.
Big Data is a term used to describe large collections of data which is also known as datasets. This data can be structured, un-structured or semi-structured. It is growing so largely that it is difficult to manage with regular database or statistical tools. Structured data refers to data with a defined format such as XML document or database tables. Semi-structured data refers to a structure which has a schema for example spread sheets(a structure having a grid of cells). Unstructured data refers to the data which does not have any particular internal structure for example a plain text or image file. About
80% of the big data is un-structured. Therefore, it has become mandatory for efficient storage, management and control of this data.
Generally, for big data management Hadoop as an open- source software is used. The Hadoop Big Data management structure comprises of two parts i.e. Distributed Data Processing implemented using the Map-Reduce concept and Distributed Data Storage implemented by the Hadoop Distributed File System. The three major categories of machine roles in a Hadoop deployment are Client machines, Namenode(Master Node) and Datanodes(Slave Nodes). The Master nodes oversee the two key functional pieces that make up Hadoop : storing lots of data(HDFS) and running parallel computations on all that data(Map-Reduce).
HDFS is the primary storage system used by Hadoop applications. HDFS splits the data into several pieces called data blocks. HDFS creates multiple replicas of data blocks and
IJSER © 2013 http://www.ijser.org
International Journal of Scientific & Engineering Research, Volume 4, Issue 11, November-2013 268
ISSN 2229-5518
distributes them on computer nodes throughout a cluster to enable reliable, extremely rapid computations. It is essentially master-slave architecture. The cluster comprises of a single Namenode that manages the file system. It handles the Metadata operations i.e. Name, replicas etc. and the block operations like opening, closing and remaining files and directories. It also determines the mapping of blocks to datanodes. Datanodes on the other hand manage storage attached to the nodes. These datanodes consist of blocks of data which is generated when the file is internally split into one or more blocks. The datanodes are responsible for serving read and write requests from the file system’s clients. The datanodes also perform block creation, deletion, and replication upon instruction from the Namenode.
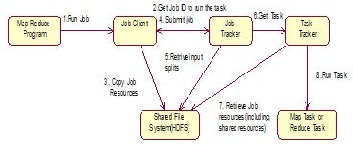
Map-Reduce model is used to process the querying data, when client tries to read from the files stored in HDFS. First “Map” function is applied to run a particular computation based on the client query on the nearer nodes where data are stored in the form of clusters.. Further, the Mapped task at each node is reduced using “Reduce” function. This process starts with the submission of Map-Reduce job, the final output will be either Map task or Reduce task. This submission of Map-Reduce job takes place under the shared file system. We use this model because every computation can be calculated in the form of function which reduces time complexity.
Map-Reduce operations are processed using (key, value). Map Reduce concept is based on Inverted Index. The below table explains the input and output of this model.
Function | Input | Output |
map | <k1,v1> | List(<k2,v2>) |
reduce | <k2,list(v2)> | list(<k3,v3>) |
Table 1.Map-Reduce Model
Figure 1.State Start Diagram of Map-Reduce Job
![]()
Here, most of the data entering to the shared file systems of Hadoop are unstructured one. So before the data gets mapped, Hadoop changes the data into (key-value) pair. The mapped data will be a list of key-value pair. Here (k1,v1) has been changed into (k2,v2) which can be taken as duplicate keys. Then shuffling is done to group the data together. List of v2 , output of map will be grouped by new key k2 and then
finally new list will come out with (key-value) pair as k3,v3.
Traditional clustering methods include CLARANS, DBSCAN, NEURAL NETWORKS etc. However these all clustering algorithms prove to be inefficient when it comes to Big Data management. Due to time and space complexity, Dhillon and Modha developed a parallel processing k-means algorithm. It has been found that this algorithm is more efficient than traditional neural networks algorithms like c-means etc. However when datasets are large k-means cannot manage space complexity. Therefore, Heng Li, Dan Yang and WeiTao Fang in his paper proposed a new algorithm for parallel cloud based on finding Canopies, called CPCluster algorithm. In the recent sections we will illustrate this algorithm in detail.
As mentioned above the clustering algorithm is mainly put to sue so that objects of similar nature and features are put under the same cluster. Considering the shortcomings of the formation of clusters the computational cost of clustering which is high due to which the cluster fails to proceed most of the times. This can be overcome by CPCluster for clustering that is efficient when the problem is large. The idea presented herein is to schedule the process as a two stage process. The first one is a rough and quick way to form clusters which are overlapping subsets known as “canopies”. Second step uses these canopies as initialization points, and then Map Reduce function is applied to get the reduced or mapped task. The Map Reduce function improves the partitioning and later clustering of data. The input big-data is collected at a particular place over a long duration of time before assigning it as data chunks to the Canopies which is later processed to bring about the output.
The most essential concept in clustering is calculating the similarity between the objects. Clustering here happens based on the distance measure in order to create some number of overlapping subsets, called canopies. In simple terms this method employs some threshold values. Assuming these values to be T1 and T2 where T1>T2, which can be assigned by the user, we compare the distance between the data chunk received and the two threshold values. Any data chunk among those received can be assumed to be the center from which the distances are calculated. All the points within the threshold value of T1 are put into the canopy T1. This is how the rough clustering of the initially received data sets is carried out.
IJSER © 2013 http://www.ijser.org
International Journal of Scientific & Engineering Research, Volume 4, Issue 11, November-2013 269
ISSN 2229-5518
Figure 2.Subsets of Canopies
The concept of Map-Reduce [2] process has already been illustrated in section [2]. In CPClustering algorithm, after Map-Reduce process cluster is again formed of the mapped data based on the closeness property. This cluster is formed through iterative method which gives the optimal solution.![]()
Map Combine Reduce![]() cluster
cluster
Iteration![]()
Figure 3.Iterative method to form final cluster
We initialize the weights randomly and with two distance thresholds, DT1 and DT2, where DT1> DT2. The threshold values are chosen by the user.
The algorithm is defined as follows: While(the list is not empty)
{
Pick a point on the list
Take the point as the center of a new Canopy, approximately
measure its distance to all other points.
Put all points that are within distance threshold DT1 into a
canopy
Remove from the list all points that are within distance
threshold DT2
}
We begin analyzing this algorithm by observing the abstract model of a cluster. The cluster class object consists of the parameters which include
Id: int numofPoints: long center
radius
s0 : double s1 : double s2 : double
The class functions are:
computeParameters()
observe()
getObservations()
Here, the general terms of algorithm has been defined: “numofPoints”: It represents the total number of points that is contained within the cluster.
“center”: It represents the total number of points that is
contained within the cluster.
“radius”: It represents the standard deviation of each point
which is calculated from s0, s1, s2. It reflects the deviation of a
point form the initializing or center point.
s0 = ∑wi (1)
s1 = ∑xi wi (2)
s2 = ∑xi 2 wi (3)
The function computeParameters() computes the numofPoints, center and radius.
numofPoints = (int)s0 (4) center = s1 /s0 (5) radius = √ (s2 s0 -s1 s1 )/s0 (6)
This function is iterated until we get optimal solution for the data represented as point. Since it is based on calculation of centroid of a cluster, we reset
s0 =0
s1 =s2 =NULL
The function observe() is used to update the values s0 , s1, s2 when a new point is added to the cluster.
getObservations() function works on the object obtained after the above mentioned two functions are calculated and then an iteration is carried out following the same Map-Reduce function to obtain:
Step 1: Generate canopies
The canopy method is used to generate canopies which cluster
similar data forming subsets.
Step 2: Map-Reduce Iterative Step
Distance of new point is calculated and is added to the cluster center nearest to it in the degree of closeness. Since Map- Reduce model is based on <key, value> pair, the key represents clusterIdD and value is the list we have created of
different datasets.
Shuffle operation: All the points are then collected at a point where the clusterID of each point is determined to be the same.
Reduce Operation: Summary of all the output points obtained after the combiner operation after which a cluster center is obtained when the final iteration is done. It determines whether the final cluster center obtained is in compliance with the initial parameters initially acquired.
Step 3: Forming cluster
Each time a new data is loaded its distance with the final
cluster is calculated. The point is then added to the
appropriate cluster whose distance calculated is minimum.
IJSER © 2013 http://www.ijser.org
International Journal of Scientific & Engineering Research, Volume 4, Issue 11, November-2013 270
ISSN 2229-5518
As the data is growing day-by-day, efficient management of this data has become indispensible and a necessary area for research. Now days data are being received in chunk, storage of such large datasets requires huge memory which is limited. So some efficient algorithm is needed to process the data in an efficient manner reducing both time and space complexity. The work presented by Heng Li,Dan Yang,WeiTao Fang has been able to reduce the run time even for very large data sets which cannot be processed with k-means algorithm. However the running time is inversely proportional to the number of data sets. For smaller data sets CPCluster requires more time to process than k-means. The explanation for the same is given as that the background task of the map reduce framework are relatively slow to start, so each separate map reduce job that is started slows down the algorithm. Future work can be based on defining one single algorithm which is efficient in both small and large data sets.
We would like to thanks Prof Shalini L. for helping with the Big Data clustering materials and providing laboratory facilities.
[1] Heng Li, Dan Yang, WeiTao Fang, Parallel based on cloud computing to achieve large data sets clustering. Chongqing, China
[2] Richard O. Duda, Peter E. Hart, David G. Stork. Pattern Classification
(2ndedition).Beijing: China Machine Press, 2004.
[3] Christopher D. Manning, Prabhakar Raghavan, Hinrich Schutze.
Introduction to Information Retrieval. New York: Cambridge University
Press, 2008.
[4] W. Gropp, E. Lusk, A. Skjellum, Using MPI: Portable Parallel Programming with the Message Passing Interface, The MIT Press, Cambridge, MA, 1996.
[5] D. Judd, P. McKinley, A. Jain, Large-scale parallel data clustering,
Pattern Analysis and Machine Intelligence, IEEE Transactions on 20 (8)
(1998) 871 –876.
[6] I. Dhillon, D. Modha, A data-clustering algorithm on distributed
memory multiprocessors, in: M. Zaki, C.-T. Ho (Eds.), Large-Scale Parallel Data Mining, Vol. 1759 of Lecture Notes in Computer Science, Springer Berlin / Heidelberg, 2000, pp. 802–802.
[7]Apache Software Foundation, Hadoop, 2011. wiki.apache.org/hadoop.
[8]S. Ghemawat, H. Gobioff, S.-T. Leung, The google file system,
SIGOPS Operating Systems Review 37 (2003) 29–43.
[9] J. Dean and S. Ghemawat. Mapreduce: Simpli_ed data processing on
large clusters. Operating Systems Design and Implementation, pages
137–149, 2004
[10] S.G. Jeffrey Dean, MapReduce: simplified data processing on large
clusters, in:Proc. of the 6th OSDI.
[11] J. Cohen, Graph twiddling in a MapReduce world, Computing in
Science and Engineering 11 (2009) 29–41.
IJSER © 2013 http://www.ijser.org