International Journal of Scientific & Engineering Research Volume 2, Issue 5, May-2011 1
ISSN 2229-5518
Effects of Socio-Demographic Covariates on Blood Glucose Level of the Diabetic Patients: A Multiple Classification Analysis (MCA)
Md. Behzad Noor, Dr. Mir Mohammad Azad, Dr. J.A.M. Shoquilur Rahman
Abstract— This study has been undertaken to determine the socio-demographic related covariates affecting blood glucose level of the di- abetic patients as well as to identify the extent of influences of the variables by the implied factors on blood glucose level. Data have been collected from two diabetic diagnostic centers in Rajshahi City. The result implies that insulin intake, blood pressure, tablet intake and mental suppression of the diabetic patients have the intense influence on blood glucose level. The proportion of variance explained (adjusted) by the
respective variables are � 2 = 0.422, 0.122 and 0.120 respectively. So, the diabetic patients are supposed to maintain their medication, con- trol their blood pressure, become free from mental suppression, overall, giving up the sedentary life style. They should maintain a regulatory
life to keep themselves away from having high blood glucose level.
Index Terms— Glucose Level of Diabetic Patients.
—————————— • ——————————
LUCOSE is a main source of energy for the cells that make up our muscles and other tissues. Blood glucose tests measure how well our body processes sugar (glu-
cose). A normal fasting blood glucose result is lower than
100 milligrams of glucose per deciliter of blood (mg/dl) [1].
Hyperglycemia, or high blood glucose levels, is the hallmark
of diabetic and it is linked to the development of long-term
diabetic complications. Healthy people without diabetic
typically have blood glucose levels of 65-110 mg/dl and 120-
140 mg/dl one to two hours after eating [2, 3].Type-I di-
abetes is an autoimmune disease. An autoimmune disease
results when the body’s system for fighting infection (the immune system) turns against a part of the body. In di- abetes, the immune system attacks and destroys the insulin- producing beta cells in the pancreas. The pancreas then pro- duces little or no insulin. A person who has type-I diabetes must take insulin daily to live.
————————————————
'} Md. Behzad Noor1, Received M.Phil (Fellow),M.Sc. (Thesis) First Class, First Department of Human Resource Development (HRD), Major in HRM and B.Sc. (Hons) from University of Rajshahi, Working as Lecturer, Departmen- tal of Business Administration, Shanto Mariam University of Creative Technology, , PH:+8801923051674, bnoor_ru08@yahoo.com, Dhaka, Ban- gladesh
'} Dr. Mir Mohammad Azad2, Received PhD in Computer Science from Gol-
den State University. Received Masters of Computer Application (MCA) De- gree from Bharath Institute of Higher Education and Research Deemed Uni-
versity (Presently Bharath University) and Bachelor of Computer Application (BCA) Degree from Bangalore University, India, Presently Working as an Assistant Professor and Departmental Head of Computer Science and Engi- neering, Shanto Mariam University of Creative Technology, PH:+8801191695195, azadrayhan@gmail.com, Dhaka, Bangladesh.
'} Dr. J.A.M. Shoquilur Rahman, Professor,Department of Pupolation Science
and Human Resource Development,University of Rajshahi,Rajshahi, Bangladesh
In type-II diabetic, the pancreas is usually producing enough insulin, but for unknown reasons the body cannot use the insulin effectively, a condition called insulin resis- tance. After several years, insulin production decreases. The result is the same as for type-I diabetes - glucose builds up in the blood and the body cannot make efficient use of its main source of fuel [4]. Worldwide, type-II diabetes has soared to epidemic proportions and is at the forefront of current public and community health intervention in both Western and developing countries. Obesity, consanguinity, blood pressure, total cholesterol, HDL-cholesterol and trig- lyceries are more prevalent in diabetic patients [5]. It is esti- mated that 135 million people worldwide have diagnosed diabetes in 1995, and this number is expected to rise to at least 300 million by 2025 [6]. The prevalence data on di- abetes were available from seven countries in the Region. The sources of information were surveys covering relatively small population groups. For the purpose of projection to the countries with no representative data, the data from the seven countries were used. it was estimated that the Region had about 40.9 million cases of diabetes [7]. For this estima- tion, the weighted average prevalence of the countries with available data was used. Two other approaches were also used.
IJSER © 2011 http://www.ijser.org
International Journal of Scientific & Engineering Research Volume 2, Issue 5, May-2011 2
ISSN 2229-5518
Table 1: Estimated prevalence of diabetes mellitus in SEAR,
1998
Region (Bangladesh, Bhutan, DPR Korea, India, Indonesia, Maldives, Myanmar, Nepal, Sri Lanka and Thailand) are undergoing significant social, economic and demographic changes. Most of the noncommunicable diseases (NCDs) are a part of the degenerative diseases group and have higher prevalence in the older population. In addition, many of the lifestyle risk factors for NCDs like improper nutrition, se- dentary life, alcohol and tobacco use are showing an up- ward trend in these countries. This has led to the emergence of NCDs as important causes of morbidity and mortality in the Region. In 1998 alone, NCDs are estimated to have con- tributed almost 60% of deaths in the world and accounted for 43% of the global burden of disease. Based on current trends, by 2020, these diseases are expected to account for
73% of deaths and 60% of the disease burden [7].
40
30
Communicable Diseases
20 Non-Communicable Diseases
Injuries
10
Source: Based on prevalence estimate derived from the above seven countries.
First, as the data showed that two countries in the Region have either high (Sri Lanka) or very low (DPR Korea) preva- lence, a revised estimate was made excluding these two countries, which came to 40.8 million. Secondly, the Indian prevalence estimate for the three countries from where data was not available, was used as it was felt that culturally and socio- demographically, India was the closest to these coun- tries. This gave an estimate of 41.0 million cases [7].
In the Diabetes Atlas 2000, published by the International Diabetes Federation (IDF), it was estimated that in 2000 (re- port of IDF includes India, Bangladesh, Mauritius and Sri Lanka in the SEA Region of IDF) an estimated 35 million cases of diabetes would be prevalent [7]. The differences are in the year of estimate and the countries included. If we take only India, Bangladesh and Sri Lanka (WHO/SEAR coun- tries included in the IDF report), then the comparison of the two estimates is shown in Table 2 below. Though the total estimate appears to be similar, the country specific estimates show a variation [7].
Table 2: Comparison of estimates of prevalence of diabetes mellitus of derived by IDF and the present report
Country | IDF | WHO SEARO |
Bangladesh | 1,759,700 | 2,700,000 |
India | 32,674,400 | 28,702,100 |
Sri Lanka | 335,400 | 1,250,000 |
Source: Diabetes Atlas 2000, International Diabetes Federation
The ten Member Countries of WHO’s South-East Asia
0
1985 1990 1995 2000 2005 2010 2015 2020 2025
Year
Fig. 1: Projected trends in the number of deaths by broad cause group in developing regions
The development of type-II diabetes is the result of a complex interaction between genetic and environmental factors and has been researched extensively in the scientific and medical literature [8]. The most common form of diabet- ic is type-II diabetic and this type of diabetic is most often associated with older age, obesity, physical inactivity, and ethnicities [9]. Obesity is a well-known risk factor for cardi- ovascular disease, including systemic hypertension, heart failure those in turn affect the blood glucose level. Obesity is a well-known risk factor for cardiovascular disease, includ- ing systemic hypertension, heart failure those in turn affect the blood glucose level [10].
Investigating the prevalence of type-II Diabetic Mellitus (DM), impaired glucose tolerance and the factors affecting blood glucoselevel, it has been found that the sex, hyperli- poidemia, hypertriglyceredemia and hypertension as inde- pendent factors for the abnormalities in glucose tolerance; whereas, BMI and per day insulin and tablet intake affect blood glucoselevel for the both sexes and for both tablet or insulin users [11]. It has also been revealed that aging, over- weight and a sedentary lifestyle are the important determi- nants in the prevalence of the diabetic during this transition period in Vietnam [12]. For non-insulin-dependent diabetic
mellitus (NIDDM), impaired glucose tolerance (IGT) and
IJSER © 2011 http://www.ijser.org
International Journal of Scientific & Engineering Research Volume 2, Issue 5, May-2011 3
ISSN 2229-5518
![]()
hyper tension in rural community of Bangladesh, increased age has been considered as an important risk factor for all disorder related to diabetic whereas BMI associated risk have been significant with NIDDM and hypertension [13,14].
The main aim of this paper is to assess different cova- riates affecting blood glucose level as well as to intensify their effect on blood glucose level through other implied factors.
Out of 84 diagnostic and pathologies [15], there are only two well recognized diabetic diagnostic centers named “Raj- shahi Diabetic Association and Diagnostic Center” at Lax- mipur and “Diabetic Welfare Center, Talaimary, Rajshahi” in Rajshahi city. Theses two diabetic centers have been con- sidered as our study areas. There are 5345 registered diabet- ic patients at both the diabetic diagnostic centers; out of them 3772 registered patients are in Rajshahi Diabetic Asso- ciation and Diagnostic Center and 1573 in Diabetic Welfare Center. We serially numbered all those registered diabetic patients from the two centers’ respective registered book and thereafter we selected 1069 diabetic patients through the process of linear systematic sampling procedure using the formula N=nk, where N=5348, n=1069 and k=5 [16]. Among
1069 patients there are 504 males and 565 females of whom
454 are tablet users and 615 insulin users.
Multiple Classification Analysis (MCA) requires one depen- dent variable and two or more independent variables. The dependent variable can be either a continuous or a categori- cal variable, but all the independent variables must be cate- gorical. MCA can equally handle the nominal and ordinal variables and can also deal with linear and non-linear rela- tionships of predictor variables with dependent variables. Mathematically, the model can be expressed by the follow- ing equation:![]()
Yijk = y + ai + bj + ck + - - - - - - - + eijk .
Where,
Yijk is the value or score of an individual who falls in the i th category of the factor A, j th category of the factor B and k th category of the factor C.![]()
y is the grand mean of Y.
ai is the effect due to the i th category of the factor A, which is equal to the difference between y and the mean of its category of factor A.
equal to the difference between y and the mean of its cate- gory of factor B.
ck is the effect due to the k th category of the factor C, which is equal to the difference between y and the mean of its category of factor C.
eijk is the error term related with Yijk score of the individals. The coefficients, which are estimated by solving the normal
equation systems, are called the adjusted or net effect of the
predictors. These effects measure those of the predictor alone after taking into account the effects of all other predic- tors. The unadjusted, eta-square (112) coefficient is a correla- tion ratio, which explains how well the predictor variable explains the variation in the dependent variables. Similarly, the beta-square (�2) coefficient indicates the proportion of variation explained by the other predictor variables.
The multiple classification analysis is undertaken first to evaluate the contribution of socio- demographic and the health related characteristics such as age, respondents’ edu- cation, occupation, Body Mass Index (BMI), calorie intake, injection intake, obesity, patients’ mental suppression, smoking habit and walking habit on the blood glucose level. In this case blood glucose level is taken to be the dependent variable and socio- demographic and health related va- riables as explanatory variables. All the socio- demographic variables are the categorical variables. The categories of the selected variables have been disclosed in the following table:
bj is the effect due to j th category of the factor B, which is
IJSER © 2011 http://www.ijser.org
International Journal of Scientific & Engineering Research Volume 2, Issue 5, May-2011 4
ISSN 2229-5518
0 = Don’t Take
1 =Take
![]()
Table 3: Variables and their Covariates used in the Multiple
Classification Analysis
![]()
There are a variety of socio-demographic and health re- lated factors that influence blood glucose level. To examine the differential patterns of mean level of the blood glucose among the patients, the well known Multiple Classification Analysis (MCA) has been employed. Table 2 shows the mean level of blood glucose of both unadjusted and ad- justed by different socio- demographic and diabetes related characteristics with the values of 112 and �2 produced from multiple classification analysis.
As we can found from Table 2 that the mean level of blood glucose (Adjusted) for the early, middle and the older aged persons are 13.16, 12.39 and 12.83 respectively [Table
2]. At the early age due to have a sedentary life style blood glucose level remains uncontrolled, which might lead some sort of vulnerability to the young diabetic patients. Again, the mean level of blood glucose has been found to be a bit higher for the older aged people than that of the middle aged people. This refers that with the increase of the age patients’ blood glucose is increased. This finding is sup- ported by other studies, where the prevalence of the type-II diabetes in urban slum of Dhaka, Bangladesh have been determined and it has been found that increasing age, sex, literacy and waist to hip ratio for men as significant risk fac- tors for increasing the blood glucose level [17].
Many researchers have found BMI as one of the most in- fluential factors affecting blood glucose level. Some other studies shows that the risk factors for increasing blood glu- cose level are age, BMI and parity which are all positively associated with the prevalence of the type-II diabetes [18]. From our study we have noticed that over weighted and obese people’s mean blood glucose level (Adjusted) are much higher (14.55 and 14.99 respectively) [Table 2] than that of the respondents with the normal weight (11.48) [Ta- ble 2].
Calorie intake per day is another important factor that often termed as the decider of the blood glucose level for the diabetes patients. Here, we could notice that the patients who used to follow the chart of medium and the high calorie have much lower mean level of blood glucose (12.52 and
13.32 respectively) [Table 2] than of those who don’t follow
any calorie chart referred by the physician from the diabetes
IJSER © 2011 http://www.ijser.org
International Journal of Scientific & Engineering Research Volume 2, Issue 5, May-2011 5
ISSN 2229-5518
book (15.54) [Table 2].
The respondents with the post graduation level of edu- cation are found with a lowest mean glucose level (11.15) [Table 2] than of the other educational category. This result focuses that with the advanced educational background a people comes to know with various knowledge regarding diabetes through various accessories through accessing with the latest news and views about the various invariable knowledge of the diabetes. So, education has its own part to play in developing the knowledge and awareness about diabetes.
The mean glucose level (Adjusted) for the respondents with the professional background is 12.59 [Table 2] which is a bit higher than those of the respondents who are non- professional (12.56) [Table 2]. This might happen due to the matter of less physical work and more mental suppression on the professional respondents who are more used to be involved with various types of official jobs where the maxi- mum part of the day have to be spent without doing any physical work as a result the weight gaining was ongoing that increase the blood glucose level. Type-II diabetes and the impaired fasting glucose (IFG) in the rural area of the Bangladesh had been investigated by the Sayeed and group and found that the prevalence of the diabetes and IFG in the rural population was increased, where, older ages, highest obesity and reduced physical activities proved significant risk factors for the diabetes and IFG [19].
Tension and the mental suppression play the pivotal role in increasing blood glucose level. From Table 2 we no- tice that the respondents whose blood glucose level increase at the time of being tensed are found to have the maximum mean blood glucose level (Adjusted) (13.0) [Table 2] com- paring to those whose blood glucose level is not influenced by the mental suppression (12.04) [Table 2]. Scientifically as we know that excessive tension or mental agony cause the pancreas to exert more insulin through urine that in turn cause the deficit of insulin which influence blood glucose level [19].
The respondents who are used to take tablet and insulin to control their blood glucose level are noticed to have more adjusted mean glucose level (14.82 for the insulin intake and
14.30 for the tablet intake) [Table 2] than of those who don’t control their blood glucose level through either of these process (10.65 and 10.63 for the tablet and insulin users re- spectively) [Table 2]. Here, more mean glucose level has been noticed for those who used to have the insulin as their medication of controlling diabetes.
Among 1,000 respondents the mean adjusted blood glu- cose level is high for the patients who have the high blood pressure (15.07) [Table 2] comparing to the mean adjusted blood glucose level to those of the respondents with normal blood pressure (10.55) [Table 2]. Here, from our study it has been found that the mean adjusted blood glucose level of the respondents who have regular walking habit is depicted as much lower (11.67) [Table 2] than of those who don’t have any habit to walk at a regular basis (13.08) [Table 2].
In this section an attempt has been made to observe the extent of influences of the variables on blood glucose level. Table 3 produces the results of zero order correlation coeffi- cients of blood glucose level with various socio- demograph- ic and health related characteristics. These variables have to affect blood glucose level through one or more proximate determinants.
Table 2 shows that respondents’ habit of taking insulin has a significant contribution on blood glucose level which has been noticed to have a positive association with blood glu- cose level. The correlation coefficient is found to be r = 0.343 [Table 3]. Among the included variables respondents’ insu- lin intake has the strongest influence on blood glucose level. The proportion of variance explained (unadjusted) by insu- lin intake is 112 = 0.335 [Table 2] and the proportion of va- riance explained (adjusted) by this variable is �2 =0.422 [Ta- ble 2]. The indirect effect of insulin intake through calorie intake, BMI, and walking distance on the blood glucose level are 0.010, 0.032 and 0.005 respectively.
Blood pressure of the respondents has a significant con- tribution on blood glucose level. Blood pressure has a posi- tive significant association (r= 0.046) with blood glucose level [Table 3]. Among the included variables, blood pres- sure has the second strongest influence on blood glucose level. The proportion of variance explained (unadjusted) by blood pressure was 112= 0.117 [Table 2] and the proportion of variance explained (adjusted) by this variable is �2 = 0.122 [Table 2]. The effect of blood pressure on blood glucose level through mental suppression, calories intake and the walking habit of the respondents is 0.003, 0.007, 0.00012 and 0.0046 respectively.
Mental tension has a positive significant association (r =
0.083) with blood glucose level [Table 3]. The strength of explaining variability (unadjusted) is 112= 0.083 [Table 2] and the strength of explaining variability (adjusted) is �2 = 0.119 [Table 2] which is the third most influential factors affected
IJSER © 2011 http://www.ijser.org
International Journal of Scientific & Engineering Research Volume 2, Issue 5, May-2011 6
ISSN 2229-5518
the blood glucose level. The indirect effect of mental sup- pression of the respondents suffering from the diabetes on blood glucose level through body mass index is 0.013 [Table
2] and through education and age are 0.013 and 0.0009 re- spectively on the blood glucose level.
Daily tablet intake of the patients also has a significant contribution on blood glucose level. The tablet intake of the respondents has the negative significant association (r= -
0.332) [Table 3] with blood glucose level. The proportion of variance explained (unadjusted) by tablet intake of the res- pondents is 112= 0.124 and the proportion of variance ex- plained (adjusted) by this variable is �2 = 0.324 [Table 2]. Tablet intake by the diabetes patients affects blood glucose level through body mass index, blood pressure, calories in- take and walking habit of the respondents with the value of
0.0096, 0.0043, 0.0026 and .0026 respectively.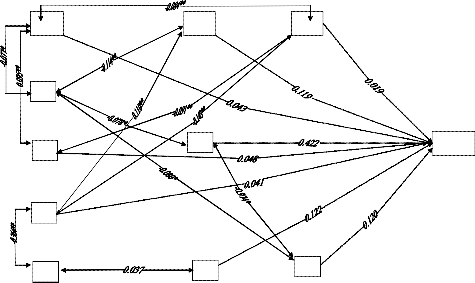
Calorie intake of the respondents has a vital role to con- trol the blood glucose level and has shown a considerable positive association with blood glucose level. The propor- tion of variance explained by the calorie intake is (unad- justed) 112= 0.054 and the proportion of variance explained (adjusted) by this variable is �2 = 0.048 [Table 2].
relative influence of the variables on blood glucose level. The model shows that there is a positive significant correla- tion between education and occupation, r = 0.364 [Table 3]. In addition, it can be mentioned that the educational qualifi- cation has the positive and significant association with the mental suppression, as we found from other study that the educated people are more likely to have high level of mental suppression [19]. Again, from the Table 3 we observe that education has the positive association (r=0.048) [Table 3] with the calorie intake and through the calorie intake educa- tion affect the blood glucose level that is the indirect effect of the education through calorie intake was 0.0019.
Walking habit of the respondents had four posterior fac- tors: age, calorie intake, occupation and BMI. The extent of correlation between walking habit and age is -0.084 [Table
3]. The result implies that as age increases the walking habit is reduced. For instance, in spite of having the desire, due to the physical inability an aged population couldn’t be able to walk at a regular basis for a long distance. So walking habit also affects blood glucose level through age with the indirect effect of 0.0015.
X1 X6
1 6
X2
X3 X7
X4
X5 X8
Table 4: Results of Multiple Classification Analysis
X MCA) Affecting Socio-Demographic Covariates on Blood
1100
Glucose level of Diabetic Patients in Rajshai City, Bangla- desh.
![]()
Fig.1: Decomposing and synthesizing the relative influences of different variables on blood glucose level of the diabetic patients.
Characteristics Unadjusted Adjusted 112 �2
![]()
Age
As there is no mechanical method for building a causal model (Srinivsan, 1981), it primarily depends on the subs- tantive reasoning of the cause effect relationship. With these
statistics, this part attempts to decompose and synthesize![]()
Early Age Middle Age Older Age
13.32
12.36
12.92
13.16
12.39
12.83
0.055 0.043
IJSER © 2011 http://www.ijser.org
International Journal of Scientific & Engineering Research Volume 2, Issue 5, May-2011 7
![]()
ISSN 2229-5518
![]()
Body Mass Index (BMI)
Under Weight
Normal Weight
Over Weight
0.039 0.016
Grand Mean
Proportion of Variance
![]()
Explained
12.55
0.367
![]()
Obesity
Calorie Intake
1. Don’t follow the calorie
Chart
2. Follow the Medium
Calorie Chart
![]()
3. Follow the High Calo- rie Chart
Educational Qualifica- tion
1. Illiterate
2. Primary Level of Edu- cation
3. Secondary Level of
Education
Higher. 4. Second- ary Level of Education
5. Graduate Level of Edu- cation
6. Post Graduate Level of
![]()
Education
Occupation
15.14
12.49
13.80
12.44
12.48
12.73
12.21
13.21
11.01
15.54
12.52
13.32
12.49
12.47
12.65
12.77
12.99
11.15
0.054 0.048
0.061 0.041
The correlation between walking habit and calorie intake shows an insignificant association (r= -0.091) [Table 3]. This implies that the respondents who are used to take high calo- rie are not used to walk at a regular basis that leads them to the obesity which in turn affects the blood glucose level [20]. So it is clear that walking habit also affects blood glucose level through calorie intake and this time the indirect effect through calorie intake is 0.0017. The more professional per- sonnel have to occupy their most of the time doing many official works that don’t allow them to walk at a sufficient rate of time and distance. So walking habit also affects blood glucose level through occupation as well. The association between the walking habits and occupation is 0.143 [Table 3] and has the significant association. The indirect effect of walking habit through occupation is 0.0027. The correlation between the walking habit and the BMI is-0.016 [Table 3] that reveals that the respondents who have the less regular habit of walking are more likely to have more BMI that pro- duce the risk of gripping by the diabetes [21]. Here, in this case the negative effect of the walking habit through BMI is
0.0003. According to some other study, diabetes is asso- ciated with the age, BMI, blood pressure, HDL, cholesterol, education levels, and the family history [21].
Professional
NonProfessional
12.56
12.48
12.59
12.56
0.007 0.004
Y X1 X2 X3 X4 X5 X6 X7 X8 X9 X10
![]()
0.014
Sugar Level increased with Mental Suppres- sion
12.04
12.96
11.99
13.00
![]()
Y 1 0.024
0.083 0.119 X1 1
0.056 0.013 0.066 0.083** 0.343** 0.046** -0.023 0.332**
**
0.077 0.095
0.046 0.011 0.008 0.013 0.010 -0.084** 0.008
* **
No
![]()
Yes
Insulin Intake
X2 1 0.044 0.046 0.024 0.114** 0.078** 0.062 0.016 0.080** X3 1 0.048 0.048 0.027 0.024 0.001 -0.091** -0.022
0.364*
Don’t take
![]()
Take
10.63
14.35
10.13
14.82
0.335 0.422
X4 1
0.110** 0.030 0.037 0.026 0.022
*
Normal High Low
Blood Pressure
![]()
Walkin g Habit
10.03
14.88
11.88
10.55
15.07
12.04
0.117 0.122
X5 1 0.21** 0.011 0.037 0.143** 0.036
X6 1 0.075 0.025 -0.037 0.002
X7 1 0.033 -0.012 0.974** X8 1 -0.038 0.036
X9 1 -0.022
Don’t have regular Walk-
ing habit
Having regular Walking habit
12.89
11.43
13.08
11.67
0.022 0.019
X1
1
0
![]()
In our study the correlation between the age and blood
glucose level is 0.004 [Table 3] that implies that as age in-
Tablet Intake
![]()
crease the blood glucose level is more likely to increase. Again age of the respondents has three posterior factors: BMI, calorie intake and the walking distance. The correla- tion between age and BMI of the patients is observed to be
significant (r = 0.077) [Table 3] which implies that with the
IJSER © 2011 http://www.ijser.org
International Journal of Scientific & Engineering Research Volume 2, Issue 5, May-2011 8
ISSN 2229-5518
increase of age the BMI decrease. So age affects blood glu- cose level through BMI. The indirect effect of age through BMI was 0.035. Age also affects blood glucose level through calorie intake and walking distance. We have found that there is a significant and positive association between the age and calorie intake (r= 0.095) [Table 3], that refers that with the increase of age patients of our study take more ca- lorie and in previous we have detected that with the in- crease of age the patients are less used to walk at a regular basis, so, more calorie consumption and less walking habit always create a huge risk to the prevalence of obesity that is the most influencing and effective factor in the prevalence of diabetes [22]. The effect of the age through calorie intake was 0.0036.
Again, the correlation between BMI and mental pressure and BMI and blood pressure are 0.114 and 0.062 respectively [Table 3], where, the association between the BMI and men- tal suppression has the significant association. This result implies that with the increase of BMI both the mental sup- pression and blood pressure both are increased. Here, the negative effect of the BMI and the blood pressure on the blood glucose level are 0.0018 and 0.0009 respectively.
Education and mental suppression have a significant positive association (r=0.110) [Table 3]. This refers that with the advanced educational background people become more likely to grippe by the tension which is one of the most ef- fective factor in the prevalence of the diabetes. Other study has reported as BMI associated risk of the diabetes was sig- nificant with NIDDM and hypertension [22]. The education has the negative effect on the blood glucose level through mental tension and BMI of 0.00451 and 0.0018 respectively.
Insulin and Tablet intake and Blood pressure of the patients are most important influential factors that affect blood glu- cose level. As we can observe that mental tension has a posi- tive and significant association with blood glucose level. we also have find that the early aged patients’ mean blood glu- cose (Adjusted) is much higher than that of the older aged people and the patients who don’t follow the calorie chart at all have the highest mean blood glucose level than of those who follow the medium and high calorie chart from their diabetes book. Multiple Classification Analysis (MCA) re- sults deserve considerations from the viewpoint of policy implication. So, we could say that the early and middle aged population should be more and more conscious about controlling their weight and the older aged patients should
maintain their blood glucose through dieting and doing
physical work as well and also they should take care of their calorie intake to keep themselves in safer zone.
[1] C. Snehalatha, A. Kapur, and V. Vijay, J. Assoc. Physicians
India 51, 766 (2001).
[2] H. G. Allen, J. C. Allen, L. C. Boyd, and B. P. Alston-Mills
Can, Nutrition 19, 584 (2003).
[3] N. D. Kim, K. T. Mary, L. Karen, C. Gary, M. Neil, and Gsc.
D. Francine, Obstet Gynecol. 194, 339 (2005).
[4] Diabetes - A brief historical aspect; A Handbook of Di-
abetes Mellitus, New Mediwave Publication –LUPN 45 (2001).
[5] A. Bener, M. Zirie, and A. Al-Rikabi, Genetics, obesity, and environmental risk factors associated with type-II diabetic, Croat Med. J., 46, 302-307 (2005).
[6] World Health Organization, World Diabetic: A News Let- ter, 3 (2002)
[7] World Health Organization, Regional Office for South East
Asia, New Delhi, 2002.
[8] J. Lopatynski, G. Mardarowicz, and G. Szczesniak, A com-
parative evaluation of waist circumference, waist-to-hip ra- tio, waist-to-height ratio and body mass index as indicator of impaired glucose tolerance and as risk factors for type-II. Ann. Univ. Mariae curie Skildowska, 58, 413-419 (2003).
[9] A. M. Habori, A. M. Mamari and A. A. Meeri, Diabetic Res.
Clin. Pract. 65, 275 (2004).
[10] N. D. Kim, K. T. Karen, C. Gary, M. Neil and Gs. D. Fran- cine, Am. J. Obset. Gynecol. 194, 339 (2006).
[11] L. N. Duc Son, T. T. Hanh, K. Kusama, D. Kunni, T. Sakai, N. T. Hung, and S. Yamamoto, J. Am. Coll Nutr. 24, 229 (2008).
[12] C. G. Sonomon, F. B. Hu, A. Dunaif, J. Rich-Edwards, W. C.
Willett, D. J. Hunter, G. A. Colditz, F. E. Speizer, and J. E.
Manson, JAMA 286, 2421 (2004).
[13] M. A. Sayeed, A. Banu, A. R. Khan, and M. Z. Hussain,
Diabetic Care 18, 555 (1995).
[14] H. King, R. E. Aubert, and W. H. Herman, Diabetic Care 16,
157 (1998).
[15] Register book of Rajshahi Civil Surgeon Office, June 2008 [16] Daroga Singh, and F. S. Chaudhary, The Theory and Anal-
ysis of Sample Survey Designs, 3rd Ediation (New Age In- ternatioal (P) Limited, New Delhi, 1997).
[17] M. A. Rahim, S. Vaaler, S. M. Keramat Ali, A. K. Khan, A.
Hussain, and Q. Nahar, Prevalence of type-II diabetic in urban slums of Dhaka, Bangladesh, Bangladesh Med. Res. Counc. Bull., 20, 60-70 (2004).
[18] C. Snehalatha, A. Ramachandran, A. Kapur, and V. Vijay, Age-specific prevalence and risk associations for impaired glucose tolerance in urban southern Indian population, J. Assoc, Physicians India, 51, 766-769 (2003).
[19] M. A. Sayeed, M. Hajera, A. K. Parvin, A. L. Zafar, S. M. A.
Keramat, B. Akhtar, B. Ahren, and A. K. Azad, Diabetic and impaired fasting glycemia in rural population of Ban- gladesh, Diabetic Care, 26, 1034-1039 (2003).
[20] T. Saito, Y. Shimazaki, Y. Kiyohara, I. Kato, M. Kubo, M.
Iida and Y. Yamasita, J. Periodontal Res. 40, 346 (2005).
IJSER © 2011 http://www.ijser.org
International Journal of Scientific & Engineering Research Volume 2, Issue 5, May-2011 9
ISSN 2229-5518
[21] C. G. Sonomon, A. Dunaif, J. Rich-Edward, W. C. Willett, D. J. Hunter, G. A. Colditz, F. E. Speizer and J. E. Manson, J. A.M. A. 286, 2421 (2001).
[22] H. G. Allen, J. C. Allen, L. C. Boyd and B. P. Alston-Mills,
Nutrition 19, 584 (2003).
IJSER <S> 2011