International Journal of Scientific & Engineering Research, Volume 5, Issue 1, January-2014 62
ISSN 2229-5518
Effect of temperature, pH, and solids concentration on biogas production from poultry waste
1I.S.,Ogiehor, and 2*U.J.,Ovueni,
Abstract-Anaerobic digestion of organic waste yields biogas as one of its bi-products, containing methane; a gas that has become popular in the search for alternative sources of energy. The efficiency of the anaerobic process is governed by a number of factors. The effect of temperature, pH, and solids concentration on production of biogas from organic waste (poultry waste) was investigated for a period of 14 days, using laboratory scale digesters constructed from 2L plastic containers. The feedstock consisted of poultry waste made into slurry of four solids concentrations (SC); 10%, 15%, 20%, and 25%. The starting hydrogen ion concentrations (pH) of the slurries used in the study were, 5,6,7,8, and 9. Two digestion temperatures; 30 and 35oC were used during this investigation. The result of the anaerobic digestion indicate that slurries with starting pH 5, recorded highest cumulative gas yield of 3650ml for slurry with 15% SC, digested at 30 oC. Slurries with pH 6 recorded highest cumulative gas yield of 2880ml for slurry with 20% SC, digested at 35oC. Slurries with pH 7 had 3945ml highest cumulative gas yield observed in slurry with 15% SC, digested at 35oC. Highest cumulative gas yields for pH 8 and 9 were 4635ml and 4730ml respectively, recorded for slurries with 25% SC digested at 35oC. For both digestion temperatures, gas yield tend to increase with solids concentration, however, highest gas yield was observed at 35oC, and slurries with starting pH of 7 gave relatively consistent high gas yields.
Keywords: Anaerobic digestion, Biogas, Digester, Slurry, Solids Concentration
Biogas is a product of anaerobic digestion of biodegradable materials. It is composed of methane (45-65%), carbon dioxide (35-45%), nitrogen (0-3%), hydrogen (0-1%), and 0
- 1% hydrogen sulfide (Kangmin, 2006). Millions of cubic meters of biogas are being produce yearly by the decomposition of organic matter both of plant and animal origin. In Nigeria, as at 2001, the estimate of waste generated by cattle, poultry and piggery was put at 1.3, 6.4, and 5.2 million metric tons daily, respectively. These have an estimated gas generation value of 3.27, 0.01, and 0.21 million cubic meters of biogas respectively (Itodo, et al
1994). As at 2007, animal and agricultural wastes in Nigeria stood at 0.781 and 0.256 million tons per day respectively (Sambo, 2007). Dioha (2009) posited that from animal waste alone, Nigeria can generate 4.75 x 10⁹ MJ per annum. This which is expected to rise depict that large
proportion of the country’s energy mix can be sourced from biogas. It has also been reported that an average Nigerian generates about 0.48kg of municipal solid waste daily (Ugwuh, 2009). Ovueni (2010) projected the municipal solid waste generation in Nigeria to reach 58 million tons daily by
2050. In spite of this great potential in energy generation,
Nigeria has not being able to harness this alternative source of energy adequately. This may be attributed to the numerous variety of energy sources in the country, as well as dearth of adequate study of the optimum conditions required for maximum gas production from waste. This work, seeks therefore to evaluate the effect of solids concentration, temperature, and hydrogen ion concentration (pH) on biogas production from poultry waste, with a view to
establishing an optimum condition with regards to these factors for biogas generation from poultry waste.
Poultry waste used in this study was obtained from Emoshioremhe poultry farm Aviele, Auchi Edo State, in southern Nigeria. The waste, consisting of poultry liter, manure, spilled feed, and some soil particles, were collected in sterile polyethylene bags adopting standard procedures, and transported immediately to the laboratory.
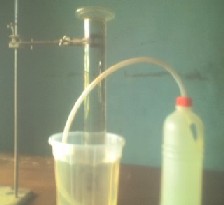
Laboratory scale batch digesters were used made from 2 liter plastic containers. A hole (0.8cm in diameter) was made at the center of the cover of each plastic container. Rubber hose of length 12cm and diameter 1.5cm was inserted into the hole and glued using araldite adhesive (Zuru et al, 2004). The hose served as the gas conduit leading into a measuring cylinder (1000ml), filled with water, inverted and immersed in water in a small plastic bucket. The cylinder was held in place with a clamp and stand. In this way the gas was collected by water displacement (Zuru et al, 2004).
IJSER © 2014 http://www.ijser.org
International Journal of Scientific & Engineering Research, Volume 5, Issue 1, January-2014 63
ISSN 2229-5518
Biogas produced was collected over water. The volume of water displaced was recorded as volume of gas produced (Audu et al, 2003).
The pH values of the influent (slurry before digestion) and effluent (slurry after digestion) were determined with aid of a digital pH meter (Model ISTR1/08) after standardization with buffer at pH 4 (Itodo and Awulu, 1999).
For each solids concentration under study (10, 15, 20, and
25% ), influent were made using each pH under
investigation; 5, 6, 7, 8, and 9. These were digested at
30oC. Similarly, another set up was prepared which was digested at 35oC. All set ups were made in duplicate.
The influent used for the digestion was constituted using the solids concentrations; 10, 15, 20, and 25 percent total solids (Itodo and Awulu, 1999). This was done following the method adopted by Igoni, Abowei,Ayotamuno, and Eze, (2008). Moisture content was by oven drying to constant weight at 105o
PTS = 100 – PMC
Where PTS – percentage total solids, and
PMC – percentage moisture content.
The digestion was carried out in the laboratory using thermostatically controlled water bath (model DK-420) at temperatures 30 ± 1oC and 35 ± 1oC (Uzodinma et al,
2007).
SC 10 pH5 pH9 pH8
SC 15Ph5 pH7
SC 20pH5 pH6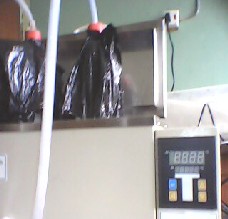
SC 25pH5
pH6
Figure 2:Digester set up in water bath
IJSER © 2014 http://www.ijser.org
International Journal of Scientific & Engineering Research, Volume 5, Issue 1, January-2014 64
ISSN 2229-5518
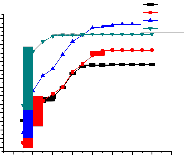
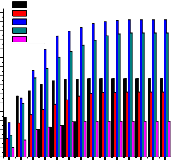
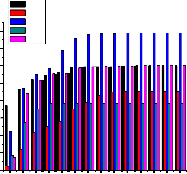
The result of the 14-day anaerobic digestion, as depicted in figure 4-8 shows biogas production occuring 24 hours after charging the digesters. This corroborates the findings of Uzodinma et al (2007) who reported gas production commencing within 24 hours post charging period. Biogas yields for the set ups, mostly peaked within the first 3 days of digestion. Gas production began to drop from day 4 for most of the set ups with most of the set ups stopping production at day 6. Vindis et al, (2009) reported that most of the biogas production occurs in the first week of digestion. Biogas production from slurry (PTS 15%) digested at 30 ±
1oC with a starting pH of 5 (figures 4a & b) showed
higher gas yield compared with slurry digested at
35oC of same SC.
3000
2800
2600
2400
2200
2000
1800
1600
1400
1200
1000
800
600
400
200
10% SC
15% SC
20% SC
25% SC
0 2 4 6 8 10 12 14 16
Time (Days)
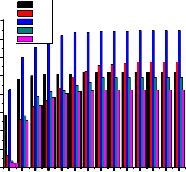
Figure 5a: Biogas production from poultry waste digested at 30oC using different SC
and a starting pH of 6
3800
3600
3400
3200
10% sc
15% sc
20% sc
25% sc
3000
SC 10% SC 15%
3000
2800
2600
2400
2200
2000
1800
1600
1400
1200
1000
800
2800
2600
2400
2200
2000
1800
1600
1400
1200
1000
800
SC 20% SC 25%
0 2 4 6 8 10 12 14 16
Time (Days)
Figure 4a: Biogas production from poultry waste
600
400
200
0
0 2 4 6 8 10 12 14 16
Time (Days)
digested at 30oC using different SC and a starting pH of 5
Figure 5b: Biogas production from poultry waste digested at 35oC using different SC
and a starting pH of 6
3000
2500
2000
1500
1000
500
0
SC 10% SC 15% SC 20% SC 25%
0 2 4 6 8 10 12 14 16
Time (Days)
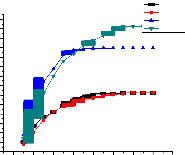
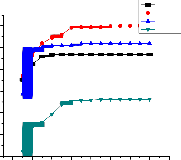
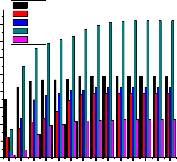
Generally, for both digestion temperatures, there seem to be an increase in gas production as solids concentration increase, with a drop in gas production at 25% SC. Figures 5a & b show biogas production from slurry with a starting pH of 6. Highest cumulative gas yield of 2850ml was observed with slurry of 25% SC, digested at 30oC. Gas production also seems to increase with SC, moving from 10% to 25%. Highest gas yield of
2880ml observed in slurry with a starting pH of 6
occurred in that with SC 20% digested at 35oC.
Figure 4b: Biogas production from poultry
digested at 35oC using different SC and a starting pH of 5
IJSER © 2014 http://www.ijser.org
International Journal of Scientific & Engineering Research, Volume 5, Issue 1, January-2014 65
ISSN 2229-5518
4000
3500
3000
2500
10% SC
15% SC
20% SC
25% SC
3000
2500
10% SC
15% SC
20% SC
25% SC
2000
2000
1500
1500
1000
1000
500
0 2 4 6 8 10 12 14 16
Time (Days)
500
0 2 4 6 8 10 12 14 16
Time (Days)
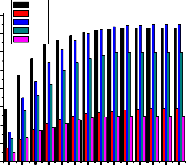
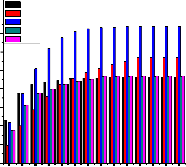
Figure 6a: Biogas production from poultry waste
digested at 30oC, using different SC
and a starting pH of 7
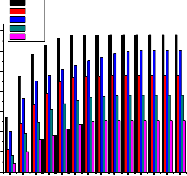
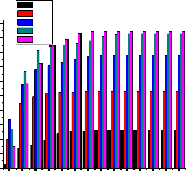
Figure 7a: Biogas production from poultry waste digested at 30oC using different SC
and a starting pH of 8
SC 10% SC 15%
5000
4500
SC 10% SC 15% SC 20% SC 25%
4000
IJSC 20% SER
3500
SC 25%
4000
3500
3000
2500
2000
1500
3000
2500
2000
1500
1000
1000
500
0
0 2 4 6 8 10 12 14 16
Time (Days)
500
0
0 2 4 6 8 10 12 14 16
Time (Days)
Figure 6b: Biogas production from poultry waste digested at 35oC, using different SC
and a starting pH of 7
Figure 7b: Biogas production from poultry waste
digested at 35oC using different SC
and a starting pH of 8
IJSER © 2014 http://www.ijser.org
International Journal of Scientific & Engineering Research, Volume 5, Issue 1, January-2014 66
ISSN 2229-5518
2000
1500
1000
500
0
10% SC
15% SC
20% SC
25% SC
0 2 4 6 8 10 12 14 16
Time (Days)
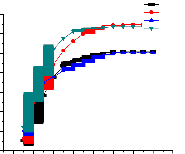
influent concentration to a maximum value. Igoni et al (2008) noted that the volume of biogas produced is a power function of the percentage total solids concentration. For batch systems, this relationship shows that a marginal increase in the percentage total solids results in a geometric increase in the volume of biogas produced (Igoni et al, 2007). The result also correlates with the findings of Lijuan, Yaunyuan, Chem and Ronghon, 2009, who studied biogas production at 6, 9, and 12% SC and reported highest gas yield at 12% SC. This trend may be attributed to the fact that with increased SC, there is a concomitant increase in substrate (organic matter) and microbial flora, a consortium of which are required for biodegradation to occur (Richard, 1984). Itodo and Awulu, (1999), however reported an increase in gas yields as total solids decreased from 20% to 5%.
Figure 8a:Biogas production from poultry waste digested at 30oC using different SC
and a starting pH of 9
SC 10% SC 15%
3200
3000
2800
2600
2400
2200
2000
1800
pH 5 pH 6 pH 7 pH 8 pH 9
IJSER
5000
4000
3000
2000
1000
SC 20%
SC 25%
1600
1400
1200
1000
800
600
400
200
0
1 2 3 4 5 6 7 8 9 10 11 12 13 14
Time (Days)
Figure 9a : Biogas production From Pw with
0 10% SC, digested at 30oC, at pHs’ 5, 6, 7, 8, & 9
0 2 4 6 8 10 12 14 16
Time (Days)
Figure 8b: Biogas production from poultry waste digested at 35oC using different SC
and a starting pH of 9
Biogas production from slurry with a starting pH of
7 digested at 30oC and 35oC are shown in figures
6a & b respectively. Under this pH increased gas production was observed at 35oC, with the highest output occurring at 15% SC, having a cumulative gas production of 3945ml. Biogas yield here also showed an increase with PTS. Figures 7a & b
4000
3500
3000
2500
2000
1500
1000
500
0
pH 5 pH 6 pH 7 pH 8 pH 9
1 2 3 4 5 6 7 8 9 10 11 12 13 14
Time (Days)
shows the result of biogas production from slurry with a starting pH of 8. Higher gas yield was also observed at 35oC. The highest cumulative gas yield of 4635ml was produced by slurry with 25% SC. Results for the digestion of slurries with starting pH 9 are shown in figures 8a & b. For both digestion temperatures slurry with 25% SC gave highest cumulative gas yields of 2110ml and
4730ml respectively. Biogas yield also increased with increasing PTS. This general trend is consistent with the findings of Webb and Freda (2006) who reported an initial rise in gas yields with
Figure 9b : Biogas production From Pw with
10% SC, digested at 35oC, at pHs’ 5, 6, 7, 8, & 9
IJSER © 2014 http://www.ijser.org
International Journal of Scientific & Engineering Research, Volume 5, Issue 1, January-2014 67
ISSN 2229-5518
4000
3500
3000
2500
2000
1500
1000
pH 5 pH 6 pH 7 pH 8 pH 9
3500
3000
2500
2000
1500
1000
pH 5 pH 6 pH 7 pH 8 pH 9
500
500
0
1 2 3 4 5 6 7 8 9 10 11 12 13 14
Time (Days)
0
1 2 3 4 5 6 7 8 9 10 11 12 13 14
Time (Days)
Figure 10a : Biogas production From Pw with
15% SC, digested at 30oC, at pH 5, 6, 7, 8, & 9
Figure 11a: Biogas production From Pw with
20% SC, digested at 30oC, at pH 5, 6, 7, 8, & 9
4000
3500
3000
pH 5 pH 6 pH 7 pH 8 pH 9
4000
3500
3000
2500
2000
1500
pH 5 pH 6 pH 7 pH 8 pH 9
2500
IJSER1000
2000
1500
1000
500
500
0
1 2 3 4 5 6 7 8 9 10 11 12 13 14
Time (Days)
0
1 2 3 4 5 6 7 8 9 10 11 12 13 14
Time (Days)
Figure 11b: Biogas production From Pw with
20% SC, digested at 35oC, at pH 5, 6, 7, 8, & 9
Figure 10b : Biogas production From Pw with
15% SC, digested at 35oC, at pH 5, 6, 7, 8, & 9
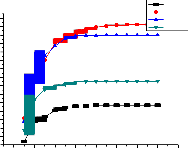
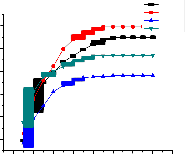
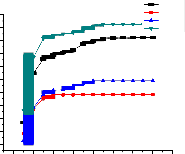
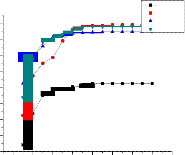
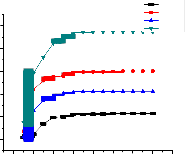
Figures 9, 10, 11 and 12 reviews the results under the various PTS used in the digestion; displaying the gas yields under the various hydrogen ion concentrations used for the digestion. In figure 9a, an increase in gas yield is observed as pH increases from 5 to 7 before a gradual decrease, depicting a better gas production at pH 7. In 9b, better gas yields were observed at pH 8, with a sharp drop in gas production at pH 9. Under this SC (10%), highest cumulative gas yield of 4110ml occurred at pH 8 digested at 35oC. In figure 10a, a
3500
3000
2500
2000
1500
1000
500
0
pH 5 pH 6 pH 7 pH 8 pH 9
1 2 3 4 5 6 7 8 9 10 11 12 13 14
Time (Days)
decrease in gas production was observed as pH
increased from 5 to 7, while in 10b, biogas yield increased with increasing pH, peaking at pH 7. Under this PTS, highest gas yield occurred at pH 7 digested at 35oC, with a cumulative gas yield of
3945ml. Result of gas production under 20% SC shown in figure 11a indicate a decrease in gas yield with increasing pH. Digestion at 35oC, however showed increase in gas production with increase in pH, having the highest gas yield of
3730ml at pH 7.
Figure 12a: Biogas production From Pw with
25% SC, digested at 30oC, at pH 5, 6, 7, 8, & 9
IJSER © 2014 http://www.ijser.org
International Journal of Scientific & Engineering Research, Volume 5, Issue 1, January-2014 68
ISSN 2229-5518
pH 5 pH 6
volume of 4730ml. On the average better gas
o
5000
pH 7
yields occurred at 35
C and at pH 7. Higher biogas
4500
4000
3500
3000
2500
2000
1500
1000
500
0
pH 8 pH 9
1 2 3 4 5 6 7 8 9 10 11 12 13 14
Time (Days)
yields observed with digestion at 35oC is in agreement with earlier studies, were it was
observed that ambient temperature degradation is extremely slow (Vindis, et al, 2009). Uzodinma et al (2007) reported that at 35oC there was higher biogas yield as a result of higher rate of biodegradation. This is also in correlation with the work of Huan et al (1982). Gollakota and Meher (1988) assessing the effect of particle size, temperature, and loading rate on biogas production reported that for all loading rates used, higher gas yields were observed at 37oC than at 30oC. The
Figure 12b : Biogas production From Pw with
25% SC, digested at 35oC, at pH 5, 6, 7, 8, & 9
two types of bacteria actively involved in the anaerobic digestion operate at three different temperatures; psychrophilic or ambient (< 25oC), mesophilic (25 – 40oC), and thermophilic; 45 –
60oC (Uzodinma et al, 2007). During digestion at psychrophilic or ambient temperatures, the
methanogens are not sufficiently activated for
enhanced biogas production. This will consequently lead to low biodegradation of the organic waste and poor gas yield (Uzodinma et al,
2007).![]()
Table 1:pH of slurry taken at the end Iof digestioJn and cumulativeSgas yields ER
![]()
Solids Starting pH pH at the end pH at the end cumulative gas yields (ml) Concentration(%) of digestion (30oC) of digestion (35oC) 30oC 35oC
10 | 5.00 | 6.60±0.02 | 6.62±0.09 | 1740 | 2435 |
15 | 5.00 | 6.61±0.03 | 6.64±0.2 | 3650 | 3000 |
20 | 5.00 | 6.67±0.15 | 6.82±0.01 | 3400 | 2600 |
25 | 5.00 | 6.84±0.06 | 6.90±0.09 | 2310 | 1315 |
10 | 6.00 | 6.72±0.09 | 6.81±0.08 | 1440 | 1930 |
15 | 6.00 | 6.83±0.11 | 6.94±0.11 | 1450 | 2270 |
20 | 6.00 | 6.91±0.15 | 7.06±0.17 | 2390 | 2880 |
25 | 6.00 | 7.02±0.13 | 7.15±0.11 | 2850 | 2645 |
10 | 7.00 | 6.84±0.1 | 6.74±0.04 | 3040 | 2115 |
15 | 7.00 | 6.94±0.22 | 6.72±0.13 | 3740 | 3945 |
20 | 7.00 | 6.96±0.13 | 6.83±0.11 | 3720 | 3730 |
25 | 7.00 | 7.10±0.23 | 6.87±0.02 | 3680 | 3895 |
10 | 8.00 | 7.07±0.14 | 6.93±0.02 | 2750 | 4110 |
15 | 8.00 | 7.12±0.13 | 6.81±0.09 | 2980 | 1920 |
20 | 8.00 | 7.09±0.11 | 7.20±0.11 | 1910 | 2450 |
25 | 8.00 | 7.15±0.11 | 7.26±0.13 | 2350 | 4635 |
10 | 9.00 | 7.03±0.09 | 7.12±0.09 | 790 | 1160 |
15 | 9.00 | 7.14±0.13 | 7.01±0.1 | 1240 | 3010 |
20 | 9.00 | 7.13±0.06 | 7.07±0.1 | 1270 | 2125 |
25 | 9.00 | 7.18±0.08 | 7.18±0.06 | 2110 | 4730 |
![]()
pH results are mean of duplicate determinations ± standard deviation
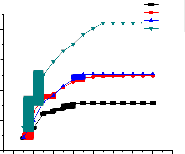
The biogas yields from poultry waste with 25% TS
digested at 30oC and 35oC as shown in figure 12a
& b respectively indicated an increase as pH
increases, peaking at pH 7 in slurry digested at
30oC and pH 9 in slurry digested at 35oC. Highest gas yield occurred at 35oC with a cumulative
Generally, higher gas yields were observed with
influents with a starting pH of 7. Habmigern (2003)
noted that anaerobic digestion will occur best within a pH range of 6.8 – 8.0. More acidic or basic mixtures will ferment at lower rate. The acidic pH recorded for all the effluents at the end of digestion (table 1) could be attributed to rapid accumulation of free fatty acids, which usually occur at the stoppage of gas production (Uzodinma, 2007).
The result denotes that temperature, pH, and solids concentration affect the biogas yield in an anaerobic digestion. The composite effect of temperature, pH, and solids concentration on biogas yield was most efficient at 35oC, pH 7, and
25% SC. It is not clear if the acidic pH at the end of digestion is an indication of inhibition of methanogenic activities. Further studies on the maintenance of steady pH, before and during digestion would be needed to ascertain the full effect of neutral pH on the overall gas yield
IJSER © 2014 http://www.ijser.org
International Journal of Scientific & Engineering Research, Volume 5, Issue 1, January-2014 69
ISSN 2229-5518
T.O.K Audu,., and E.O.Eyawo, “ Biogas from municipal solid waste”.
Nigerian journal of environmental management.
4 (1): 26 – 30, 2003.
K.G Gollakota, and K.K.Meher,” Effect of particle size, temperature loading rates and stirring on biogas production from castor cake”. ScienceDirect: Biological Wastes, Vol. 24 Issue 4, Pp243-249 1988
HABMIGERN.”The methane digester for biogas production”
http//www.habmigern.2003.info/biogas/methanedigester.html
J.J.K Huan, J.C.H Shih and Steimberger” Poultry waste digester from the laboratory to the farm”. In: Energy Conservation and Use of Renewable Energy in Bio Industry. Vogt (Ed) Pergamon Press UK pps
371-382, 1982
H.A Igoni., M.F.N Abower, M.J Ayotamuno and C.L Eze “Effect of total solids concentration of municipal solid waste on the biogas produced in an anaerobic continuous digester. Agricultural Engineering
international: the C IGR Ejournal. Manuscript EE 07 010.vol x 2008
.
I.N.Itodo, , and J.O Awulu,..” Effects of total solids concentration of
poultry, cattle and piggery waste slurries on biogas yield”. American
Society of Agricultural and Biological Engineers. Vol. 42(6): 1853-1856,
1999
L Kagmin, “Biogas China”. ISIS Report. 10th October, 2006.
http//www.i-isis.org.uk
U. J Ovueni Y. O Sadoh, E. A Okorejior and O Alebu “Population Growth Rate and W aste Management Challenges in a developing econom”. International Journal of Hospitality, Leisure and Tourism. Vol. 2 No. 1, pps 231-242, 2010
M Richard. “Understanding biogas generation” Technical paper number 4, free online publication. A 3rd W orld Development Private Sector Initiative. Voluteers Technical assistance Construction Manual (VITA). 1984
A.S Sambo, “Renewable energy development in Nigeria: A situation report. A” keynote address presented at the International W orkshop on Renewable Energy for sustainable Development in Africa, IW RESDA
30th july to 1st August, 2007.
U. S Ugwuh, “The State of Solid W aste Management in Nigeria”.
Waste Management Vol. 29, pp 2787-2790, 2009
E.O.U Uzodinma, A.U Ofoefule and N.D Onwuka “Optimum mesophilic temperature of biogas production from blends of agro-based waste”. Trends Applied Sci. Res., 2: 39-44, 2007
P Vindis, B Mursec, M Janzekovic and F Cus,” The impact of mesophilic and thermophilic anaerobic digestion on biogas production” Journal of Achievements in Material and Manufacturing
Engineering, Vol. 38 issue 2 Pp 192-198, 2009
IJSER © 2014 http://www.ijser.org