Comparative Analysis of Ecological Footprint of Two Different Neighbourhoods in Minna, Ni- geria
ABD’RAZACK, Nelson T.A and Ahmad Nazri bin MUHAMAD LUDIN
Abstract— This paper discusses the comparative analysis of Ecological Footprint of two different neighbourhoods in Minna: M.I Wushisi and Tunga Low-Cost estate. It considers the building design, types, consumption pattern, lifestyle, and land-use in the- se estates. One prominent way of curbing sprawl is the design of eco-village that encourages human-scale settlement that en- compasses social interaction, environmental sustainability and low-impact lifestyle. Globalization has been seen as a factor that determine environmental and social problem in the society. The method employed in this study makes use of both primary and secondary data to analyse and present the analysis in tabular form to show the relationship of different consumption that con- tributes to Ecological Footprint of these estates. There was the use of questionnaire for data collection, and a total of 360 and 370 questionnaired administered in both estates. The result indicated that the Ecological Footprint of Tunga Low-Cost (0.94gha) is lower than M.I Wushishi (0.98gha) due to building type, household size and lifestyle. Thus, this implies that the urban planners and designer has to be abreast of necessary information that will allow them to design a city that will be sustainable and consid- er consumption and lifestyle of the inhabitants of such city or neighbourhood. In addition, the study illustrates that Ecological Footprint could play a useful role in conducting such assessments, by documenting some of the behaviours that are most crucial to a person’s total environmental impact and how they are related to design and building form.
Keywords— Consumption, Ecological Footprint, Land-use, Lifestyle, Neighbourhood, Resources, Sustainability
—————————— ——————————
1 INTRODUCTION
here is significant relationship between building design and community development in terms of social, economic and environmental impact on the inhabitants of such
communities[19]. There is a lot of criticism against urban sprawl that engulf Rural Urban Fringe (RUF) in its develop- ment [4, 2]. There are a lot of problems associated with urban sprawl such as high cost of urban services due to distance, high level of segregation and lack of social cohesion among residents and poor environmental management in the fringe. These have diverse effects on Ecological Footprint of the city as distance causes a lot of energy to be used in the process of transportation and building materials. The majority of the buildings in the sprawl area are single family dwelling. Differ- ent methods have been proposed to stem the development of urban sprawl [26, 1]. The process of curtailing sprawl has not been successful especially in the third world countries [16, 9,
26, 3, and 14]. Poor planning and individualism caused by economic growth have not been met by physical planning process.
One of the prominent ways of curbing sprawl is the design
————————————————
ABD’RAZACK, Nelson .T A is currently pursuing PhD degree program in Urban and Regional Planning in Universiti Teknologi Malaysia. PH=+60146379331. E-mail: isbamat_2@yahoo.co.uk
Ahmad Nazri bin MUHAMAD LUDIN is a Prof. in Urbn and Regional Planning Department, Universiti Teknologi Malaysia. PH=+60137798449 E-mail: b-anazri@utm.my
of eco-village that encourages human-scale settlement that encompasses social interaction, environmental sustainability and low-impact lifestyle [20]. Globalization has been seen as one of the factors that determine environmental and social problem in the society [29]. The use of ecovillage has been suc- cessful in many nations of North America, Europe and South East Asia [14, 29, and 16].
This paper considers Ecological Footprint as useful tool for
sustainable development in planning practice. The most im- portant way to determine sustainability is through local plan- ning and urban design. Urban sprawl causes Ecological Foot- print to be higher due to consumption of energy for transpor- tation that is critical to planning issues. The most challenging in Ecological Footprint is the consumption by people that form the factors aggravating the environmental impact to the world [27] leading to global warming and climate change. In other to achieve sustainability therefore, it requires critical analysis of both land use and consumption pattern of people in the face of dwindling resources of cities. Planners have little effect on the behaviour of people but could use design of different form to improve the consumption habit of the people.
Basically there are four different types of development ap- proaches in literature for sustainable development. One of the approaches is the extent of protection of resources and ecolog- ical function of development; this compares how well two different designs conserve resources in the development of land. This is known as ecosystem planning [12].
This system have not been able to solve the problem of ur-
ban sprawl especially energy used for transportation. Other
method (ecosystem indicator) measures human impact on the environment. This requires collection of data over time and comparison of such data on different types of development. Good as it may look; it does not present useful information itself well for planners to use in the area of providing useful information for sustainable development. Third is the meas- urement of sustainability of established project against laydown criteria for development such as Green Building Council’s LEED certification process [18]. The LEED sustaina- bility criteria establish benchmark for building and process of neighbourhood certification in USA. Though it is a criterion, it is only used for architectural and building design sustainabil- ity process. The forth approach combine various environmen- tal impact in the determination of its usefulness over time. This process compares the building design and consumption pattern of different land use [27].
[25] defined Ecological Footprint as “total area of productive land and water ecosystems required for producing the resources that
the population consumes and assimilating the waste that the popula- tion produces, wherever on earth that land and water may be locat- ed”. The overall impact of man on the environment in relation to its carrying capacity is the important aspect that Ecological Footprint considerations [5]. The calculation of Ecological Footprint of nation or city requires the difference between bio- capacity of the area compared to the rate of consumption of such resources to determine whether the population is living sustainably. [10], indicated that the average global Ecological Footprint is 2.7gha while the bio-capacity is 1.8gha which leaves deficits 0.4gha. This implies that there is overshoot in the consumption pattern and if care is not taken, there will be depletion in the natural resources and the world will become unsustainable. [11] reports that the world has overshoot by
25% as at 2003. The process of calculating Ecological Footprint
incorporates all bio-productive tendencies of all land using equivalent factors. The unit of Ecological Footprint is stand- ardized and expressed as global hectare (gha) of world- average productivity.
Ecological Footprint has come to be one of the clear
measures of sustainability due to its calculation of impact of human behaviour on the natural ecosystem [25]. Majority of the Ecological Footprint at present are done at national and international level with little on city level [19]. There is need to study Ecological Footprint at local level especially of individ- ual or neighbourhood as case might be. This research focuses on Ecological Footprint of two housing estates in Minna.
2.0 STUDY AREA
This paper focused on the lifestyle of the people of Minna and the consumption habit of the people to measure whether the city is sustainable or not within the global ecological limits. It has in its objective the examination of the socio- demographic and economic survey of inhabitant of Minna, assessment of household Ecological footprints in relation to food, housing, transportation, goods and services and the waste generation in the city. It also evaluates the consequential effect on consumption pattern and the waste management style in Minna.
This section examines Minna in relation to location, popula-
tion, people, land use, economic and other activities in the city. Minna lies at latitude 9037’ North and longitude 6033’ East on a geological base of undifferentiated basement complex of main- ly gneiss and magmatite. To the Northeast of the city a more or less continuous steep outcrop of granite occurs limiting any urban development in that direction [34]. But the event of ur- banisation has led to the encroachment of the base of the out- crop for urban development. The city of Minna has grown from a mere settlement to a city that now has a dual function of Niger State capital and the headquarters of Chanchaga Lo- cal government. Due to expansion of the city Minna has now have part of Bosso Local Government as part of it. This implies that Minna has two different local governments (Chanchaga and Part of Bosso LGA).
The present city today is widely spread along the main
spine dual carriage road from Chanchaga in the south to Mai- kunkele in the North- a distance of about 20Kilometres. There is uneven development of the city (Low development at the North-East) due to steep slope, erosion, and flooding and soil type. The other constraints are drainage valley at the centre of the city which flow South-Westward with many minor drain- age channels, this has cause flooding in the city in recent past. The land that lies beyond the present built p are suitable for urban development, especially at the fringes, but this requires careful planning to keep the engineering costs of culverts, bridges, embankments and drainage work as reasonable as possible. Minna is approximately 170 Kilometres from Abuja the Federal Capital. It covers an approximately 70,000 Ha of land at the present development. The map of Study area is shown thus in figure 1 and 2 thus:
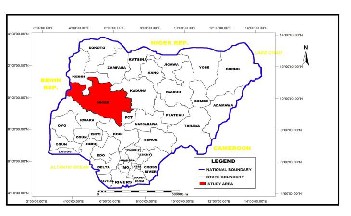
Figure 1: Map Nigeria showing Niger State
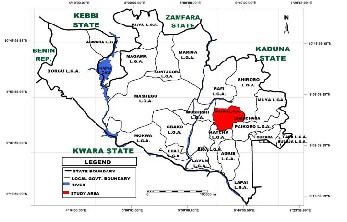
Figure 2: Map of Niger State showing study area
3.0 METHODOLOGY
The use of both primary and secondary data was used in the analysis of the research. The two estates have been fully de- veloped which make it possible to collect necessary infor- mation from the residents of the estate. There is the use of structured questionnaire to conduct the survey from the resi- dents and information from the ministry of land which is the main implementer of the project. The use of Ecological Foot- print spreadsheet for calculation was formulated by [31] and made available by redefine organization was use (Household Ecological Footprint 2.0 by redefine.org). This sheet estimates the Ecological Footprint of households within the neighbour- hood. The Ecological Footprint of each estate was calculated using the physical and consumption variables so as to deter- mine the estimate of household and the per capita Ecological Footprint. The physical parameters used are the land for de- velopment of each neighbourhood and the material consumed for the construction of the buildings, the lifestyle and con- sumption habit of the inhabitants of the two neighbourhoods. The lands for building material include space for road, build- ing, parking space, walkways, courtyards etc.
Minna is assumed to have a bio-capacity that can be used to
determine the bio-capacity of the two estates. The main focus
here is comparative value of environmental effect on the city. The building used are based on design model of the estates (that it its size). There was also inclusion of parking, building and courtyards to determine the per capita consumption. The total Ecological Footprint was then calculated and divided by the number of building in each estate (500 in M.I Wushishi and 400 in Tunga Low cost estate respectively) to estimate the Ecological Footprint of individuals. The consumption data used was average Footprinting of Nigeria due to dearth of data on consumption pattern of the study area.
The consumption focuses on food, automobile, and utilities
(electricity and water consumptions) because it is the major consumption variables that show higher energy used on daily basis and which can easily be estimated. A total of 360 and 370 households were sampled using systematic random sampling. The sample size was arrived to from [17] estimate. The data on food consumption was obtained from household expenditure on food. Transport energy, water and electricity usage was also obtained. These include the number of cars owned by each household and alternative usage to public electricity
supply and alternative water supply. Information on total number of employed people per household, total households working, distance to place of work, the type of cars. The fuel used was determined using average of 10 Km per litre [6, 7, nd
8]. The amount of water used, the electricity and fuel for gen- erators were also estimated on yearly basis as obtained from the household consumption.
4.0 RESULT AND DISCUSSION
4.1 Ecological Footprint Analysis
The population of the two (M.I Wushishi and Tunga Low- cost) estates according to 2006 National and Housing census of Nigeria put them as 5,000 and 9,856 people respectively. This is then segregated to 1,110 and 1,816 households respectively, this implies that the average per household vary between 5 and 7 people per household [20].
The analysis of the total number of building and types of development indicated that there is difference in the design of both estates as shown in table 1 below.

Table 1: Design Types of Buildings in the Estates
Design M.I Wushishi Tunga Low-Cost Total Land Size 68.84 Ha 44.65 Ha Gross Density 8.9 3.6
Dwelling per Hectare 2.4 4.2
Type of Dwelling 3-4 Bedroom Flat 1-2 Bedroom Flats
Future Development 24.8% Nil Road Construction 14.0% 10.0% Source: Authors Field Survey, 2012
The design density shows that the gross density per acre of
land is 8.9 in the Tunga Low-cost due to age of the estate and
the number of people per building, while M.I Wushishi has density of 3.6. The space provides for parking and road con- struction is higher in Tunga estate compared to M.I Wushishi estate (14%). The space p provided for road construction has been encroached and change into the physical appearances of the building as alter the plan of the estate. The future devel- opment can only take place in Wushishi estate (about 25%) while the whole land in the Tunga estate has been developed due to its situation at the centre of the city.
4.2 Land-use Analysis
The land use of the two estates shows contrast due to the age of the estates and location of each estate. The Tunga estate was developed in the 1980s while Wushishi was developed in
2009. The land use pattern shows that the Tunga Low-cost was developed using typical suburban development which covers completely the estate with houses, roads, parking and corner shops. This is contrary to Wushishi which have space for rec- reation and open spaces and area for future development. There was no fence in Tunga estate while Wushishi estate was fenced. The majority of the inhabitants of the Tunga estate are civil servants while the inhabitants of the Wushishi estate are politicians, technocrats and high income earners.
4.3 Ecological Footprint Analysis
The principle of Ecological Footprint indicated that a com- pact neighbourhood have lower Ecological Footprint and vice
versa [19]. The analysis of the total land used shows that Tunga Low-Cost has 44.65 Ha of land and M.I Wushishi estate has 68.84 Ha of land. This translates to 3.6 acre per person in Tunga Low-cost and 8.9 acre in Wushishi estate. This implies that Tunga Low-cost have 0.94 gha as Ecological Footprint while Wushishi have 1.15 gha as its Ecological Footprint. This is shown in table 3:
Table 2: Ecological Footprint Analysis of the estates
This is does to higher density of land 80% in Tunga and 54%
in Wushishi.
Electricity consumption in Tunga Low-cost is lower than that of Wushishi estate. This was obtained from the electricity bill payable by households in both estates and the record of [23]. This is in line with the fact that compact buildings uses less electricity compared to bogus buildings as seen in the Wushishi estate. Also the number of rooms and other appli- ances used by the households in both estates lso affect the en- ergy consuption. Other factors that affect electricity consump- tion in both estates include income level, lower occupancy ratio. Table 4 indicated the average electricity and water con- sumption by type of buildings in both estates.
Table 4: Average Utility Consumption by Households
Source: Author’s Field Survey, 2012
The variable that contributes greatly to Ecological Footprint is the building which account for 68.2% in Tunga Low-cost and 83.5% in M.I Wushishi estate due to building material and total material used. But there is difference in Ecological Foot- print (0.98 Ha in Wushishsi and 0.94 Ha in Tunga Low-cost). There is large courtyard in Wushishi while it is minimal in Tunga Low-cost due to illegal conversion of land for building purposes. The percentage is 4.0% and 2.0% respectively in the land use analysis.
4.4 Per capital comparison of Consumption and Build- ing Types
The calculation of Ecological Footprint of three variables of building form which is important to households is calculated. They are the building, parking and courtyards and the behav- ioural pattern of households consumption for food, utilities and transportation energy. Table 3 shows the analysis of the Ecological Footprint

Table 3: Per capita Ecological Footprint for built form Types of Bld. size EF Ave. EF Building (m2) (gha) (gha)
Wushisi 4 bedroom 700 1.01 0.98
3 bedroom 600 0.95
Tunga 2 bedroom 350 1.00 0.94
1 bedroom 550 0.88
Source: Authors Field Survey, 2012
The Ecological Footprint of building indicated that per capi- ta index for housing range between 1.01 and 0.95 in Wushishi Estate and 0.88 and 1.00 in Tunga Low-cost. The implication of this corroborates the[4] that compact cities reduces environ- mental impact and also put forward by [32] that compact cities support Ecological Footprint. The total land developed in Tunga Low-cost is lower compared to the Wushishi estate.
Source: Authors Field Survey 2012
There is inadequate calculation for water consumption in both estates due to epileptic nature of urban water supply and residents depends mainly on alternative source of water which therefore limits its usage and accurate estimate. There- fore, the Ecological Footprint of these utilities is about 1.4ha and 1.8ha respectively.
4.5 Ecological Footprint of Food, Transport and Utilities There is difference in the food consumption in both estates due to income level and household size. The variables that constitute the food vary and all the variables are combined together for the analysis. The people of Tunga Low-cost eat less meat compared to the Wushishi estate and consume more of vegetables. There is also high consumption of milk, yo- ghurt, eggs etc. in Wushishi estate. The average consumption of food constituted in Ecological Footprint need some assump-
tions because of local content. The assumptions are
(i) Low organic/local content
(ii) Average organic/local content
(iii) High organic/local content
Comparing these assumptions indicated that people of Wushi-
shi use high organic content, which are packaged food items
than people in Tunga Low-cost. The average Ecological Foot- print shows that Tunga estate is 0.94gha while Wushishi have
1.15gha.
The assumed fuel usage per household in the transportation and alternative power supply during outage of public electric- ity supply shows that it is higher in the Wushishi estate be- cause it is far from workplace of the residents thereby making them to have high number of vehicles compared to Tunga es- tate. The average number of vehicle in Wushishi is about 3 cars per household whereas it is about 1 car per household in Tunga estate. Also the people of Tunga estate enjoy more elec- tricity supply than Wushishi estate which makes them to de- pend less on generators. Almost all the households in Wushi- shi have generating set which make them to buy more fuel to power the machine whereas only few households in Tunga
estate have the generating set. The analysis of average fuel consumption per household during electricity outage is about
400 litres per month while it is about 180-200 litres per month in Tunga Low-cost. Table below shows the average fuel con- sumption per household

Table 5: Average Fuel Consumption per Households
Ave. litre of Fuel consumed 380-400 180-200 per households
Ave. cost of Fuel N 24,700 –N 26,000 N 9,750 – N 13,000 per month
Source: Authors Field Survey, 2011
4.6 Per-capita Comparison Based on Selected Residen- tial and Consumption Components
The analysis of per-capita Ecological Footprint when calcu- lated from the consumption patter of people in these estates depend on households income and types of residents they occupy and the consumption of food, travels by different mode of transportation, electricity and water. The analysis is shown in table 6.

Table 6: Per-Capita EF of building Form
Estate Type of Dwelling Yards EF per
Dwellings Size(m2) Size(m2) Acre
M.I Wushishi 4 bedroom Flat 700 200 1.15
3 bedroom Flat 600 150 1.02
2 bedroom Flat 380 70 0.98
Tunga 3 Bedroom Detarched 350 50 0.94
2 Bedroom semi-D 550 100 0.92
1 Bedroom Semi-D 250 100 0.88
Source: Niger State Ministry of Land and Town Planning,
2010.
The Ecological Footprint as shown in table 6 indicate the dif- ferent construction of dwellings in the estates and shows the per-capital Ecological Footprint that ranges between 1.15gha and 0.98gha in M.I Wushishi estate for building measuring between 700m2 and 380m2 respectively. Also the Ecological Footprint of dwellings in Tunga Low-Cost implies that it ranges between 0.94 and 0.88 from building of sizes between
350m2 and 250m2 respectively. This indicated that a compact
Tunga Low-Cost estate is more sustainable and corroborated the findings of [34 and 4] that cities have an opportunity to reduce their environmental impact by encouraging higher densities.
Another factor considered in the sustainability measure of
the two estates is the consumption of amenities in the dwell- ings, the average water consumption; electricity consumption and petrol consumption by inhabitants of these estates are shown in figure 3 thus:
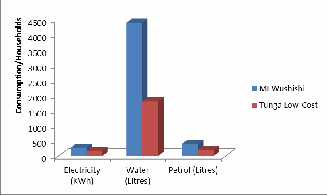
Figure 3: Consumption of Resources by Households per- Capita
Source: Author’s Field Survey, 2012
This implies that the average consumption of these ameni- ties in Tunga Low-Cost is lower than the M.I Wushishi estate due to factors such as the household size, lifestyle, income level and ability of households to spend on these utilities. All these activities constitute what make the Ecological Footprint to differ in these estates despite the fact that they are situated in the same city of Minna.
The survey conducted has its own limitation which range from Ecological Footprint as an assessment tool for urban de- velopment because it is not easy to combine the dwelling form with consumption habit of the inhabitants from the onset. This though have effect on the environment, there is no adequate data to relate these variable together. The Ecological Footprint calculation for individual, household and neighbourhood dif- fers due to resources consumed the ability to afford the re- sources and the lifestyle adopted by households. Many of the resources consumed cannot be measure directly as it requires modification to suit Ecological Footprint calculation. Another dimension to this problem is the estimation of food consumed by households from different sources. Indeed, most of the data for food would necessarily come from self-reports, which are well known to have limitations in terms of accuracy and com- pleteness [22, 32].
Data for Origin-Destination is not available to determine ac- curacy of the distance covered by households annually which are estimated based on the availability of cars to households and ability of the households to afford the cost of transporta- tion.
5.0 CONCLUSION
The analysis shown above indicated that there is different estimates of Ecological Footprint of different neighbourhood of a city rather than estimating the city’s Ecological Footprint. There is more analysis to be able to generalize the EF of a par- ticular city in developing countries as dearth of data is a prob- lem in the process of calculating the Ecological Footprint. The Ecological Footprint per-capital in Tunga Low-Cost is lower than the M.I Wushishi estate, but the difference is negligible and could be due to several factors such as consumption habit, lifestyle, household size, availability of private cars, parking etc. and building form. The most contributing factor to EF is what the household consume; therefore, there is critical need
to review the building design and lifestyle to determine the overall EF of a particular neighbourhood. Due to compactiness of Tunga Estate it may reduce the EF and consideration must be giving to how the way we build our cities influences con- sumptive behaviour.
What this implies that the urban planners and designer has
to be abreast of necessary information that will allow them to
design a city that will be sustainable and consider consump- tion and lifestyle of the inhabitants of such city or neighbour- hood.
In addition, the study illustrates that Ecological Footprint could play a useful role in conducting such assessments, by documenting some of the behaviours that are most crucial to a person’s total environmental impact and how they are related to design and built form. The Ecological Footprint tool was deemed to have considerable promise as a neighbourhood planning tool, despite challenges associated with data assem- bly and conversion and limitations in its ability to deal with cause-and-effect processes.
REFERENCES
[1] Arendt, R. (1999). Growing Greener: Putting Conservation into Local
Plans and Ordinances (Washington, DC: Island Press).
[2] Barnett, J. (2003). Redesigning Cities (Chicago, IL: American Plan-
ning Association Press).
[3] Burchell, R. W. and Mukherji, S. (2003). Conventional Development versus Managed Growth: The Costs of Sprawl, American Journal of Public Health, 93(9), 1534–1540.
[4] Calthorpe, P. and Fulton, W. (2001). The Regional City: Planning for the End of Sprawl (Washington, DC: Island Press).
[5] Chambers, N., Simmons, C. and Wackernagel, M. (2000). Sharing Nature’s Interest: Ecological Footprints as an Indicator of Sustainabil- ity (London: Earthscan).
[6] Department of Energy (2000) Chapter 4: Fuel Economy, Consump- tion and Expenditures, in: Household Vehicles Energy Consumption
1994. Available at http://www.eia.doe.gov/emeu/rtecs/chapter3.html) (accessed Au- gust 2009).
[7] Department of Energy (2000). Chapter 3: Vehicle Miles Traveled, in: Household Vehicles Energy Consumption 1994. Available at http://www.eia.doe.gov/emeu/rtecs/chapter3.html (accessed Au- gust 2009).
[8] Department of Petroleum Resources (2004). Fuel Consumption per
Litre of Different types of Vehicles in Nigeria. NNPC/Joint Venture
Publications. NNPC Tower, Abuja Nigeria.
[9] Duany, A., Plater-Zyberk, E. and Speck, J. (2000). Suburban Nation: The Rise of Sprawl and the Decline of the American Dream (New York: North Point Press).
[10] Global Footprint Network (2008): Ecological Footprint Standards 2008.
Oakland: Global Footprint Network. Retrieved from http://www.footprintstandards.org in April, 2011
[11] Global Footprint Network (2010): Ecological Footprint Atlas, 2010.
GFN Publishers, Oakland, California. USA. Retrieved from www.footprintnetwork.org on 2nd April, 2011.
[12] Gordon, D. and Tamminga, K. (2002). Large-Scale Traditional Neigh- bourhood Development and Pre-Emptive Ecosystem Planning: The Markham Experience, 1989–2001, Journal of Urban Design, 7(3), 321–
340.
[13] Holden, E. (2004). Ecological Footprints and Sustainable Urban Form,
Journal of Housing and the Built Environment, 19(1), 91–109.
[14] Hu, D. and Wang, R. (1998). Exploring Eco-Construction for Local
Sustainability: An Eco-Village Case Study in China, Ecological Eco-
nomics, 11, 167–176.
[15] Kelbaugh, D. (1997). Common Place: Toward Neighborhood and
Regional Design (Seattle, WA: University of Washington Press).
[16] Kirby, A. (2003). Redefining Social and Environmental Relations at the Eco-Village at Ithaca: A case study, Journal of Environmental Psy- chology, 23, 323–332.
[17] Krejcie, R and Morgan, D.W. (1970). Determining the Sample Size for
Research Activities. Educational and Psychological Measurement, 30,
607-610
[18] Leadership in Energy and Environmental Design (2005). LEED: Leadership in Energy and Environmental Design. Available at http://www.usgbc.org/DisplayPage.aspx?CategoryID=19 (accessed October 2011).
[19] Moos, M., Whitfield, J., Johnson, J.C., and Andrey, J. (2006). Does Design Matter? The Ecological Footprint as a Planning Tool at the Local Level. Journal of Urban Design, 11(2), 195–224.
[20] National Population Commission (2010). The 2006 National Popula- tion and Housing Census Data: Priority Tables. NPC Publication, Presidency, Abuja, Nigeria.
[21] Norberg-Hodge, H. (2002). Why Eco-villages? The Ecologist, 32(1), 38. [22] Parslow, R., Hepworth, S. and McKinney, P. (2003). Recall of Past use
of Mobile Phone Handsets, Radiation Protection Dosimetry, 106(3),
233–240.
[23] Power Holding Company of Nigeria (2010). Metre Reading for
Households Energy Consumption in Niger State, Nigeria. Quarterly- Bulletin, PHCN, Minna, Nigeria
[24] Pollard, T. (2001). Greening the American Dream? Planning, 67(10),
10–16.
[25] Rees, W. (2000) Eco-Footprint Analysis: Merits and Brickbats, Ecologi- cal Economics, 32(3), 371–374.
[26] Roseland, M. (1992). Toward Sustainable Communities (Ottawa:
National Round Table on the Environment and Economy).
[27] Spangenberg, J. H. and Lorek, S. (2002). Environmentally Sustainable Household Consumption: from Aggregate Environmental Pressures to Priority Fields of Action, Ecological Economics, 43, 127–140.
[28] Takeuchi, K., Namiki, Y. and Tanaka, H. (1998). Designing Eco- Villages for Revitalizing Japanese Rural Areas, Ecological Economics,
11, 177–197.
[29] Trainer, T. (2000). Where are we, Where do we want to be, How do we get there? Democracy and Nature, 6(2), 267–283.
[30] Wackernagel, M. and Yount, D. (1998). The Ecological Footprint: An Indicator of Progress Toward Regional Sustainability, Environmental Monitoring and Assessment, 51, 511–529.
[31] Wackernagel, M., Deumling, D., Manfreda, C. and Dholakia, R.
(2003). Assessing Your Household’s Ecological Footprint, Version
3.2, Redefining Progress. Available at http://www.redefiningprogess.org (accessed January 2010).
[32] Wackernagel, M., Schulz, N., Deumling, D., Linares, A., Jenkins, M., Kapos, V., Monfreda, C., Loh, J., Myers, N., Norgaard, R. and Rand- ers, J. (2002). Tracking the Ecological Overshoot of the Human Econ- omy, Proceedings of the National Academy of Sciences of the USA, 99(14),
9266–9271.
[33] Walker, L. and Rees, W. (1997) Urban Density and Ecological Foot- prints: An Analysis of Canadian Households, in: M. Roseland (Ed.) Eco-City Dimensions, 96–112 (Gabriola Island, BC: New Society Pub- lishers).
[34] Maclox Limited (1980). Minna Master Plan. Maxclox Publication for Niger State Ministry of Land and Town Planning. Maidiguri, Nige- ria.