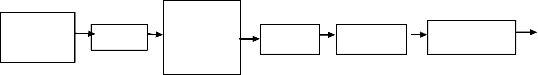
Figure:1 shows the flow diagram of ECG signal features extraction procedure.


The algorithms[05] presented in this section are applied to the ECG signals which are saved as a text file provided by
International Journal of Scientific & Engineering Research, Volume 5, Issue 5, May-2014 1509
ISSN 2229-5518
ECG Signal Analysis Using Wavelet Transform
Iffat Ara, Md. Najmul Hossain, Md. Abdur Rahim
Abstract: ECG signal plays an important role in the primary diagnosis and analysis of heart diseases. The feature of ECG signal with time-varying morphological characteristics needs to be extracted by signal processing method because there are not clearly visible in the graphical ECG signal. For analyzing this kind of signal wavelet transforms are a powerful tool. In this thesis paper, an algorithm for automatic ECG signal feature extraction was evaluated. For feature extraction multi-resolution wavelet transform is used. Text formatted ECG signals are taken from the MIT-BIH arrhythmia database. For wavelet transform, daubechies wavelets were used because the scaling functions of this wavelet filter are similar to the shape of the ECG. In the first step, the ECG signal was denoised by removing the corresponding higher scale wavelet coefficients. Then the R wave peaks were detected which have higher dominated amplitude. These detected R peaks were later used to detect the other peak as P, Q, S, T and also the zero crossing level. From the different peaks, the features of the ECG signal were extracted. Depending on different features, different types of abnormality are classified.
Keywords: ECG, Wavelet Transform, P-QRS-T wave, Daubechies wavelets, Feature Extraction.
The ECG is nothing but the recording of the heart’s electrical activity that is generated by depolarization and repolarization of the atria and ventricales[01]. ECG is an important tool for the primary diagnosis of heart disease; it shows the electrophysiology of the heart and the ischemic changes that may occur like the myocardial infection, conduction defects and arrhythmia [02]. One cardiac cycle in an ECG signal consists of the P-QRS-T waves . Most of the clinically useful information in the ECG is found in the intervals and amplitudes defined by its features. The ECG feature extraction system provides fundamental features (amplitudes and intervals) to be used in subsequent automatic analysis. Algorithms for ECG feature extraction are difficult to produce due to temporal variations from physiological conditions and the presence of noise. Beat or QRS complex detection is the most important part of an ECG feature extraction system. R wave peak is the QRS complex designator, so peak detection algorithms are required.
The earlier method of ECG signal analysis was based on time domain method. But this is not always sufficient to study all the features of ECG signals. So, the frequency representation of a signal is required. To accomplish this Fourier Transform technique is applied. Fourier Transform analysis provides the signal spectrum or range of frequency amplitude within the signal; however Fourier transforms only provides the spectral components not their temporal relationship. Wavelet transform can provide a time versus frequency representation of the signal and work well on non-stationary signal[03]. Wavelets also overcome the present resolution problem of the short time Fourier
————————————————
• Author:Iffat Ara, Lecturer, Department of Information and Communication Engineering, Pabna University of Science and Technology,Pabna, Bangladesh. Email:ara.iffat@ymail.com
• Co-authors: Md. Najmul Hossain, Department of ETE, Pabna University of Science and Technology, Pabna, Email:rony.ru85@gmail.com and Md.Abdur Rahim, Department of CSE, Pabna University of Science
and Technology, Pabna, Bangladesh. Email:rahim_bds@yahoo.com
transform by using a variable length window. The large number of different wavelet functions provides a rich space to search for wavelet which could efficiently represent a signal of interest. Although there are some methods available in order to select the best wavelet for an application. The orthogonal Daubechies wavelet family, specifically Db6 is used here. We have implemented here the DWT in order to extract ECG signal features.
The wavelet transform is a convolution of the wavelet function ψ(t) with the signal x(t). Orthonormal dyadic discrete wavelets are associated with scaling function φ(t). The scaling function can be convolved with the signal to produce approximation coefficients S. The discrete wavelet transforms (DWT) can be written as:
∞
Tm,n = � x(t)ψm,n (t)dt … … … … . (1)
−∞
Where Tm,nis known as the wavelet (or detail) coefficient at scale and location indices (m, n).
By choosing an orthonormal wavelet basis, ψm,n(t), and we can reconstruct the original. The approximation coefficients of the signal at the scale m and location n can be represented by:
∞
Sm,n = � x(t)φm,n (t)dt … … … . (2)
−∞
The discrete input signal S0,nis of finite length N, which is an integer power of 2:N = 2m . Thus the range of scales that
can be investigated is 0 < m < M. A discrete
approximation of the signal can be shown as
M
x0 (t) = xM(t) + � dm (t) … … … (3)
m=1
Where the mean signal approximation at scale M is
IJSER © 2014 http://www.ijser.org
International Journal of Scientific & Engineering Research, Volume 5, Issue 5, May-2014 1510
ISSN 2229-5518
xM(t) = SM,n φM,n (t) … … … … … … … … (4)
The detail signal approximation corresponding to scale
index m is defined for a finite length signal as
2M−m−1
dm (t) = � Tm,n ψm,n (t) … … … (5)
n=0
The signal approximation at a specific scale is a combination of the approximation and detail at the lower scale
xm (t) = xm−1 (t) − dm (t) … … … … (6)
If scale m = 3 was chosen, it can be shown that the signal
approximation is given by
x3 (t) = x0 (t) − d1 (t) − d2 (t) − d3 (t) … … . . . (7)
Corresponding to the successive stripping of high
frequency information (contained within the dm (t)) from the original signal at each step [04]. This is referred to as multi-resolution analysis of a signal using wavelet transform, and is the basic of our procedure.
Physiobank ATM [06]. Selecting a wavelet function which closely matches the signal to be processed is of utmost importance in wavelet application. First the ECG signals were preprocessed and then the preprocessed ECG signals were used for feature extraction. Basic signal features are extracted first utilizing wavelet transforms including P, Q, R, S, T waves and the zero level of the signal. These basic features are used later to evaluate the related features as: P- R, R-R time intervals, heart rate, R-R time interval variation, QRS interval, S-T interval.
When an Electrocardiogram is recorded many kinds of noises are also be recorded due to very low and high frequencies [07] , which causes an ECG to have baseline drift and noise in the signal and is very difficult to clinically diagnose. For proper diagnosis of ECG it is necessary to remove noise from the signal. A process of removing the baseline drift of a signal [08, 07] is called as de-trending and a process of removing the noise [07] of a signal is called as de-noising. Both of these processes come under the preprocessing of an ECG signal. Once the signal is preprocessed then it can be used for further processing.
Figure:1 shows the flow diagram of ECG signal features extraction procedure.
The algorithms[05] presented in this section are applied to the ECG signals which are saved as a text file provided by![]()
![]()
ECG Signal Preprocessing R Peak detection
![]()
P & T Peak detection
![]()
![]()
Zero Crossing detection
Q & S Peak detection


Figure -1: Flow diagram of the ECG signal feature extraction procedure.
There are actually four separate algorithms, each of which is designated to extract certain feature of the ECG signal.
First the high dominated amplitude R-peak is detected. Then Q and S wave are detected. The zero voltage level of the signal is found next. P and T waves are the last things to
be found.
IJSER © 2014 http://www.ijser.org
International Journal of Scientific & Engineering Research, Volume 5, Issue 5, May-2014 1511
![]()
ISSN 2229-5518
Remove the R peak from memory
Processed ECG signal
F-DWT
Keeping details between
23-25
R-DWT Squaring
Thresholding
Register the R
peak
Processed ECG signal
F-DWT
Keeping details greater
than 25
R-DWT
![]()
Searching for minimum of the signal about the R peak with in 0.1 second
Register the Q & S waves minimum locations
Processed ECG signal
F-DWT

Keeping details between
21-25
R-DWT
Searching for the two zero crossings of the signal before the Q
wave and after the S
Register the two zero level of the signal
Processed ECG signal
F-DWT

Keeping details between
24-28
R-DWT
Searching for extermums of the signal before and after the two zero crossing
points of the signal
Register the P & T waves minimum locations

Figure-2: Detection procedure of the R wave detection, Q and S wave detection, zero level detection, P and T wave detection.
The procedure of the R peak detection is shown in figure-2. Peaks of the R waves have the largest amplitude. In order to detect the peaks, First-Discrete Wavelet transform (F- DWT) of the signal is performed. Specific details of the signal are selected. Details 23-25 were kept and all the details were removed. This procedure removed low frequencies and high frequencies. Then apply Reverse- Discrete Wavelet Transform(R-DWT) on the signal. The attained signal samples were then squared. High amplitude transitions of the signal were then more noticeable. Then a practically lower limit is applied on the signal to remove unrelated noisy peaks. If two detected R-peak are located less than 0.25 second then remove the R-peak. If the two detected R-peak are located greater than 0.25 second, register the R-peak. Because no subsequent beats happen less than 0.25 second, pseudo-beats are also removed. Detection of R peaks is very important because
they define the cardiac beats and the exactness of all forthcoming detections is dependent on this.
In order to make the peaks noticeable, First-Discrete Wavelet transform (F-DWT) of the signal is performed. All the details of the signal were removed up to detail 25, and then Reverse-Discrete Wavelet Transform is applied. The approximation signal remained, was searched for minimum of the signal within 0.1 second about the R peak which is formally detected. The left minimum point from the R peak denoted the Q peak and the right minimum point denote the S peak.
At the end of the QRS complex, no current is flowing around the heart. Even the current of injury disappears at this point and the potential of the electrocardiogram at this instant is zero. This point is known as the J point. Keeping details between 21-25 for zero level detection. Zero crossing
of the signals is detected before the Q peak where the signal
IJSER © 2014 http://www.ijser.org
International Journal of Scientific & Engineering Research, Volume 5, Issue 5, May-2014 1512
ISSN 2229-5518
goes from negative to positive. There is also another zero crossing after the S wave peak
To detect the P & T peak of the ECG performed the First- Discrete Wavelet Transform (F-DWT) of the signal. These waves are more noticeable when keeping details 24-28. At these levels, lower frequencies and high frequencies ripples of the signal are removed. Then apply Reverse-Discrete Wavelet Transform(R-DWT) on the remaining signal. Search the maximum of the signal before the Q-peak and after the S-peak. The maximums of the signal before and after the zero crossings about each R peak which are formerly detected denote P and T peaks. The maximum of the signal before the zero crossing is the P wave and the maximum of the signal after the zero crossing is the T wave peak.
This section of this paper presents and discusses all the results of analysis using various computer programs written in MATLAB 7.5. In this present study we observe the different arrhythmias ECG signal and detect their R peak. First, from the MIT-BIH database signal of duration
10 second, baseline drift are removed and then denoising the signal. The basic features of the ECG signal are also extracted by the proposed algorithm. We also compare the feature of the normal and abnormal ECG signal for arrhythmia detection.
In Figure 3 shows the detected R-peak and their amplitude after removing the pseudo peak based on thresholding. The numbers of detected R-peak are 11 in ten second duration. In Figure 4 shows the denoised ECG signal and all the
detect peak as P, Q, R, S, and T.
within the normal range. The amplitude of P peak is minimum 0.056 mV and maximum 0.14 mV.
• P-R interval: The P-R intervals in terms of second are varying from minimum 0.125 second to maximum
0.1472 second. The normal range of P-R interval is 0.12-
0.2 second. So the P-R interval is within normal range.
• QRS duration: The QRS duration in terms of second is minimum 0.08 and maximum 0.122. The normal range of The QRS duration is 0.06 to 0.1 second. The QRS duration is lies within the normal range. The amplitude of Q peaks vary from -0.21 mV to maximum -0.13 mV.
• S-T interval: The S-T intervals in terms of second are varying from 0.1917 to 0.2556. The normal range of S- T interval is 0.05 to 0.15 second. The amplitude of S peak is minimum -0.27 mV and maximum -0.14 mV. The amplitude of T peaks is minimum 0.157 mV and maximum 0.21 mV.
If the S-T interval is greater than 0.1 second the arrhythmia is known as Myocardial injury. Also the R-R intervals are not constant.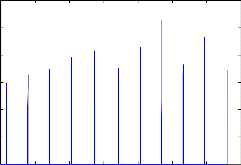
3
2.5
2
1.5
1
0.5
0
0 500 1000 1500 2000 2500 3000 3500
time(second)
Figure 3: Position of detected R peaks of the record 101 of MLII.
2
• Heart rate: 73.83 bit per minute.
• R-R interval: The R-R intervals in terms of second of the record 101 are varying from minimum 0.86 second to maximum 0.95 second at ten second duration. The normal range of R-R interval is 0.6 to 1 second. So, the R-R interval is on the normal level. The amplitudes of R peak are minimum 0.88 mV to maximum 1.42 mV.
• P-P interval: The P-P intervals in terms of second are varying from 0.866 second to 0.941 second. The normal
range is 0.6 to 1 second. The P-P intervals are lies
1.5
1
0.5
0
-0.5
ECG
R peak Q peak S peak P peak T peak
0 1 2 3 4 5 6 7 8 9 10
Time(second)
Figure 4: Detected Peaks of the record 101, MLII
IJSER © 2014 http://www.ijser.org
International Journal of Scientific & Engineering Research, Volume 5, Issue 5, May-2014 1513
ISSN 2229-5518
The features of the different signal which found by these
studies are summarizing in Table 1 for few number of
signal. Abnormalities of these signals are marked by yellow
color.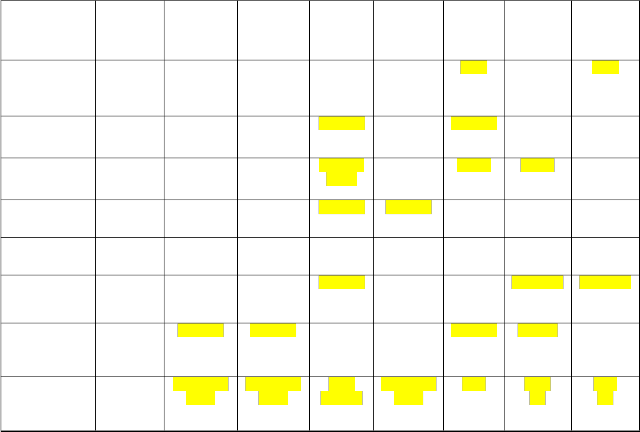
TABLE 1: RESULTS OF THE DIFFERENT EXTRACTED FEATURES.
Features | Normal | Record | Record | Record | Record | Record | Record | Record |
range | 101 | 103 | 119 | 121 | 124 | 200 | 203 |
Heart rate
(bit per minute) R-R
interval(sec)
60-100 73.83 77.09 72.28 67.16 56.39 97.09 121.9
0.6-1 0.86-0.95 0.83-0.94 0.52-1.32 0.94-1.0 1.17-1.26 0.59-0.70 0.36-0.73
P peak Present, upright
Normal Normal Some are absent
P peak Amplitude Very low
Absent Absent Present, amplitude
low
P-P interval(sec) P-R interval(sec)
0.6-1 0.86-0.94 0.83-0.93 0.44-1.43 0.98-1.18 - - 0.23-0.80
0.12-0.2 0.12-0.14 0.15-0.17 0.13-0.23 0.15-0.42 - - 0.09-0.27
QRS
interval(sec)
0.06-0.1 0.08-0.12 0.04-0.1 0.05-0.19 0.1-0.16 0.075-
0.12
0.014-0.13 0.008-0.20
S-T
interval(sec)
0.05-0.15 0.19-0.25 0.17-0.26 0.02-0.41 0.19-0.13 0.31-0.35 0.2-0.26 0.12-0.27
Arrhythmia None Myocardial injury
Myocardial
Injury
PVC, Myo. Inj
Myocardial
Injury
PVC PVC, VT
PVC VT
With this algorithm, abnormalities of the ECG are obtained from the extracted feature. By decomposing of the signal it has been seen that most of the details of the signal are
contained at lower scale which need less decomposition, so
faster application of the wavelet. The decomposition levels depend on the length of the signal. The database signal should be de-noised for detecting features properly. First R peaks were detected because this R peaks has high dominated amplitude and this peak detection is easy than
other peaks. . Choosing certain details 21-25 of the signal
IJSER © 2014 http://www.ijser.org
International Journal of Scientific & Engineering Research, Volume 5, Issue 5, May-2014 1514
ISSN 2229-5518
made Q and S peak easy to find. Again using certain details
24-28 made P and T peak more noticeable. The features of ECG are related to P, Q, R, S, and T peak. The features of ECG as R-R interval, P-P interval, P-R interval, Heart rate, QRS interval, S-T interval and amplitude of the different peak are extracted by these present algorithms. By correlating the extracted features with normal range of these features decision was taken that patient have any type of abnormality or none. In this present study it was seen that different patient have different types of arrhythmia as PVC, VT, ST, SB, Myocardial Injury etc. In PVC arrhythmia P peaks are absent or invisible and QRS intervals are greater than 0.1 second. The causes for PVC are gastric overload, stress, caffeine, heart disease etc. In sinus tachycardia (ST), heart rate is greater than 100 bit per minute. The causes for sinus tachycardia are exercise, fever, anxiety etc. It may be possible to increase the precision of the algorithm by utilizing different wavelet and increasing the number of feature.
An interesting topic for future research is to use expert system for automatic ECG arrhythmia classification. The present work use only one wavelet function for wavelet transform. In future another wavelet function will also apply and in contrast this algorithm will also apply on a different database signal of Physiobank. In the future work in continuous transform domain has been proposed. Multiscale analysis approach in continuous wavelet transform could significantly result in highlighting of several important characteristics. The analysis of the signal by pattern recognition based approach could be the logical extension of this work. The detection of different patterns
in the signal and then the combination of that with our
current studies could lead to significant identification or classification of pathologies.
[01]. L. Cromwell, F.J. Weibell, and E.A. Pfeiffer: Biomedical
Instrumentation and Measurements, Prentice Hall of India, New Delhi
2005.
[02]. Abdel-Rahman, Al-Qawasmi and KhaledDaqrouq: ECG signal enhancement Using Wavelet Transform, Published by WSEAS TRANSACTION on BIOLOGY and BIOMEDICINE; issue: 2; Volume:
7; pp: 62-72; April 2010.
[03]. C. Saritha, V. Sukana, and Y. Narasimha Murthy: ECG Signal
Analysis Using Wavelet Transforms, Proceedings Bulg.J.Phys.35; pp:
68-77; 2008.
[04]. Paul S Addison, The illustrated wavelet transform handbook, (IOP Pub., 2002).
[05]. S. Z. Mahmoodabadi (MSc), A. Ahmadian(PhD), M. D. Abolhasani(PhD): ECG Feature Extraction Using Daubechies Wavelets, Proceedings of the Fifth IASTED International Conference VISUALITION, IMAGING,AND IMAGE PROCESSING, September 7-
9,Benidorm,Spain,pp.343-348,2005. [06].http://en.Wikipedia.org/phisiobank/database/mitdb.
[07]. Vanisree K and JyothiSingraraju: Automatic detection of ECG R-R interval using discrete wavelet transform , International Journal on Computer Science and Engineering (IJCSE);Vol:3;No:4;pp:1599-
1605;April 4,2011.
[08]. K. Daqrouq: ECG baseline wandering reduction using wavelet transform, Asian journal of information Technology; Vol: 4(11); pp=989-995; 2005.
[09]. RudraPratap: Getting started with MATLAB 7, A quick introduction for Scientist and Engineers.
IJSER © 2014 http://www.ijser.org
International Journal of Scientific & Engineering Research, Volume 5, Issue 5, May-2014
ISSN 2229-5518
1515
1-BER IS) 2014