International Journal of Scientific & Engineering Research, Volume 3, Issue 11, November-2012 1
ISSN 2229-5518
Dielectric Diagnosis of EHV current Transformer Using Frequency Domain Spectroscopy (FDS) & Polarization and Depolarization Current (PDC) Techniques
Abhishek Joshi, Pooja Aaradhi
Abstract— Current transformers (CT) are an important element of substation used for metering and protection. The CT forms main link in ensuring the reliability of the entire power system. Most of the faults occurring in Instrument transformers are due to insulation failure (Viz. oil and paper for this research work). Various factors responsible for degradation and failure of insulation in CT are electrical, mechanical and thermal stresses, poor maintenance and incorrect loading. The CTs used in substations should be replaced in order to ensure continuity in the power supply for the end user. For a systematic replacement program to be planned and to avoid unexpected breakdowns in Instrument transformers, dielectric diagnostic tools are gaining high importance. These dielectric diagnostic tools deduce the moisture in paper or pressboard and oil conductivity from dielectric properties like return voltage, charging currents and dissipation factor. Two dielectric response measurement techniques have been established; the current measurement in the time domain, also called the Polarization and Depolarization Current (PDC) and the Frequency Domain Spectroscopy (FDS) techniques. The research considers an application of this technique to 245kV and 420kV OIP CTs. The application of FDS and PDC techniques for CT insulation analysis and its effectiveness to on field applications is also discussed.
Index Terms— Current Transformer (CT), Dielectric Diagnosis, Frequency Domain Spectroscopy (FDS), Oil Impregnated Paper (OIP), Dielectric Response Analyzer, Polarization Depolarization Current (PDC) Technique.
—————————— ——————————
1 INTRODUCTION
N ageing population of transformers in the utilities around the world has led to a growing interest in the condition assessment and monitoring of transformer insulation in recent years. This growing interest is primarily driven by transformers being one of the most critical items of equipment of an electric power transmission and distribution system and they play an important role in providing a reliable and efficient electricity supply. During the course of operation, the condition of transformer oil- paper insulation deteriorates under a combination of thermal, electrical, mechanical, chemical and environmental stresses. The physical and chemical degradation processes such as ageing and moisture generation induced by these stresses change the molecular microstructure of dielectrics and thus influence the conduction and polarization processes. Dissolved Gas Analysis (DGA), degree of polymerization (DP) and furan analysis are some of the conventional diagnostic techniques that have been used to monitor the ageing process of the insulation of the
transformer.
[1] Increasing requirements for appropriate tools to
diagnose power systems insulation nondestructively and reliably in the field drive the development of diagnostic tools based on changes of the dielectric properties of the insulation. Some of these modern diagnostic methods include the Recovery Voltage Measurement (RVM), Frequency Domain Spectroscopy (FDS) and Polarization and Depolarization Current Measurements (PDC). These two later became only recently available as user-friendly methods, and can be used to monitor, diagnose and check
new insulating materials, qualification of insulating systems during/after production of power equipment‘s non-destructively.
2 POLARIZATION & DEPOLARIZATION CURRENT (PDC) TECHNIQUE
The time domain dielectric diagnosis mainly includes Polarization and depolarization current method. This technique records charging and discharging currents of the insulation. The measurement of polarization and depolarization currents (PDC) following a dc voltage step is one way in the time domain to investigate the slow polarization processes. The dielectric memory of the test object must be cleared before the PDC measurement. The voltage source should be free of any ripple and noise in order to record the small polarization current with sufficient accuracy.
The Fig. 1 shows the test arrangement for the PDC measuring technique. The procedure consists in applying a dc charging voltage of magnitude Uc to the test object for a long time (e.g., 10,000 s). During this time, the polarization current Ipol(t) through the test object is measured, arising from the activation of the polarization process with different time constants corresponding to different insulation materials and to the conductivity of the object, which has been previously carefully discharged. The capacitance Cm between the two terminals of the insulation system under test is measured with any capacitance measuring ac bridge around the power frequency and then
International Journal of Scientific & Engineering Research, Volume 3, Issue 11, November-2012 2
ISSN 2229-5518
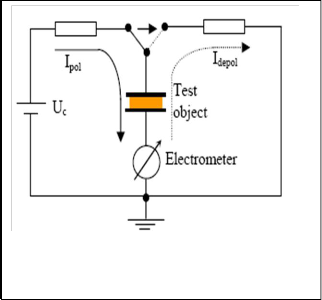
charged by the dc voltage step Uc. A long charging time is required (10,000 s) in order to assess the inter facial polarization and paper condition. The initial time dependence of the polarization and depolarization currents (<100 s) is very sensitive to the conductivity of the oil while the moisture content of press board influences mainly the shape of the current at much longer time.
2.1 ADVANTAGES of PDC Method
1) PDC measurements can provide reliable information about the condition of transformer insulation.
Fig. 1. Principle of test arrangement for the “PDC” measuring technique
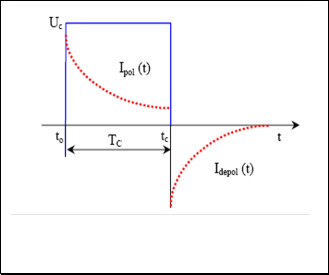
dividing by the effective relative permittivity εr, the capacitance of combination of the composite oil-paper insulation system is calculated (Co = Cm/εr). The voltage is then removed and the object is short- circuited at t = tc enabling the measurement of the depolarization current (or discharging, or de-sorption) Idpol(t) in the opposite direction, without contribution of the conductivity. The polarization current measurement can usually be stopped if the current becomes either stable or very low. According to the superposition principle the sudden reduction of the voltage UC to zero is regarded as a negative voltage step at time t = tc. If the test object is charged for a long time so that f (t + tc) =0, dielectric response function f (t) is proportional to the depolarization current. ǽŞǾ
Fig. 2. Principle of polarization and depolarization current.
2) This non-destructive method can provide the moisture content in the solid insulation material and the conductivities of the oil and paper.
3) Other diagnostic quantities like tan δ, polarization index and polarization spectra can be calculated from PDC measurements directly.
4) It provides very fast response at low frequencies with good accuracy.
3 FREQUENCY DOMAIN SPECTROSCOPY (FDS)
Dielectric response in the frequency domain is another alternative method to study the polarization phenomena. This is an ac test and, dissipation factor or tan delta is measured as a function of frequency of test .The frequency range for FDS is normally between 1 m Hz to 1 kHz. This involves measurement of impedance at different frequencies and possibly at different voltages also. The dielectric is energized with sinusoidal voltages and the current across it is measured .Measurements in the frequency domain need voltage sources of variable frequencies and, for applications related to HV power equipment, output voltages up to at least some hundreds of volts. The impedance is then calculated which helps in the evaluation of power factor, capacitance, dissipation factor, permittivity etc. The relationship between the applied voltage U(ω) and measured current I(ω) can be written as follow:-
(ω) ωC(ω)U(ω) (1) By using above relationship, conduction and polarization
processes, which are influenced by moisture and aging, of the insulating material are studied.
The Fig. 2 shows the principle of polarization and depolarization current. The insulation between windings is
International Journal of Scientific & Engineering Research, Volume 3, Issue 11, November-2012 3
ISSN 2229-5518
3.1 Procedure for FDS
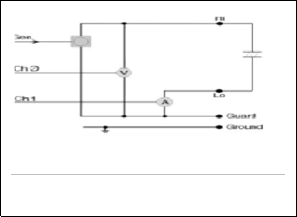
In this method we determine the dielectric response in frequency domain. Several measurements at different frequencies are performed instead of a single measurement at fixed frequency. Here a digital signal processing unit generates a sinusoidal test signal with the desired frequency. This signal is amplified with an internal amplifier and then applied to the specimen. The voltage over and the current through the specimen are measured with high accuracy using a voltage divider and an electrometer. From this Impedance Z is calculated as a function of frequency including its values close to power frequency as well. From the impedance, the relevant parameters such as dissipation factors and capacitances are calculated .The small bandwidth makes this method relatively insensitive to interferences.[8]
Fig. 3. Schematic block diagram of equipment for FDS
3.2 Temperature Dependence of Frequency
Domain Spectroscopy (FDS)
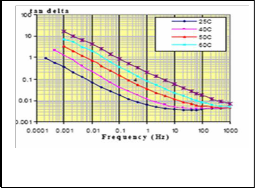
The migration of moisture in the transformer insulation has high dependence on temperature. Hence the variation of dielectric responses due to the influence of temperature is important for judicious interpretation of the measurements of in-service Transformers. . The shifting of the curves towards higher frequencies, increase in the tan delta values in the mid frequency range & disappearance of peaking at low frequencies at higher temperatures, total increase in the magnitude of the dielectric losses are some of the characteristics observed.
Fig. 4 Temperature dependence of tan delta
3.2 Advantages of FDS Method
1) Dielectric frequency domain spectroscopy (FDS) enables measurements of the composite insulation capacitance, permittivity, conductivity (and resistivity) and loss factor in dependence of frequency.
2) The real and imaginary part of the capacitance and permittivity can be separated.
3) This nondestructive technique also provides the moisture content in the solid insulation material and C-ratio diagnostic quantity.
4) FDS has better noise performance and separates the behavior of polarizability (χ‖) and losses (χ‘) of a dielectric medium.
4 ADVANTAGES OF USING BOTH FDS & PDC SIMULTANEOUSLY
Since the 1990‘s, electrical dielectric diagnostic technique based on time domain measurements such as Polarization and Depolarization Current (PDC) measurement technique have been introduced and is widely used to assess the condition of the insulation system within a transformer. With the PDC measurement technique, the condition of the oil or paper can be assessed separately without opening the tank for paper sampling. Frequency Domain Spectroscopy (FDS) diagnostic technique is becoming more popular in recent years and one of the reasons is that the dissipation factor (tan δ) measurement is independent of the transformer geometry. Another advantage is that FDS is more suitable for field-use than PDC because it is less sensitive to noise and also due to the inability of the PDC technique to measure the first few seconds of transient currents after switching to polarization or depolarization, limiting its equivalent frequency to below 1 Hz. The principle of FDS measurement is to measure the dissipation factor (tan δ) and complex capacitance as a function of frequency.[7]
To conduct any polarization based measurements on the field transformers, the transformers will have to be scheduled for disconnection from the grid and set aside for cooling. In a practical substation environment, the temperature of the substation is uncontrollable and the temperature within the field transformer is dependent on the time of disconnection from the grid. The condition of the transformer cannot be accurately evaluated without knowledge on the effects of different temperatures on the transformer insulation.[6]
5 - DIELECTRIC RESPONSE ANALYZER
The Dielectric Response analyzer determines the dielectric properties as a function of frequency. It measures the dissipation factor and capacitance of insulation systems like rotating machines. It is used to determine the moisture
International Journal of Scientific & Engineering Research, Volume 3, Issue 11, November-2012 4
ISSN 2229-5518
content in oil-paper insulation for the following applications:-
1) Power transformers
2) Paper-mass insulated cables
3) Bushings
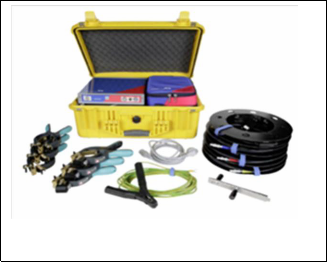
4) Instrument Transformers (CTs/PTs)
Fig. 5 Dielectric response analyzer
5.1 Key Features of Dielectric response analyzer
1) Wide frequency range provides a high degree of accuracy and precise measurements at all temperature levels never possible in the past.
2) Various insulation systems can be evaluated.
3) Large number of connection diagrams to support the user‗s special guarding technique protects against measurement interference.
4) Two input channels significantly reduce testing time.
5) Dielectric response analyzer is the first dielectric response analyzer which comes equipped with two input channels. By utilizing two channels, significant time savings can be achieved. For example, in the case of a three- winding transformer, the test voltage can be applied to the LV winding while the input channels are connected to the HV and the tertiary windings. This may result in a time savings of up to 50 %.
6) Determination of moisture content in oilpaper insulations for a more accurate condition assessment.
7) Reliable quantitative data for an efficient condition based maintenance program.
8) Moisture assessment is based upon international standards.
9) Scientifically proven interpretation scheme.
10) Automated analysis of moisture content and oil conductivity.
11) Compensation for temperature and insulation geometry.
5.2 Measurements Using Dielectric response analyzer
1 Measurement of capacitance and dissipation factor
Capacitance and power factor / dissipation factor (PF / DF) measurements are performed to investigate the condition of bushings as well as the transformer overall insulation. Aging and decomposition of the insulation, or the ingress of water, increase the energy that is turned into heat in the insulation. The level of this dissipation is measured by the PF / DF. Capacitance values of bushings show if there have been breakdowns between capacitive layers. For resin bonded paper bushings, cracks into which oil has leaked can also change the value of the capacitance. A rise in capacitance of more than 10 % is normally considered to be dangerous, since it indicates that a part of the insulation distance is already compromised and the dielectric stress to the remaining insulation is too high. These measurements give an idea regarding increased heat dissipation, aging of insulation and help in better understanding of losses
2 Moisture Determination
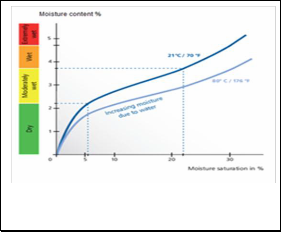
An accurate assessment about the actual moisture content is required in order to decide if further corrective action, such as drying, is necessary. The graph below shows the temperature dependent relationship between moisture content and moisture saturation to allow conversion of the measured values. [5]
Fig. 6 . Temperature dependent relationship between moisture content and moisture saturation.
International Journal of Scientific & Engineering Research, Volume 3, Issue 11, November-2012 5
ISSN 2229-5518
3 Assessments of Results
IEC 60422 categorizes moisture saturation of more than
6 % as ―moderately wet―, which is equivalent to a moisture content of approximately 2.2 %. At this level the dangerous effects caused by water can affect the insulation. Based upon this, further corrective action should be taken.
6 DIELECTRIC RESPONSE ANALYSIS OF CURRENT
TRANSFORMER USING DIELECTRIC ANALYZER.
Dielectric response analysis is used to assess the water content of the solid insulation (cellulose) and thus periodically monitor its condition. Knowing the water content is important for the condition assessment of transformer bushings and the transformer in its entirety. Displaying the dissipation factor over a wide frequency range provides insight into the specific properties of the oil, the geometry of the solid insulation in the form of spacers and barriers, and the condition of the solid insulation itself. This is the only method that can - non-invasively - directly measure the actual moisture content in the solid insulation. Aging threshold values as defined in IEC 60422 allow for an automatic insulation condition assessment and corresponding recommendations for further actions such as transformer drying.
Dielectric response analyzer can measure dielectric response over an extremely wide frequency range (10 μHz -
5 kHz). It minimizes testing time by combining frequency
domain spectroscopy (FDS) at high frequencies and polarization and depolarization current measurement (PDC) at low frequencies. also displays the polarization index (PI) based on FDS/PDC measurement. It thus replaces measuring insulation resistance, delivering the same information, but being more accurate for moisture determination. Testing time is further minimized by simultaneously measuring through two channels, and the application of intelligent curve recognition. Measurements are ended automatically as soon as the typical shape of the curve, including the hump, indicates that all relevant points have been measured.
If the dissipation factor of a transformer is plotted against a wide frequency range, the resulting dielectric response curve contains information on the insulation condition. The dissipation factor plotted against frequency shows a typical S-shaped curve. The very low and the high sections contain information on moisture and aging in the solid insulation, the linear, middle section of the curve with the steep gradient reflects oil conductivity. Insulation geometry conditions determine the ―hump― which is located to the left side of the steep gradient. With increasing moisture content, temperature or aging the curve shifts towards the higher frequencies. Moisture influences the low and the high frequency areas. This curve is compared to model curves to evaluate aging, particularly for assessing the moisture content in the insulation.
8 PROGRAMMING FLOWCHART OF THE ANALYSIS
ALGORITHM
At first the insulation temperature ‗T‘ from the measured dielectric response C (f) is taken and the corresponding permittivity record εpb (f) from the data base.
εtot = 1 – Y
+Yεpb (2)
1 – X + X


εoil εpb
where
εtot = Total permittivity
εoil = Permittivity of oil

εoil = 2.2 – j oil

(3)
ε0ω
―(2)‖, from the XY-model combines this permittivity record εPB (f) with the complex oil permittivity εOil (f) from ―(3)‖. The XY-model allows for the computation of the dielectric response of a linear multilayer-dielectric, where X represents the ratio of barriers to oil and Y the ratio of spacers to oil. The obtained modeled permittivity εm (f) = εtot (f) is converted into a modeled capacitance Cm (f) and then compared to the measured dielectric response C (f). The modeled capacitance Cm (f) with the best fitting to the measured capacitance C (f) gives the moisture content in cellulose and the oil conductivity of the real transformer.
9 OBJECTIVES OF CURRENT TRANSFORMER
DIELECTRIC RESPONSE ANALYSIS
In total 100 current transformers of 245 kV and 420 kV have been tested using Dielectric Response Analyzer. This testing has been done with the aim
1) To use advanced techniques such as Frequency Domain Spectroscopy (FDS) and Polarization And Depolarization current (PDC) technique for dielectric diagnosis of current transformer insulation.
2) To analyze dielectric response and characteristics of insulation at different stages of manufacturing.
3) To validate FDS and PDC results with existing conventional measurement techniques.
4) To establish data which can help to predict the life and health of Current transformers.
International Journal of Scientific & Engineering Research, Volume 3, Issue 11, November-2012 6
ISSN 2229-5518
5) To establish a standard reference curve at each stage of manufacture.
10 DETAILED DIELECTRIC RESPONSE ANALYSIS OF
CURRENT TRANSFORMER
The dielectric response is a unique characteristic of the particular insulation system. The degradation and increased moisture content of the insulation results in a changed dielectric model and, consequently, a changed dielectric response. By measuring the dielectric response of the equipment in a wide frequency range, the moisture content, oil conductivity and various dielectric properties like tan delta, power factor ,capacitance can be assessed and the insulation condition can be diagnosed. For the purpose of evaluation of Dielectric Response of Current Transformers we have divided the entire manufacturing process in to ‗four‘ stages. These are as follows
1) Stage A – After complete assembly and before autoclave.
2) Stage B - Just after autoclave.
3) Stage C – After settling time.
4) Stage D – After final testing.
1 Stage A: (Before Autoclave)
In this stage, current transformer is assembled. Only paper insulation is present inside transformer. As current transformer is exposed to atmospheric condition and human interference during assembly, the moisture content is relatively high.
2 Stage B: (Just after Autoclave)
This stage is divided into two parts: Heating and Drying process for paper insulation and its impregnation with oil. The assembled CT is heated at around 100 degree Celsius and then drying is carried out. In drying process, the paper insulation is dried under vacuum and water content inside the paper is removed. Vacuum must be maintained to prevent paper degradation. Further the dried paper is impregnated with oil to obtain excellent dielectric properties. Impregnating oil should be dried (water < or =
5ppm) and degassed (gas <0.3%) in order to achieve good insulation quality, high dielectric strength and low dielectric losses. During the impregnation process, the precise control of temperature, vacuum and time is followed.
3 Stage C: (After settling time)
Current Transformer after autoclave process is allowed to cool down. The bubbles present in insulating oil are settled down during settling time. The oil is completely soaked by paper and moisture is removed.
4 Stage D: (After final testing)
After settling time, the CT is taken to laboratory for final HV testing. Different tests such as Capacitance & tan delta measurement, Partial discharge measurement are carried out in HV testing.
11 RESPONSE CURVE FOR OIL-IMPREGNATED PAPER
Fig is the response curve for oil-impregnated paper. This curve shows a frequency vs. dissipation factor relationship. The higher frequencies display the moisture and aging of the cellulose. Moisture influences the low and the high frequency areas. The linear, middle section of the curve with the steep gradient reflects oil conductivity. Insulation geometry conditions determine the ―hump― which is located to the left side of the steep gradient. Moving from left to right the frequency is reduced and the oil conductivity properties are displayed. In the millihertz range, the insulation geometry comes into play. As the moisture properties of the cellulose change so does the shape of the curve.
. With improvement in technologies, we can now
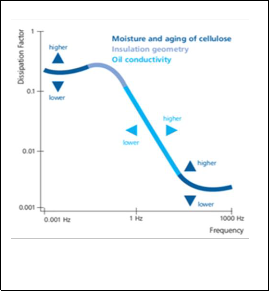
use two well-established dielectric response measurement techniques FDS and PDC together. The actual response obtained by FDS and PDC measurement can be compared with this response curve of oil impregnated paper in order to assess the status of insulation.
Fig.7 . Factors affecting the frequency dependent dissipation factor
International Journal of Scientific & Engineering Research, Volume 3, Issue 11, November-2012 7
ISSN 2229-5518
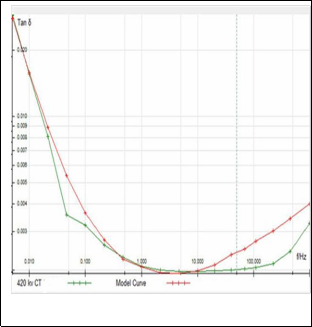
12 CURVES OBTAINED IN RESPECTIVE STAGE BY MEASUREMENT OF 245 KV & 420 KV CURRENT TRANSFORMER
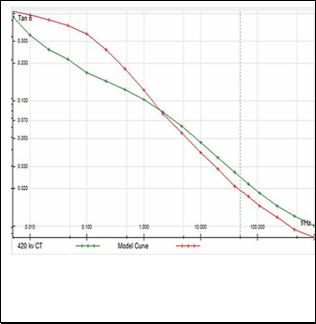
Fig.8 . Curve obtained for stage A
Fig.10 . Curve obtained for stage C
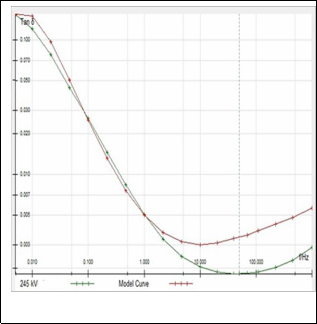
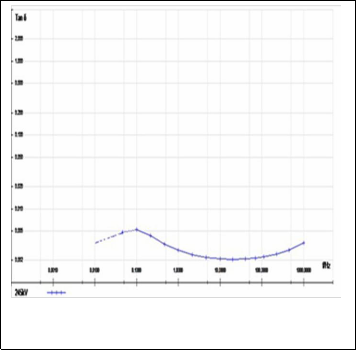
Fig. 9. Curve obtained for stage B
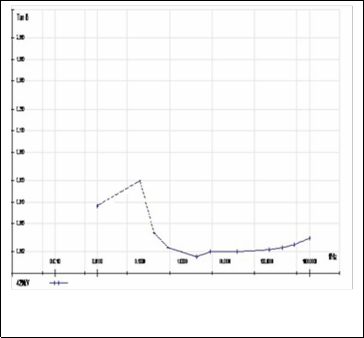
Fig. 11. Curve obtained for stage D
International Journal of Scientific & Engineering Research, Volume 3, Issue 11, November-2012 8
ISSN 2229-5518
13 COMPARISON OF RESPONSE CURVE FOR OIL IMPREGNATED PAPER WITH CURVES OBTAINED IN EACH STAGE.
The curve obtained in each stage was compared with ―2‖, The observation for each stage is given below the respective figure.
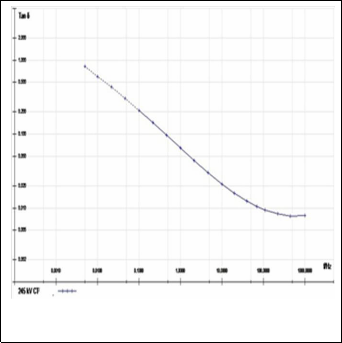
Fig.13 Typical response of a curve for stage B
Fig. 12. Typical response of a curve for stage A
For the CT tested in stage ‗A‘, the above
comparison leads to the following points:
1) The plot of dissipation factor via frequency is a typical S
shaped curved.
2) The stage A represents the stage after complete assembly and before oil filling on account of which the oil conductivity has no effect on Response curve. Hence we get a steep gradient in middle portion of the curve.
3) Here CT is exposed to external environment such as
moisture and Human interface on account of which the moisture content is observed to be high, typically more than 2.2% which is characterized as ―wet‖.
4) In this stage, the dielectric strengthening is not carried out. Moreover the Job is exposed to the external environment and hence the value of tan delta obtained is typically high.
5) Due to the higher moisture content the lower region of
the curve is shifted upwards which indicates high presence of moisture in the insulation. This agrees with the Response curve of oil impregnated paper.
For the CT tested in stage ‗B‘, the above comparison leads to the following points:
1) The stage B represents the stage just after the autoclave process. Here the CT is filled with oil and subjected to vacuum drying process.
2) Due to vacuum drying and oil filling the oil conductivity has an effect on the middle portion of the curve. It causes the curve to shift either to the left or to the right depending oil conductivity being low or high respectively.
3) As seen in the above curve the middle portion has shifted to the left. By comparing this with the curve for oil impregnated paper we can say that the oil conductivity is low.
4) The vacuum drying leads to moisture removal on account of which the lower region of the curve is shifted downwards indicating lower moisture content typically less than 2.2% which is characterized as ―dry‖.
5) Due to the dielectric strengthening, the values obtained for tan delta are much lower as compared to stage ‗A‘ values. This is observed in the graphs of Stage ‗A‘ and Stage ‗B‘ shown below. It shows gradual improvement in the insulation quality.
International Journal of Scientific & Engineering Research, Volume 3, Issue 11, November-2012 9
ISSN 2229-5518
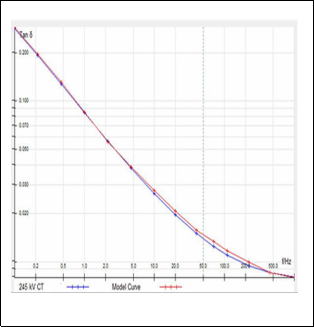
For the CT tested in stage ‗D‘, the above comparison leads to the following points:-
1) The stage ‗D‘ represents the stage after final testing.
2) In this stage the moisture content and oil conductivity
tend to be very low.
3) The insulation is characterized as ‗dry‘.
4) The values of capacitance and tan delta obtained from the response curve were compared with the actual laboratory results. The results arrived at closely matched with the actual testing for the product
14 VERIFICATION OF MEASURED RESULTS WITH
LABORATORY RESULT
From the above curves it is observed that the value of tan delta decreases for Stage ‗A‘ to Stage ‗D‘ and the moisture content also reduces which agrees with the measured laboratory test results.
Fig. 14 . Typical response of a curve for stage C
For the CT tested in stage ‗C‘, the above
comparison leads to the following points:-
1) The stage ‗C‘ represents the stage after the settling time. Here the CT is allowed to rest for 2 to 3 days. On account of this the oil gets absorbed in the insulation strengthening it.
2) On account of the insulation strengthening the value of tan delta reduces further as compared to stage ‗B‘. This comparison is shown in the figure below.
3) Also the moisture content being almost negligible the
lower portion of the almost touches the horizontal X axis.
Here the insulation is characterized as ―dry‖.
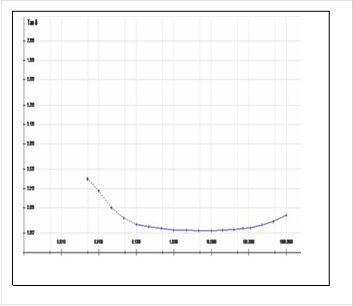
4) The middle portion of the curve representing oil conductivity further shifts towards the lower frequency range indicating very low oil conductivity.
t ‘
) ‗ t t t t
Fig. 15. Typical Curve for Stage 'D'
TABLE 1
COMPARISON BETWEEN MEASURED VALUE AND LABORATORY RESULTS
15 RESULTS
Laboratory Results | Measured Value |
0.00182 | 0.00198 |
0.00302 | 0.00336 |
0.002169 | 0.00224 |
0.002158 | 0.00310 |
0.00180 | 0.00737 |
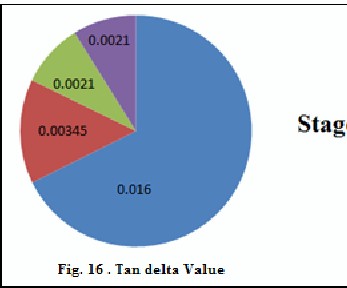
The results of all the stages have been tabulated in the pie chart as follows:-
1) 245 f
In the their r
International Journal of Scientific & Engineering Research, Volume 3, Issue 11, Nove
ISSN 2229-5518
are A, B, C, and D. The value occupied by stage ‗A‘ is largest in the pie chart. In this stage the CT is exposed to human interface the moisture content is very high. The value of tan delta for stage ‗A‘ lies between 0.013 to 0.019. These high values of tan delta can be accounted for the fact that tan delta value depends on the moisture content and hence the values are very high in this stage. For stage ‗B‘ the value of tan delta for stage B lies between 0.004 to
0.0029 which is true since the value of moisture is quite low
in this stage. Also the oil conductivity is good in this stage since CT is just removed from autoclave. In stage ‗C‘ the value of tan delta is between 0.0020 to 0.0022 and it is true since value of moisture is quite low due to vaccum removal process. For stage ‗D‘ the CT is tested and hence there is no change in moisture content and value of tan delta as compared to stage ‗C‘. The value of tan delta lies between
0.0020 to 0.0022 and oil conductivity is very good.
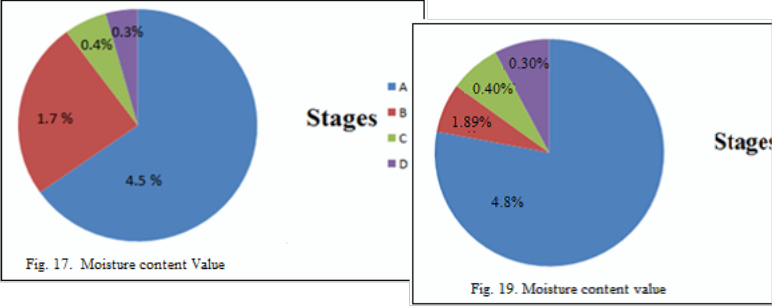
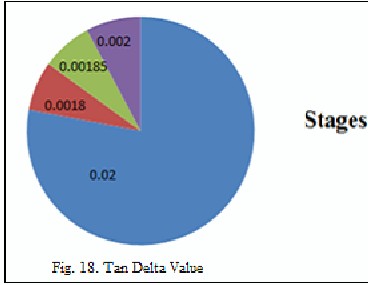
In the following pie chart the values of tan delta along with their respective stages are indicated. The different stages are A, B, C, and D. The value occupied by stage ‗A‘ is largest in the pie chart. In this stage the CT is exposed to human interface the moisture content is very high. The value of moisture for this stage is between 2.2% to 4.8% which is characterized as ‗wet‘ according IEC 60422. No oil is present in the current transformer in this stage and hence the oil conductivity is nil. For stage ‗B‘ the value of moisture is less than 2.2% which is characterized as dry. This is evident since in stage ‗B‘ the moisture is removed during vaccum process. Also the oil conductivity is good in this stage. In stage ‗C‘ the moisture is completely removed and oil conductivity is quite good. For stage ‗D‘ the CT is tested and hence there is no change in moisture content and t t l
2) f
For a 420 kV CT the following results have been tabulated in the form of pie chart. In the following pie chart the values of tan delta along with their respective stages are indicated. The different stages are A, B, C, and D. The value occupied by stage ‗A‘ is largest in the pie chart. In this stage the CT is exposed to human interface the moisture content is very high. The value of tan delta for stage ‗A‘ lies between 0.01 to 0.03. These high values of tan delta can be accounted for the fact that tan delta value depends on the moisture content and hence the values are very high in this stage. For stage ‗B‘ the value of tan delta for stage B is approximately 0.0018 which is true since the value of moisture is quite low in this stage. Also the oil conductivity is good in this stage since CT is just removed from autoclave. In stage ‗C‘ the value of tan delta is between to 0.0019 and it is true since value of moisture is
w due to vaccum removal process. For stage ‗D‘ the t t lt t
In the following pie chart the values of tan delta along with their respective stages are indicated. The
International Journal of Scientific & Engineering Research, Volume 3, Issue 11, November-2012 11
ISSN 2229-5518
different stages are A, B, C, and D. The value occupied by stage ‗A‘ is largest in the pie chart. In this stage the CT is exposed to human interface the moisture content is very high. The value of moisture for this stage is 4.8% which is characterized as ‗extremely wet‘ according IEC 60422. No oil is present in the current transformer in this stage and hence the oil conductivity is nil. For stage ‗B‘ the value of moisture is less than 2.2% which is characterized as dry. This is evident since in stage ‗B‘ the moisture is removed during vaccum process. Also the oil conductivity is good in this stage. In stage ‗C‘ the moisture is completely removed and oil conductivity is quite good. The value of moisture is less than 2.2% for this Stage ‗C‘. For stage ‗D‘ the CT is tested and hence there is no change in moisture content as compared to stage ‗C‘. The value of moisture is less than
2.2%. The oil conductivity is very good in this stage.
15 CONCLUSIONS
After studying the various dielectric response of CT
we come to a conclusion that:-
1) The FDS and PDC techniques being nondestructive in nature are used to measure tan delta and capacitance over wide range of frequencies and at lower voltage to assess the health of CT.
2) A reference curve has been set for each stage of CT
manufacturing.
3) These curves can be used as standard reference curves to predict whether there has been any detrimental effect on the CT health and insulation.
4) FDS and PDC techniques are most effective in analyzing the insulation characteristics of CT as compared to other conventional test which require more time and infrastructure.
5) The measurement done by FDS and PDS are at par with measurement done by conventional way.
6) The Dielectric response analyzers being very compact can replace the conventional laboratory analysis techniques
7) This technique has very quick response as compared to the conventional tech.
It thus can be concluded that the PDC and FDS techniques should be implemented in remote substations and also production process for the above stated merits.
17 REFERENCES
[1]. Kamaraju Naidu, High Voltage Engineering
(ISBN: 9780070669284).
[2] J.B Gupta, Electric power (ISBN: 8188458538).
[3] Malik Koch, Michael Kruger, Manish Gupta. (Energy)
―A Fast and reliable dielectric diagnostic method to determine moisture in Power Transformer.‖
[4] E. Gockenbach ―Diagnosis of Power Transformer Insulation Institute of Electric Power Systems‖, Schering- Institute, University of Hannover
[5] Maik Koch, ―Reliable Moisture determination in power
Transformer‖
[6] Walter S. Zaengl., ―Applications of Dielectric Spectroscopy in Time and Frequency Domain for HV Power Equipment.‖
[7] Walter S. Zaengl. ―Dielectric Spectroscopy in Time and Frequency Domain for HV Power Equipment, Part I Theoretical Considerations‖. Swiss Federal Institute of Technology (ETH), Zurich, Switzerland.
[8] T. K. Saha, Senior Member IEEE, R. Middleton Fellow, IEEE and A. Thomas Member IEEE, ―Understanding Frequency & Time Domain Polarization Methods for the Insulation Condition Assessment of Power Transformers‖.


Abhishek Joshi received his B.E in electrical engineering from K.K Wagh College of Engineering Education and Research (Nasik) India in 2012. He was University rank holder (9th in Pune University). He is an IEEE student member. His interest includes Power systems, control systems and EHV.
Pooja Aaradhi received her B.E in electrical engineering from K.K Wagh College of Engineering Education and Research (Nasik) India in 2012. She has been consistently University topper for consecutive three years. Her interests include Power systems, Switchgear protection and power electronics.