International Journal of Scientific & Engineering Research, Volume 6, Issue 5, May-2015 96
ISSN 2229-5518
Development of Rainfall Intensity Duration Frequency (R-IDF) Equations and Curves for Seven Divisions in Bangladesh
Munshi Md. Rasel, Sayed Mukit Hossain
Abstract— Due to proliferation in greenhouse gases hydrologic cycle is changing day by day which is causing variations in intensity, duration and frequency of rainfall events. By pinpointing the potential effects of climate change and acclimating to them is one way to reduce urban susceptibility. Since rainfall characteristics are often used for planning and design of various water resources project, reviewing and updating rainfall characteristics (i.e., Intensity–Duration–Frequency (IDF) curves) for future climate situations is necessary. The target of this study was to develop Rainfall IDF empirical equations and curves for seven divisions of Bangladesh to estimate the rainfall intensity for any duration and any return period with least effort. Yearly maximum rainfall data for last 41 years (1974-2014) from Bangladesh Meteorological Department (BMD) was used in this study. Indian Meteorological Department (IMD) empirical reduction formula was used to estimate the short duration rainfall intensity from yearly maximum rainfall data. Gumbel’s Extreme-Value Distribution method was used to develop IDF curves and equations. It was found that intensity of rainfalls decreases with increase in rainfall duration. Further, a rainfall of any given duration will have a larger intensity if its return period is large. In other words, for a rainfall of given duration, rainfalls of higher intensity in that duration are rarer than rainfalls of smaller intensity.
Index Terms— Bangladesh Meteorological Department (BMD), Climate Change, Rainfall Intensity, Gumbel’s Extreme Value Distribution
Method, Rainfall Duration, Rainfall Frequency, Return Period.
1 INTRODUCTION
—————————— ——————————
Rainfall intensity-duration-frequency (IDF) curves are graph- ical representations of the amount of water that falls within a given period of time in catchment areas (Dupont and Allen,
2000) [11]. IDF curves are used to aid the engineers while de- signing urban drainage works. The establishment of such rela- tionships was done as early as 1932 (see Chow (1988) and Dupont and Allen (2006)) [11 & 12]. Since then, many sets of relationships have been constructed for several parts of the globe. However, such relationships have not been accurately constructed in many developing countries (Koutsoyiannis et al., 1998) [13]. In Bangladesh water logging and flood is a common problem during Monsoon period because of inade- quate drainage system. In order to solve this problem new drainage design is needed where rainfall data of different du- ration is needed. But due to instrumental limitation these data were not available. This study was conducted to develop IDF curves and equations for various duration of rainfall in seven divisions (Dhaka, Chittagong, Barisal, Khulna, Rajshahi, Rangpur, Sylhet) of Bangladesh. In the present study, annual maximum rainfall series is considered for Rainfall Frequency Analysis (RFA). Rainfall in a region can be characterized if the intensity, duration and frequency of the diverse storms occur-
————————————————
• Munshi Md. Rasel is working as a lecturer in Ahsanullah University of
Science and Technology, Bangladesh. E-mail: munshimdrasel@gmail.com
• Sayed Mukit Hossain currently pursuing masters degree program inIslam-
ic University of Technology, Bangladesh. He is working as a lecturer in
Ahsanullah University of Science and Technology, Bangladesh. E-mail:
mukit1271@gmail.com
ring at that place are known [1-3]. The frequency-data for rain- falls of various durations, so obtained, can be represented by
IDF curves, which give a plot of rainfall intensity versus rain- fall duration and recurrence interval.
Matin et al. (1984), in their study developed the IDF curve for North-East region Bangladesh and also observed that the rainfall data in this region follow Gumbel’s Extreme Value Distribution [4]. Chowdhury et al. (2007) developed the short duration rainfall IDF curve for Sylhet with return period of 2,
5,10,20,50, and 100 years [5]. Kim et al improved the accuracy of IDF curves by using long and short duration separation technique [6]. They derived IDF curves by using cumulative distribution function (CDF) for the site under consideration using multi-objective genetic algorithm. Khaled et al applied L-moments and generalized least squares regression methods for estimation of design rainfall depths and development of IDF relationships [7]. Rashid et al applied Pearson Type-III distribution for modelling of short duration rainfall and de- velopment of IDF relationships for Sylhet City in Bangladesh [8].
In probability theory, extreme value distributions namely Gumbel, Frechet and Weibull are generally considered for frequency analysis of meteorological variables. On the other hand, Atomic Energy Regulatory Board (AERB) guidelines described that the Order Statistics Approach (OSA) is the most appropriate method for determination of parameters of Gum- bel and Frechet distributions [9]. In this present study Gum- bel’s Extreme Value Distribution method is used to develop IDF curves and equations. In this context, an attempt has been made to estimate the rainfall for different return periods for different durations of ‘n’ such as 10-min, 20-min, 30-min, 60- min, 120-min, 180-min, 360-min, 720-min, 1440-min adopting Gumbel distributions for development of IDF relationships for seven divisions of Bangladesh. Model performance indicators
IJSER © 2015 http://www.ijser.org
International Journal of Scientific & Engineering Research, Volume 6, Issue 5, May-2015 97
ISSN 2229-5518
(MPIs) such as correlation coefficient (R) is used to analyze the performance of the developed IDF relationships by Gumbel distributions for estimation of rainfall intensity for the stations under study.
2 LOCATION
The study area is Bangladesh. Its position is between latitude
20° 34′ - 26° 38′ N, longitude 88° 01′ -92° 41′ E. For the conven-
ience of analysis the study is based on available data of 35
BMD (Bangladesh Meteorological Department) stations which
are compiled into seven divisions of Bangladesh. Past 41 years
data (1974-2014) is used in this study.

P = P 3 t
t 24 24
(1)

UTION
was selected to perform the umbel theory of distribution on for IDF analysis owing to ma. It is relatively simple and um values or peak rainfalls).
e 2, 5, 10, 25, 50 and 100 year period and requires several ion PT (in mm) for each du- od T (in year) is given by the
PT = Pave + KS
Where K is Gumbel frequency factor given by:
(2)
K=-

6 [0.5772 + ln[ln[

T ]]
(3)
π T-1
Where Pave is the average of the maximum precipitation corre- sponding to a specific duration.
In utilizing Gumbel’s distribution, the arithmetic average in
Eq. (2) is used:
1 n
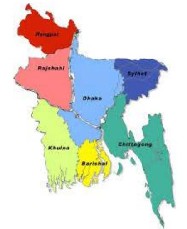
Fig. 1: Seven Divisions of Bangladesh

Pave = ∑ Pi
i =1
(4)
3 DATA COLLECTION AND METHODOLOGY
As demonstrated in this document, the numbering for sections upper case Arabic numerals, then upper case Arabic numerals,
Where Pi is the individual extreme value of rainfall and n is the number of events or years of record. The standard devia- tion is calculated by EQ. (5) computed using the following relation:
separated by periods. Initial paragraphs after the section title are not indented. Only the initial, introductory paragraph has

S=[ 1
n 2
∑ (P − P ) ]1/ 2
(5)
a drop cap.
3.1 ESTIMATION OF SHORT DURATION RAINFALL
Indian Meteorological Department (IMD) use an empirical reduction formula (EQ. 1) for estimation of various duration like 1-hr, 2-hr, 3-hr, 5-hr, 8-hr rainfall values from annual max- imum values. Chowdhury et al (2007), used Indian Meteoro- logical Department (IMD) empirical reduction formula to es- timate the short duration rainfall from daily rainfall data in
n −1 i =1
Where S is the standard deviation of P data. The frequency factor (K), which is a function of the return period and sample size, when multiplied by the standard deviation gives the de- parture of a desired return period rainfall from the average. Then the rainfall intensity, IT (in mm/h) for return period T is obtained from:
Sylhet city and found that this formula give the best estima- tion of short duration rainfall [5]. In this study this empirical formula (EQ. 1) was used to estimate short duration rainfall in

I = Pt
Td
(6)
all the seven divisions of Bangladesh. Where, Pt is the re- quired rainfall depth in mm at t-hr duration, P24 is the daily
rainfall in mm and t is the duration of rainfall for which the
rainfall depth is required in hr.
Where T d is duration in hours.
The frequency of the rainfall is usually defined by reference to
the annual maximum series, which consists of the largest val-
ues observed in each year. An alternative data format for rain-
fall frequency studies is that based on the peak-over threshold
IJSER © 2015 http://www.ijser.org
International Journal of Scientific & Engineering Research, Volume 6, Issue 5, May-2015 98
ISSN 2229-5518
concept, which consists of all precipitation amounts above certain thresholds selected for different durations. Due to its simpler structure, the annual-maximum-series method is more popular in practice [10].
4 RESULT AND DISCUSSION
From the raw data, the maximum rainfall (P) and the statisti- cal variables (average and standard deviation) for each dura- tion (10, 20, 30, 60, 120, 180, 360, 720, 1440 min) were calculat- ed. Various duration of rainfalls like 10, 20, 30, 60, 120, 180,
360, 720 and1440 min were estimated from annual maximum
24 hours rainfall data using Indian Meteorological empirical
reduction formula. These estimated various duration data
were used in Gumbel’s Extreme Probability Method to deter-
mine rainfall (PT ) values and intensities (IT ) for seven divi- sions of Bangladesh. At table 1 rainfall frequency (PT ) values and intensities (IT ) for different durations and return periods
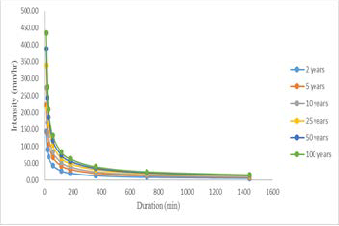
using Gumbel Method for Dhaka Division was computed. Similarly for all other division rainfall frequency (PT ) values and intensities (IT ) for different durations and return periods using Gumbel Method was computed. From Table 2 it was found that intensity of rainfall decreases with increase in storm duration. Further, a rainfall of any given duration will have a larger intensity if its return period is large. In other words, for a rainfall of given duration, rainfalls of higher in- tensity in that duration are rarer than rainfalls of smaller in- tensity. After finding out the rainfall (PT ) values and intensi- ties (IT ) in Fig. 2, 3, 4, 5, 6, 7, 8 Rainfall IDF curves are devel- oped for seven divisions of Bangladesh. Then finally for each division for each return period an equation has been devel- oped, shown in Table 2 to table 8. It was found that the corre- lation coefficient for each equation is 1 which indicates a strong relationship in IDF equations.
Table 1: Computed frequency rainfall (PT ) values and intensities (IT ) for different durations and return periods using Gumbel
Method for Dhaka Division.
10 min (Duration) | 20 min (Duration) | 30 min (Duration) |
Pave | 24.61mm | Pave | 31.00mm | Pave | 35.49mm |
S | 11.12 | S | 14.01 | S | 16.03 |
Tr (year) | K | P T (mm) | IT (mm/hr) | Tr (year) | K | P T (mm) | IT (mm/hr) | Tr (year) | K | P T (mm) | IT (mm/hr) |
2 | -0.164 | 22.78 | 136.70 | 2 | -0.164 | 28.70 | 86.11 | 2 | -0.164 | 32.86 | 65.72 |
5 | 0.719 | 32.60 | 195.60 | 5 | 0.719 | 41.07 | 123.22 | 5 | 0.719 | 47.02 | 94.03 |
10 | 1.305 | 39.11 | 234.68 | 10 | 1.305 | 49.28 | 147.85 | 10 | 1.305 | 56.41 | 112.82 |
25 | 2.044 | 47.33 | 283.97 | 25 | 2.044 | 59.64 | 178.91 | 25 | 2.044 | 68.26 | 136.51 |
50 | 2.592 | 53.42 | 320.52 | 50 | 2.592 | 67.31 | 201.94 | 50 | 2.592 | 77.04 | 154.08 |
100 | 3.137 | 59.48 | 356.87 | 100 | 3.137 | 74.95 | 224.85 | 100 | 3.137 | 85.78 | 171.55 |
60 min (Duration) | 120 min (Duration) | 180 min (Duration) |
Pave | 44.71mm | Pave | 56.34mm | Pave | 64.49mm |
S | 20.20 | S | 25.45 | S | 29.13 |
Tr (year) | K | P T (mm) | IT (mm/hr) | Tr (year) | K | P T (mm) | IT (mm/hr) | Tr (year) | K | P T (mm) | IT (mm/hr) |
2 | -0.164 | 41.40 | 41.40 | 2 | -0.164 | 52.17 | 26.08 | 2 | -0.164 | 59.71 | 19.90 |
5 | 0.719 | 59.23 | 59.23 | 5 | 0.719 | 74.64 | 37.32 | 5 | 0.719 | 85.43 | 28.48 |
10 | 1.305 | 71.07 | 71.07 | 10 | 1.305 | 89.55 | 44.78 | 10 | 1.305 | 102.50 | 34.17 |
25 | 2.044 | 86.00 | 86.00 | 25 | 2.044 | 108.36 | 54.18 | 25 | 2.044 | 124.03 | 41.34 |
50 | 2.592 | 97.07 | 97.07 | 50 | 2.592 | 122.31 | 61.15 | 50 | 2.592 | 139.99 | 46.66 |
100 | 3.137 | 108.08 | 108.08 | 100 | 3.137 | 136.18 | 68.09 | 100 | 3.137 | 155.87 | 51.96 |
360 min (Duration) | 720 min (Duration) | 1440 min (Duration) |
Pave | 81.25mm | Pave | 102.37mm | Pave | 128.98mm |
S | 36.71 | S | 46.25 | S | 58.27 |
Tr (year) | K | P T (mm) | IT (mm/hr) | Tr (year) | K | P T (mm) | IT (mm/hr) | Tr (year) | K | P T (mm) | IT (mm/hr) |
2 | -0.164 | 75.23 | 12.54 | 2 | -0.164 | 94.79 | 7.90 | 2 | -0.164 | 119.42 | 4.98 |
5 | 0.719 | 107.64 | 17.94 | 5 | 0.719 | 135.62 | 11.30 | 5 | 0.719 | 170.88 | 7.12 |
10 | 1.305 | 129.16 | 21.53 | 10 | 1.305 | 162.73 | 13.56 | 10 | 1.305 | 205.02 | 8.54 |
25 | 2.044 | 156.29 | 26.05 | 25 | 2.044 | 196.91 | 16.41 | 25 | 2.044 | 248.08 | 10.34 |
50 | 2.592 | 176.40 | 29.40 | 50 | 2.592 | 222.25 | 18.52 | 50 | 2.592 | 280.02 | 11.67 |
100 | 3.137 | 196.41 | 32.73 | 100 | 3.137 | 247.46 | 20.62 | 100 | 3.137 | 311.77 | 12.99 |
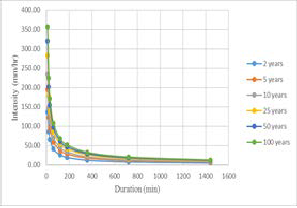
Fig. 2: Rainfall IDF curve for Dhaka Division
IJSER © 2015 http://www.ijser.org
International Journal of Scientific & Engineering Research, Volume 6, Issue 5, May-2015 99
ISSN 2229-5518
Table 2: Rainfall IDF empirical equation for respective return
period and their correlation coefficient, R for Dhaka Division
Table 5: Rainfall IDF empirical equation for respective return period and their correlation coefficient, R for Rajshahi Division
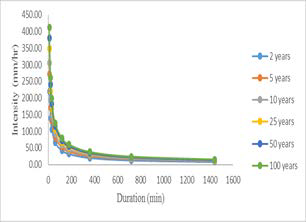
Fig. 3: Rainfall IDF curve for Sylhet Division
Table 3: Rainfall IDF empirical equation for respective return period and their correlation coefficient, R for Sylhet Division
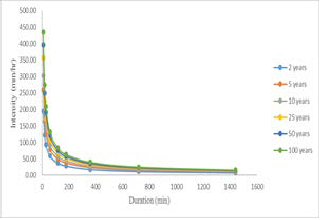
Fig. 5: Rainfall IDF curve for Rangpur Division
Table 4: Rainfall IDF empirical equation for respective return period and their correlation coefficient, R for Rangpur Divi- sion
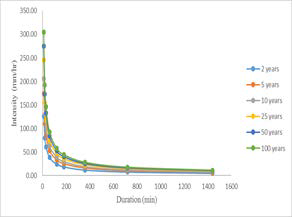
Fig. 4: Rainfall IDF curve for Rajshahi Division
IJSER © 2015 http://www.ijser.org
International Journal of Scientific & Engineering Research, Volume 6, Issue 5, May-2015 100
ISSN 2229-5518
Fig. 6: Rainfall IDF curve for Khulna Division
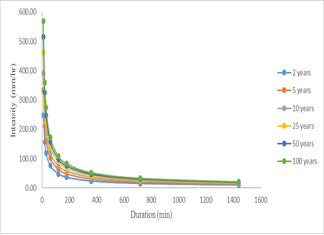
Table 6: Rainfall IDF empirical equation for respective return period and their correlation coefficient, R for Khulna Division
Return Peri- od (yr) | Equation | Correlation Coeffi- cient, R |
2 | y = 665.27x-0.667 | 1 |
5 | y = 1028.8x-0.667 | 1 |
10 | y = 1270x-0.667 | 1 |
25 | y = 1574.3x-0.667 | 1 |
50 | y = 1799.9x-0.667 | 1 |
100 | y = 2024.2x-0.667 | 1 |
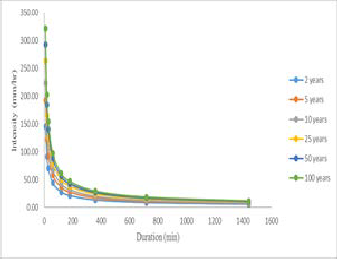
Fig. 8: Rainfall IDF curve for Chittagong Division
Table 8: Rainfall IDF empirical equation for respective return period and their correlation coefficient, R for Chittagong Divi- sion
Fig. 7: Rainfall IDF curve for Barisal Division
Table 7: Rainfall IDF empirical equation for respective return period and their correlation coefficient, R for Barisal Division
5 CONCLUSIONS
This research presents some insight into the way in which the rainfall is estimated in Bangladesh. Since Bangladesh has dif- ferent climatic conditions from division to division, a relation for each division has to be obtained to estimate rainfall intensi- ties for different durations and return periods ranging be- tween 2 and 100 years. The parameters of the design rainfall intensity for a given period of recurrence were estimated for each division in this study. The results obtained showed a good match between the rainfall intensity computed by the method used and the values estimated by the calibrated for- mula with a correlation coefficient of greater than 0.98. This indicated the goodness of fit of the formula to estimate IDF curves in the region of interest for durations varying from 10 to 1440 min and return periods from 2 to 100 years. This study will be helpful in many design problems related to watershed management, such as runoff disposal and erosion control, it is necessary to know the rainfall intensities of different durations and different return periods.
6 ACKNOWLEDGEMENT
Authors are indebted to the Bangladesh Meteorological De- partment (BMD) for providing the necessary meteorological data.
IJSER © 2015 http://www.ijser.org
International Journal of Scientific & Engineering Research, Volume 6, Issue 5, May-2015 101
ISSN 2229-5518
7 REFERENCES
[1] Burlando P and Rosso R. Scaling and multi-scaling models of depth-duration-frequency curves for storm precipitation. Journal of Hydrology. 1996; 187(1&2):45-64.
[2] Koutsoyiannis D, Kozonis D and Manetas A. A mathemati- cal framework for studying rainfall intensity- duration- frequency relationships. Journal of Hydrology. 1998;
206(1&2):118-135.
[3] Bougadis J and Adamowski K. Scaling model of a rainfall
intensity-duration-frequency relationship. Hydrological Pro-
cess. 2006; 20(17):3747–3757.
[4] Matin M. A. and Ahmed S. M. U. 1984 Rainfall Intensity
Duration Frequency Relationship for the N-E Region of Bang-
ladesh. Journal of Water Resource Research. 5(1).
[5] Chowdhury R., Alam J. B., Das P. and Alam M. A. 2007.
Short Duration Rainfall Estimation of Sylhet: IMD and USWB
Method. Journal of Indian Water Works Association. pp. 285-
292.
[6] Kim T, Shin J, Kim K and Heo J. Improving accuracy of IDF
curves using long- and short duration separation and multi-
objective genetic algorithm. World Environmental and Water
Resources Congress. 2008, 1-12.
[7] Khaled H, Ataur R, Janice G and George K. Design rainfall
estimation for short storm durations using L-Moments and
generalized least squares regression-Application to Australian
Data. International Journal of Water Resources and Arid Envi-
ronments. 2011; 1(3):210-218.
[8] Rashid MM, Faruque SB and Alam JB. Modelling of short
duration rainfall intensity duration Frequency (SDRIDF) equa-
tion for Sylhet City in Bangladesh. ARPN Journal of Science and Technology. 2012; 2(2):92-95.
[9] Atomic Energy Regulatory Board (AERB), Extreme values of meteorological parameters (Guide No. NF/SG/S-3), 2008. [10] Borga, M., Vezzani, C., Fontana, G.D. 2005. A Regional Rainfall Depth–Duration–Frequency Equations for an Alpine Region, Department of Land and AgroForest Environments, University of Padova, Legnaro 35020, Italy, Natural Hazards, vol. 36, pp. 221–235.
IJSER © 2015 http://www.ijser.org