International Journal of Scientific & Engineering Research Volume 2, Issue 12, December-2011 1
ISSN 2229-5518
Developing Geo-web portals with Google Map
API- A Case study of the Fichtner Group
N.D. Tagoe, S. Mantey
Abstract - The main objective of this paper was to research the use of Web 2.0 techniques and freely available geospatial tools as a base for informa- tion-focused applications. The investigation was conducted, based on a prototype development of a project portal for the Fichtner Group. The methods adopted include; developing both server and client-sides of the application with Adobe Flex Builder. Toad for Oracle was used to administer and maintain the Relational Database Management System (RDBMS). The server-side programming language was Java whilst ActionScript was used to create the client logic. MXML was used to describe the user interface and behaviour. The Application Programming Interface (API) used for developing the applica- tion was the Google MAP API for Flash (Flex). This Flex technology is not only applicable to the development of commercial web portals but can also be used to develop platforms for the purpose of disaster management, e-agriculture or to create awareness about the effects of climate change. The devel- oped portal provides sufficient information about Fichtner projects and locations worldwide. It aims at portraying the achievements and capabilities of the Group to prospective clients.
Keywords— Project portal, Web 2.0, Google Maps API, Rich Internet Application (RIA), Geospatial tools, Flex technology.
—————————— ——————————
1 INTRODUCTION
eb 2.0 is the term that some web developers have given to the current crop of web services and content provid- ers which emphasize an increase in interactivity be-
tween the web users and the particular content in question. Coupled with the increased use of Broadband Internet facili- ties and much faster computers, the range of hitherto desktop applications being migrated to the Internet is growing by the day.
With the release of the Google Maps API and other freely
available geospatial tools over the past six to seven years, spa-
tial information is now available to all Internet users at the
click of a button. This implies that the use of spatial informa-
tion and its positive impact on information quality is more and
more recognized
The purpose of the project portal is to showcase the past and
current projects of the Fichtner Group to clients. The Group is
made up of interdisciplinary consulting engineers and project
managers and has 26 subsidiaries and associated companies
with a network of more than 70 branches and project offices in
over 50 countries. The project portal provides sufficient infor-
mation about Fichtner activities, projects and locations (offices
and project sites) worldwide in order to portray their capabili-
ties and achievements to prospective clients and also attract
competent professionals to join the Group.
A web portal is a special website designed to act as a gateway
giving convenient access to other related sites [1]. Generally,
there are two major types of portals; horizontal and vertical.
Web sites such as Yahoo and Google are referred to as horizon-
————————————————
N. D. Tagoe is currently an assist. lecturer at the University of Mines and
Technology, Department of Geomatic Engineering, Tarkwa, Ghana.
S. Mantey is currently a lecturer at the University of Mines and Technolo- gy, Department of Geomatic Engineering, Tarkwa, Ghana.
tal portals because they are used by a broad base of users, while vertical portals are content specific, geared towards a particular audience [2]. An example of a vertical web portal is a sport portal.
Web portals are not necessarily spatially enabled. Spatially enabled web portals or geo-web portals have some kind of geographical information associated with them. An example of such a portal was developed as a master thesis: ‚Design and Implementation of a portal site for Olympic Games 2008 in Beijing using Google Maps‛ for guiding visitors to Beijing dur- ing the ISPRS Congress and the Olympic Games [3]. Major technologies utilized in developing this portal included Ajax (Asynchronous JavaScript and XML), PHP (PHP Hypertext Preprocessor) and the Google Maps JavaScript API.
Another interesting example of a geo-web portal is the GIS
Portal Aalen ‚Geodatenportal der Stadt Aalen‛. This portal
provides both spatial and non-spatial information such as a
city map, landscape plan and information on tourism about a
city in Germany called Aalen. The portal was built completely
in a Flex environment using the Flex Builder software.
In this research, a prototype project portal was developed and
implemented as an Internet based application.
2 INTERNET GIS
Internet GIS is a network based branch of GIS that provides access to geographic information, spatial tools and GIS Web Services using wired and wireless Internet [4]. The communi- cation model for Internet GIS is the client/server approach. In this approach, the client sends a request to the server and the server in turn sends a response back to the client. Fig. 1 illu- strates a typical client/server communication.
IJSER © 2011
http://www.ijser.org
International Journal of Scientific & Engineering Research Volume 2, Issue 12, December-2011 2
ISSN 2229-5518
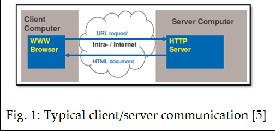
An example of such a client/server communication (request and response) could be a client request for driving direction received and processed on the server-side (for example, the Google server), after which the results is sent back and visua- lized on the client-side in a browser. In the client/server ap- proach, the type of client or server depends on how the total work of the application is apportioned between the client and server. If most of the application’s functionality is executed in the server, then the server of such an application is called a thick server and its client, a thin client. On the other hand, if most of the logic is being performed on client-side, then the client of the application is called a thick client and its server, a thin server [6].
In this research, the client and server of the portal are a thin client and a thick server respectively because the main logic of the application is executed on the portal’s server-side. The client is mostly used as a user interface - its functionality is restricted to data visualization and minimum GIS functions like zooming and panning.
3 IMPACT OF INTERNET ON GIS
The impact of the Internet on GIS is tremendous. The Internet is affecting GIS in three major areas [7]: GIS data access, spa- tial information dissemination and GIS modelling/processing. The Internet provides easy data access from different sources. For example, Google provides a free web mapping service application that provides a wide coverage of satellite data worldwide but unfortunately the quality and date validity of the data provided is not guaranteed. Also, because the Internet is open to all, it enables quick circulation of spatial informa- tion to a much wider audience than the traditional desktop GIS which always requires installation of GIS software on the user’s local machine. Finally, the Internet serves as a channel to access many online GIS processing tools. For example, the ArcGIS JavaScript extension for the Google Maps API has a tool for estimating population. This geoprocessing tool allows users to digitize an area on Google map as a polygon to esti- mate the number of people within that area.
4 ADVANTAGES OF INTERNET GIS OVER DESKTOP GIS
Unlike the traditional Desktop GIS, Internet GIS does not re- quire installation of a proprietary GIS software program on the computer of the user. The only requirements are for the user to have knowledge of the web site which provides the needed GIS service and access to Internet services. Internet access is increasingly becoming more diverse and new genera-
tion of mobile phones have extremely fast access to the Inter- net. Coupled with the fact that the new generation of phones has wider screens and highly capable hardware, it is now possible for field agents to collect and upload spatial data to a central database right from the field. This translates to almost real-time access of spatial data for relevant users of such data. Database Administrators have more control on datasets that are available to clients. Internet GIS has emerged as an inter- esting research and application field in GIS whose overwhelm- ing capabilities are yet to be fully discovered. This is more so, with the advent of Rich Internet Applications (RIAs), Web Map Services and Map APIs.
5 OBJECTIVES
The objectives of the research include;
1. To develop a spatially enabled portal based on a suitable
Web 2.0 technology which has the capability of displaying data on the Fichtner Group offices and project sites world- wide, enabling users to access and retrieve data using vari- ous search criteria such as project category and country. Also, it will showcase previous and ongoing projects of the Fitchner Group.
2. To design a new database purposely for the portal. This was implemented with data primarily obtained from exist- ing Fichtner databases.
3. To develop a simple and interactive way to geocode all
Fichtner locations.
6 SOFTWARE AND PROGRAMMING LANGUAGES
Two Software packages were used in the development of the portal. These were Toad for Oracle and Adobe Flex Builder. Toad for Oracle is an effective, efficient and reliable tool for querying, reporting, writing and debugging code and admi- nistering Oracle database. In this research, the Oracle databas- es used was ORACLE 10g. Adobe Flex Builder was the Inte- grated Development Environment (IDE) of choice for the three programming languages used because of its productivity and ease during development.
In developing the portal, the three main programming lan- guages used were Java, MXML and ActionScript. Java, a ro- bust object-oriented programming language was used for server-side programming. MXML, a declarative XML (eXtens- ible Mark-up Language) was used to describe the user inter- face and behaviour of the portal while ActionScript, another object-oriented programming language was used to create the client logic.
7 DATA
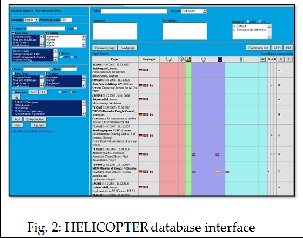
The data utilized for the development of the portal was mainly derived from two sources: project details derived from the HELICOPTER database of the Fichtner Group (see Fig. 2) and geocoded locations (longitudes and latitudes)
The HELICOPTER database is a confidential centralized
IJSER © 2011
http://www.ijser.org
International Journal of Scientific & Engineering Research Volume 2, Issue 12, December-2011 3
ISSN 2229-5518
project reference database of the Fichtner Group, updated on a daily basis. The acronym HELICOPTER stands for HELpful Information System and Communication Tool OPTimized for Easy Research. It contains detailed information of all projects carried out by the Fichtner Group.
The HELICOPTER database contains almost all the important information on projects and offices but lacks adequate spatial information. Spatial information for the portal was obtained through geocoding of Fichtner locations.
In view of the need to geocode several locations; a simple and interactive geocoder - Fichtner Geocoder - was developed to handle the geocoding functionality of the portal.
8 METHODOLOGY
8.1 Selecting the Most Suitable Technology
In the process of investigating the use of various Web 2.0 tech- niques and freely available geospatial tools, a couple of factors were considered and a decision made to use the Google maps API for Flash. A summary is discussed below.
Rich Internet Application: A Rich Internet Application is a web application that offers responsiveness, ‘rich’ features and functionality approaching that of traditional desktop applica- tions [8]. RIAs are easily deployed because there is no need to install the application on the client. It also easily connects to other services on the Internet. Subsequent updates to RIAs are done on the server-side and users immediately have access to the updated version. That is not the case with traditional desk- top applications. For updates to be done to desktop applica- tions, whether minor or major, patches or completely new in- stallations are required on the client-side. From the foregoing, it can be deduced that the developer of an RIA has more con- trol on how his/her application is used. At any point in time, the developer has the assurance that all users of his applica- tion are using the same version. Desktop application develop- ers are faced with a problem of getting all users to use the most up-to-date version of their desktop application. Traditional web applications operate on the concept of web pages. Every user interaction requires the loading of a new page, even in instances where the contents are similar, i.e. The
HyperText Transfer Protocol (HTTP) requests from web users to the web servers are treated as independently as possible. The HTTP was designed to be a stateless protocol. Therefore, the responsibility of ensuring that web users progress from page to page lies with the web developer. Various attempts have been made to remedy this seeming shortcoming of the traditional HTTP request with varying levels of success. One popular strategy is known as session management. Session management is used by web developers to make the stateless HTTP protocol support session state. Session state is a collec- tion of user-defined session variables, which are persisted dur- ing a user session [9]. A session ID is used to identify a par- ticular session. At the client end, a user session is identified either by a cookie or by encoding the session ID in the URL itself. This strategy only works provided that cookies are not turned off on the client's browser. In spite of these advances, there remains some amount of latency between when a re- quest is sent to the web server and when a response is re- ceived, even on the fastest of Internet connections.
Four modern RIA technologies considered in this research were Adobe Flex, AJAX, JavaFX and Microsoft Silverlight. Adobe Flex was selected among other reasons because, there were no known freely available spatial tools based on Micro- soft Silverlight and JavaFX. AJAX applications invariably fail to work if the browser has JavaScript disabled. Additionally, RIAs built with AJAX may have to be modified in order for it to work on all major browsers and operating system.
Adobe Flex has the added advantage of cross platform and browser compatibility, suitability for intensive user interaction and rich in dynamic media effect. Finally, Flex applications can easily be developed into a desktop application by publishing the application with Adobe Air.
Although RIAs developed in a Flex environment required the installation of the Adobe Flash Player, this challenge did not pose much problem because of the current age of high speed Internet connectivity. A survey conducted in July 2011 by Millward Brown and commissioned by Adobe Systems Inc., revealed that the Adobe Flash Player is installed on over 97% of Internet-enabled desktops in mature markets (see Fig. 3).
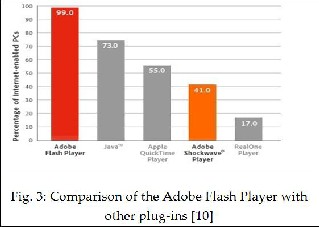
The mature markets as specified in this survey were United States of America, Canada, United Kingdom, France, Germa- ny, Japan, Australia, and New Zealand.
IJSER © 2011
http://www.ijser.org
International Journal of Scientific & Engineering Research Volume 2, Issue 12, December-2011 4
ISSN 2229-5518
Geospatial Tools: Google Maps, Yahoo! Maps and Microsoft Live Search Maps were the three freely available spatial tools considered for developing the portal. Google Maps API was settled upon for the following reasons.
Firstly, Google provides the highest geocoding query limit per
IP address per day. In this research work, geocoding was very
important to locate the positions of various Fichtner offices
and project sites. Also, Google as a web service is much more
popular and has a friendlier interface than Yahoo and Micro-
soft Live. Finally, the Maps API provided by Google is well
documented.
8.2 Architecture of the Portal
The architecture of the portal is a three-tier. The user interface, business logic and data storage were developed and main- tained as independent modules (see Fig. 4).
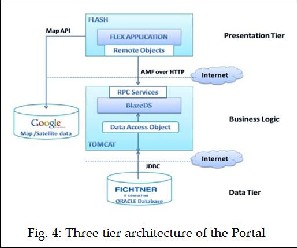
The presentation tier is made up of the Adobe Flash Player running in the browser and the Flex application. This tier is responsible for displaying the application's user interface and executing any client-side logic that is needed to control the application. It communicates with the business logic by send- ing and loading data in a binary format known as the Action Message Format (AMF) through a protocol known as Remote Procedure Call (RPC).
The business logic sits between and conveniently separates the presentation tier from the data tier. By using a Data Access Object (DAO), the business logic provides access to the data- base through the use of a suitable database oriented middle- ware known as Java Database Connectivity (JDBC). The Bla- zeDS provides data services known as RPC services by com- municating with the Flex application through a technology known as Flash remoting. Both the DAO and the BlazeDS run in a Java application server (in this case a TOMCAT) which has a built in Apache web server. Google Maps server is direct- ly accessed from the presentation tier and can be seen as a ser- vice at Google that collects the necessary information from the maps database.
The data tier is responsible for storing, managing and access-
ing the application's data. It was implemented as an Oracle database.
8.3 Implementation of the Flash Remoting
There are two main implementations of Flash remoting pro- vided by Adobe. These include Adobe’s LiveCycle Data Ser- vice ES and BlazeDS. Other party open source implementa- tions of Flash remoting include AMFPHP and AMF-Perl. BlazeDS is an open source implementation of the LiveCycle Data Service ES. It is a server based Java remoting and web messaging technology deployed as a set of JAR files as part of RIA running in a Java application server [11]. It provides a subset of the data services provided by the LiveCycle Data Service ES. The key service or feature of interest for this appli- cation is the RPC Services. The BlazeDS architecture is illu- strated in Fig. 5.
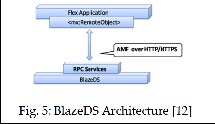
The main reasons for selecting the BlazeDS server for imple- menting the Flash Remoting were:
4. It provides the services (RPC Services) needed to send and retrieve data for the portal.
5. It is free and open source.
An overview of the major differences between the LiveCycle
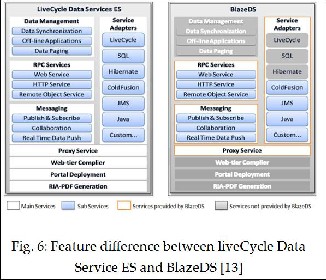
Data Services ES and the BlazeDS is shown in Fig. 6.
IJSER © 2011
http://www.ijser.org
International Journal of Scientific & Engineering Research Volume 2, Issue 12, December-2011 5
ISSN 2229-5518
8.4 Google Maps API for Flash
The Google Maps API for Flash provides an interactive means to embed Google Maps into an RIA. In order to interact with the map, developers need to define map controls and attributes. Events are set up to respond to the map interac- tions, while map overlays are designed to personalize objects (points, lines and areas) that need to be added to customize the map. The Google Maps API is developed for designers and programmers familiar with the Adobe Flash CS3 and Flex en- vironments respectively [14].
Google Maps Flash Controls - Google Maps contain user interface elements known as Map controls that enable users to interact with maps. Developers can either set up their own custom controls using the subclass of the ControlBase class or make use of the built-in controls. Map controls implement the IControl interface. Examples are; PositionControl - a pan con- trol, ZoomControl - a zoom control slider, MapTypeControl - toggle buttons that enable users to change between map types (such as the default map, hybrid and satellite) and Overview- MapControl– an overview map in the corner of the screen [15].
Google Maps Flash Overlay - Overlays are objects on the map that are tied to latitude/longitude coordinates and will move when the map is dragged or zoomed [16]. Through the use of the Map.addOverlay() and Map.removeOverlay() me- thods, custom data can be added and removed from the map respectively. Each overlay extends the IOverlay interface. Ex- amples of overlay supported by the Maps API for Flash in- clude [17];
1. Points - displayed on the map using markers. Default
markers or custom types (custom icons) can be used.
2. Lines - displayed on the map using polylines.
3. Areas - displayed on the map either as polygons (to represent arbitrarily-sized areas) or ground overlays (in a form of an image representing an area).
4. The info window is also a special kind of overlay asso- ciated with the marker click event.
The portal makes use of the markers and info windows to overlay information on location (offices and project sites) and polyline to emphasize specific features. The portal specifically makes use of an encoded type of polyline instead of polygons to define areas, because polylines define the boundaries with lines, whereas polgyons define regions within closed loops and prevent users from viewing the attributes of the feature being emphasized.
Google Maps Flash Services - There are three services provided by the Google Map for Flash. These are the Geocod- ing, Driving direction and Elevation Services. Only the Geo- coding service was utilized for this application. Geocoding is the process of converting addresses (like "Nordbahnhofstrasse
147, Stuttgart") into geographic coordinates (like latitude
48.8017 and longitude 9.1898577), which can be used to place
markers at a location [18].
Google provides two methods of geocoding addresses by ac- cessing the Google servers through the Geocoding Service. These are: static geocoding of known addresses directly over HTTP and the dynamic geocoding of user-defined addresses within an application’s user interface via a client geocoder (ClientGeocoder object) [19]. Two major differences between these two geocoding methods are;
1. The static geocoding request is fully processed at server- side while the dynamic geocoding partially is at client- side.
2. The response of the static geocoding method is provided in one of three following formats depending on what a user specifies. Namely Comma Seperated Values (CSV), Keyhole Markup Language (KML) and JavavScript Ob- ject Notation (JSON). The response of the dynamic geo- coding method is used hand-in-hand with a marker crea- tion function to geocode and display markers of re- quested addresses dynamically on a Google map embed- ded within the application’s user interface. Optionally, the user can also request to review the properties of the marker (Placemarks) as a KML array.
The CSV response has the following parameters; the request status, the accuracy, the latitude and longitude. The KML re- sponse, which is an XML-based language format, is self ex- planatory and provides more information about the geo- coded address than the CSV response. The JSON response is also self-explanatory and provides more information about the geocoded address than the CSV response. JSON is a lightweight computer data interchange format which serves as an alternative to the use of the XML format [20].
Although the content of both geocoding methods is similar, the dynamic geocoding method was chosen for this research because it can be used directly to view the actual position of the marker on the map and at the same time dynamically po- pulate or update a local database with location coordinates.
Google Maps Flash Events - The Google Maps Flash Events are defined using ActionScript 3.0. Events are defined within specific classes that contain an enumeration of all events specific to the Maps API for Flash such as MapEvent [21].
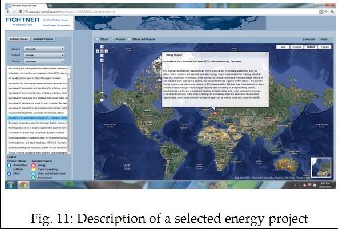
9 RESULTS AND DISCUSSIONS
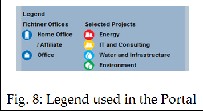
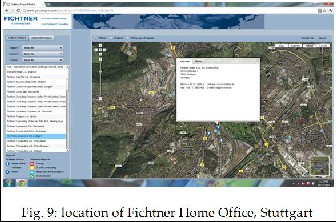
The main outcome of this research was the deployment of the prototype project portal for the Fichtner Group. The portal has two major search possibilities; information on Fichtner related locations and projects. Web users can search for information based on continent and country. Fig. 7 shows the user interface of the portal. Fig. 8 is an illustration of the legend used for the application. Different icons are used to differentiate between a
IJSER © 2011
http://www.ijser.org
International Journal of Scientific & Engineering Research Volume 2, Issue 12, December-2011 6
ISSN 2229-5518
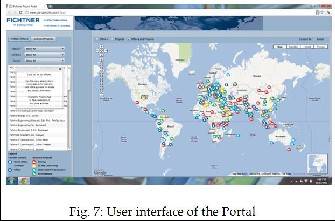
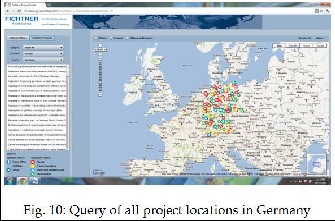
home/affiliate office and ordinary office as well as the project types. These project types include; Energy, IT/Consulting, Wa- ter/Infrastructure and Environment. Fig. 9 shows the address and location of Fichtner Home Office in Stuttgart. Fig. 10 also illustrates a query of all projects undertaken by the Fichtner Group in Germany. Finally, Fig. 11 illustrates a typical descrip- tion of a selected energy project in Germany.
10 CONCLUSIONS
The objectives of this research were achieved, the prototype project portal for the Fichtner Group was developed using the Flex technology. It is user-friendly and incorporates GIS functionalities such as zooming and panning among others. Users of the portal are able to quickly and accurately visualize information about Fichtner offices and project sites worldwide. An auxiliary application, Fichtner Geocoder was also developed to handle all geocoding duties of the Fichtner Group.
The portal was implemented as an Internet based application and was after further development made publicly accessible through the Fichtner website.
Flex technology is the most suitable technology for both commercial and non-profit organizations when building cost effective applications that are meant to be interactive, cross- platform and compatible with all browsers. Applications built with Flex technology support standard protocols and APIs and offer better user experience by taking advantage of the
IJSER © 2011
http://www.ijser.org
International Journal of Scientific & Engineering Research Volume 2, Issue 12, December-2011 7
ISSN 2229-5518
fact that the Flash Player is installed on over 97% of Internet-
connected computers.
ACKNOWLEDGMENT
The authors wish to thank the Fichtner IT Consulting AG in Stuttgart, Germany for the opportunity to develop the proto- type project portal for the Fictner Group. Sincere thanks to Andreas Hoefler, Peter Stolle, Prof. Rainer Ketteman, Prof. Franz-Josef Behr and Paul Biskup for their technical assistance.
REFERENCES
[1] Tatnal A., ‚Web Portals: The New Gateways to Internet Information and Services‛, Idea Group Publishing, pp 364, 2004.
[2] Tatnal A., ‚Web Portals: The New Gateways to Internet Information
and Services‛, Idea Group Publishing, pp 364, 2004.
[3] Ying Y., Behr F. J. and Li H., ‚Design and implementation of a portal site for the Olympic Games 2008 in Beijing using Google Maps‛,
[4] Peng, Z. R. and Tsou, M., ‚Internet GIS: Distributed Geographic Information Services for the Internet and Wireless Networks‛, John Wiles and Sons Inc., p. xxv, 2003.
[5] Schroeder D, ‚Internet GIS Lecture Notes, Unplublished, 2008.
[6] Peng, Z. R. and Tsou, M., ‚Internet GIS: Distributed Geographic Information Services for the Internet and Wireless Networks‛, John Wiles and Sons Inc., p. xxv, 2003.
[7] Peng, Z. R. and Tsou, M., ‚Internet GIS: Distributed Geographic Information Services for the Internet and Wireless Networks‛, John Wiles and Sons Inc., p. xxv, 2003.
[8] Deitel, P. J., & Deitel, H. M., ‚AJAX, Rich Internet Applications, and Web Development for Programmers‛, Upper Saddle River: Prentice Hall, pp 991, 2008.
[9] Anonymous,‚Wikipedia Website‛, http://en.wikipedia.org/wiki/ASP.NET#State_management, 2011. [Accessed 17/10/2011].
[10] Anonymous, ‚Adobe Systems Website: Flash Player Statistics‛, http://www.adobe.com/products/flashplatformruntimes/statistics.ht ml, 2011. [Accessed 15/10/2011].
[11] Anonymous,‚Adobe Systems Website‛, http://opensource.adobe.com/wiki/display/blazeds/BlazeDS, 2011. [Accessed 17/10/2011].
[12] Anonymous, ‚BlazeDS Tutorial - Remote Object Service‛,
http://www. FlexLive.net, 2008. [Accessed 10/02/2008].
[13] Anonymous, ‚LiveCycle ES vs LiveCycle DS vs BlazeDS – clearing up the confusion‛, http://gregsramblings.com/2008/03/27/livecycle- ds-vs-livecycle-es-clearing-up-the-confusion/, 2011, Accessed
15/10/2011].
[14] Anonymous, ‚Google Maps API for Flash Developers Guide Web-
site‛, http://code.google.com, 2011. [Accessed 02/01/2011].
[15] Anonymous, ‚Google Maps API for Flash Developers Guide Web-
site‛, http://code.google.com, 2011. [Accessed 02/01/2011].
[16] Anonymous, ‚Google Maps API for Flash Developers Guide Web-
site‛, http://code.google.com, 2011. [Accessed 02/01/2011].
[17] Anonymous, ‚Google Maps API for Flash Developers Guide Web-
site‛, http://code.google.com, 2011. [Accessed 02/01/2011].
[18] Anonymous, ‚Google Maps API for Flash Developers Guide Web-
site‛, http://code.google.com, 2011. [Accessed 02/01/2011].
[19] Anonymous, ‚Google Maps API for Flash Developers Guide Web-
site‛, http://code.google.com, 2011. [Accessed 02/01/2011].
[20] Anonymous, ‚Google Maps API for Flash Developers Guide Web-
site‛, http://code.google.com, 2011. [Accessed 02/01/2011].
[21] Anonymous, ‚Google Maps API for Flash Developers Guide Web-
site‛, http://code.google.com, 2011. [Accessed 02/01/2011].
IJSER © 2011
http://www.ijser.org