International Journal of Scientific & Engineering Research, Volume 6, Issue 1, January-2015 135
ISSN 2229-5518
Design and analysis of wimax e-government network for the city of baghdad
aied k. al-samarrie1, hayam alyasiri2 , aseel h. al-nakkash3
Abstract: W iMAX is an efficient broadband wireless technique. It is adopted by the ministry of communication in Iraq to be the access network of the E-government. In this work, the design, analysis, and evaluation of an optimum W iMAX proposed network is performed according to this E-government project requirements in the city of Baghdad. However, the design of W iMAX network imposes some challenges like power control, frequency assignment, choosing the suitable antenna height and tilt, and other design parameters that must be chosen precisely. This is to get a maximum coverage at minimum interference level with satisfactory QoS and user's demands. These conflicted factors can be compromised by accurate planning and dimensioning of the network, using an efficient simulation tool to reach the optimum design of the network. In this work, ICS Telecom software is used as a simulation tool. The network planning and dimensioning is performed in three stages; these are the coverage planning, interference mitigation, and capacity dimensioning. The designed network covered about 75% of the city of Baghdad area. One thousand as a total number of subscribers is covered based on the field strength and bit rate control, while 92.3% connected subscribers is covered based on their QoS requirements. Various approaches are investigated and simulated to mitigate the interference, such as; frequency assignment, MIMO schemes and tilt adjustments. Combing all these approaches together in the proposed network decreases the overall interfered area by 52% and increases the average carrier to interference and noise ratio (C/N+I) by 14dB. Good Interference mitigation is achieved by enhancing modulation and coding schemes distribution over the network.
Keywords: W iMAX, E-government, Network planning, Baghdad.
1. INTRODUCTION
—————————— ——————————
An essential issue for services providers is how to plan
these CNs, which are wide coverage network in a city, using
WIMAX is a Broadband Wireless Access (BWA) technology, it is an evolution from Wireless Fidelity (Wi-Fi). Because of the powerful features of WiMAX, it becomes an economic technique to solve the problem of the last mile connectivity. It is supported by the WiMAX forum (telecommunications companies, whose mission is to guarantee the compatibility between devices based on the 802.16 standard) [1]. IEEE
802.16 is a collection of standards that developed to suit a variety of applications and deployment scenarios. One of these standards is IEEE 802.16e-2005, which forms the basis of the WiMAX solution for nomadic and mobile applications and is often referred to as mobile WiMAX. This standard also supports Point-to-multipoint (PTMP) scenario. In this scenario, broadband wireless connectivity is provided to users in a Wireless Metropolitan Area Network (WMAN) environment in such a way that the operation is based on a single- hop transmission between a single Base Station (BS) and multiple Subscriber Stations (SSs) [2].
BWA helps to drive the development of Community Networks (CN), which has been widely launched recently all over the world to support many applications such as accessing public information and services like E-learning, E-health and E-government [3]. The recent WiMAX deployments, around the world, are to satisfy the demand for high data rates and to solve the problem of last mile access. This makes it valuable to adopt WiMAX to build these CN.
the network dimensioning and analyzing before the deployment of these networks in reality. The objectives of network dimensioning and planning are to determine the number of cells and their locations which are satisfying the requirement of the targeted service area in terms of coverage and capacity. The planning procedure passes through various and iterative stages in order to comprise many design aspects to achieve the best performance by optimizing the network configurations.
Many researchers' efforts were implemented in this field. In [4] the author introduced a graphical user engineering tool deals with a number of parameters that affect a WiMAX network capacity planning. In [5] the author analyzed the weak point in the internet access in Syria, and introduced a study as one step to solve this problem by establishing a WiMAX mobile network. Geographic Information System (GIS) software was adopted in [2] for planning a cellular fixed WiMAX micro PTMP network for the city of Covilha˜ in Portugal to support e-learning and e-health services. The author in [1] employed ICS Telecom software in order to propose a wireless network to serve the city of Aveiro in Portugal. Different propagation models were analyzed in [6] with the aid of ICS Telecom software in order to choose the best model for coverage estimation of a WiMAX network planned for Marousi city north Athens. The author in [7] presented radio network planning of WiMAX in the region of Annemasse in France based on ICS Telecom software that
IJSER © 2015 http://www.ijser.org
International Journal of Scientific & Engineering Research, Volume 6, Issue 1, January-2015 136
ISSN 2229-5518
follows two stage strategies: coverage planning and capacity planning.
The planning of WiMAX network in the previous researches were handled from one or more point of view without covering all the aspects, some works evaluate the network performance by making a comparison only between one and three cell sector, or focus only on one cell dimensioning in their capacity estimation, while other works proposing all the SSs to be in Line of Sight (LOS) with the BS, also interference issue and frequency assignment did not taken into account in many of these works. In this paper an overall framework of WiMAX network dimensioning and planning for the city of Baghdad to serve an E –government project is done. The planning procedure is based on ICS Telecom software to simulate and analyze the planning strategy which includes three stages with an iterative manner in order to reach an optimum performance due to the best network configuration.
This paper is organized as follows: Section 2 presents the planning of the network. Section 3 introduces simulation and analysis including discussions. Finally, section 4 depicts the final conclusions.
2. WIMAX NETWORK DIMENSIONING AND PLANNING
Network Dimensioning and planning is a process that combines analytical and pragmatic design methodologies to achieve WiMAX deployment that are optimized for high performance and lower costs. The main objective of the radio network dimensioning and design activity is to estimate the number of sites required to provide coverage and capacity for the targeted service areas and SSs forecast [8].
The process of dimensioning involves a sequence of steps, which are used to serve different requirements such as coverage, capacity and service quality estimations. In order to conclude the final performance accurately, all necessary information must be available and clarified; such as Service area(s), Coverage type, Subscriber profile(s) Subscriber distribution, Service profile(s), Available spectrum, Existing infrastructure, Cartographic data, Key performance indicators and Customer requirements.
Developing an optimum solution for a wireless network based on the IEEE 802.16e standard requires detailed analysis and simulation that considers the actual network environments. Usually network planning is done by the aid of a network planning tool which depends on the digital elevation and demographic maps for the area under a scope. These tools play very essential and important role in network
designing and planning, it gives the network operator or provider the ability to obtain the best service and coverage of an area. The topology, explain the traffic distribution and existing infrastructure, is taken into account for a successful network planning. The deployment costs are reduced rabidly if the implementation of the network is based on reliable design and on an optimum performance that tested by this tools. One of the most powerful network planning tools is the ICS Telecom software, which is adopted in this work to design the network.
As the main objective of this work is to design and simulate an optimum E- government network for the city of Baghdad, the SSs of this network are represented by the governmental ministries, foundations, offices and companies. The network was designed for fixed –outdoor coverage and depends on the IEEE 802.16e WiMAX technology. Fig. (1) depicts the design stages. This will lead to satisfying the main project main goal of the project. The design will be optimal in terms of maximum coverage, minimum interference and highest quality of service. In the next subsections, the planning stages will be explained in details.
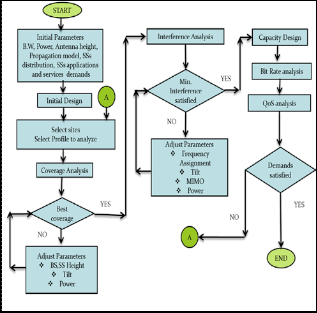
Figure 1: Network dimensioning and planning stages
2.1 Initial parameters
Practically, it is used to set nominal values for the radio parameters such that they will be as close as possible to the values that actually used. These are used for all base stations in the initial design stage. These nominal values are given in table (1).
IJSER © 2015 http://www.ijser.org
International Journal of Scientific & Engineering Research, Volume 6, Issue 1, January-2015 137
ISSN 2229-5518
2.2 Initial Design, Site selection and Profile selection
There are many possible approaches to initially identifying potential areas to search for suitable base station locations, such as; Grid Style Approach, Selective Design Approach, High Point Approach and Existing Sites Approach. The ability to determine the best site selection strategy for any given project is an essential issue in this stage [8]. After the cell sites being selected, the designer must also choose the network profile (type of antenna, number of sectors, frequency reuse pattern… etc.). The designer experience and previous knowledge help to start with an appropriate profile that leads to reduce the iterative planning procedure.
2.3. Coverage dimension
The purpose of coverage dimensioning is to ensure that the optimal number of the BS will be deployed and that the resulting coverage will satisfy the performance indicators, which is represented by a good signal level received by the Customer Premise Equipment (CPE). The service area is defined in the business plan, however the cell footprint depends on the deployment scenario and product configuration-performance product. To calculate the cell footprint, an important step is to estimate the maximum system range. The maximum system range is defined as the range for which the system can achieve a performance
2.3.1 Selecting appropriate propagation path loss model COST-231 Hata model is adopted in this work. This model is widely adopted in many WiMAX network planning works such as in [10]….[13] and it is also recommended by WiMAX forum [14 ].
The propagation path loss in this model is given by [15]:
threshold, usually in terms of Received Signal Strength (RSS) [9]. Many aspects should be included in this stage. These are:
L(dB) = 46.3 + 33.9 log fMHz − 13.82 log h
− a(hm) +
(1)
Table 1: Nominal parameters for WiMAX network
(44.9 − 6.55 log h
b
) log d − Q
km
Where: f MHz is the center frequency in MHz, h b is the
effective height of the base station antenna, h m is the height of the mobile station antenna, dkm is the distance between the base station and mobile station and Q= 0 or 3 dB depending on the environment, it is 0dB in the suburban and rural areas and 3 dB in the urban environment.
2.3.2 Calculating the receiver sensitivity
The receiver sensitivity plays an important role in cell dimensioning, it governs the coverage area limitation at different modulation and coding schemes. Equation (2) as explained in [16] is used to determine the RSS (in dBm).
F × N
× 10− 6
R = −114 + SNR
ss RX
+ 10 log
10
( s used ) +
N
FFT
(2)
+ 10 log ( R) + Imploss + NF
10
Where: SNRRx is the receiver SNR (different values
according to various modulation and coding schemes are given in table (2)). R is the repetition factor. FS is the sampling
IJSER © 2015 http://www.ijser.org
International Journal of Scientific & Engineering Research, Volume 6, Issue 1, January-2015 138
ISSN 2229-5518
frequency in Hz. Imploss is the implementation loss that includes non- ideal receiver effects such as channel estimation errors, tracking errors, quantization errors, and phase noise. NF is the receiver noise figure, referenced to the antenna port.
Table 2: SNR values for various modulation and coding schemes [16]
Modulation and coding scheme | SNR,CC, AWAGN, BER 10-6 | Bit /symbol |
QPSK 1/2 | 5dB | 1 |
QPSK 3/4 | 8 dB | 1.5 |
16 QAM 1/2 | 10.5 dB | 2 |
16 QAM 3/4 | 14 dB | 3 |
64 QAM 1/2 | 16 dB | 3 |
64 QAM 2/3 | 18 dB | 4 |
64 QAM 3/4 | 20 dB | 4.5 |
2.3.3 Choosing parameters that affect coverage
After estimation the coverage, many parameters that affect the coverage should be analyzed in order to get a maximum coverage that provided using minimum number of sites [8].
In this work, the following parameters are considered and analyzed:
(a) Adjusting antenna height. Increasing height results in increased coverage area and vice versa.
(b) Adjusting transmit power. Power reduction reduces coverage area.
(c) Adjusting antenna azimuth for directional antennas only. Adjusting the Nil such that maximum coverage in the desired direction being achieved.
(d) Adjusting the antenna tilt. Adjusting antenna tilt towards the radio horizon achieves maximum coverage range, while adjusting it towards the ground reduces the coverage range.
2.4 Interference Mitigation
of interference may be produced in Non Line of Sight (NLOS) wireless communication environment, in which the received signal is a combination of many multipath signals causing fading [19]. Multipath fading results in Inter Symbol Interference (ISI) and Inter Carrier Interference (ICI). In this work several approaches [8] are implemented in order to reduce the interference to as minimum value as possible, these are:
(a) Power management; in this approach the power of the interferer is reduced to maintain the relative signal strength in an acceptable value.
(b) Antenna tilting. It is possible to orient antennas within the horizon such that the energy radiated towards the horizon is reduced. This will have the effect of maintaining the coverage in the wanted area, but reducing interference outside of it.
(c) Frequency assignment. Changing either the victim or interfering system frequencies can prevent interference between them. This off course, may cause interference with other spectrum users, hence the designer should be careful by identifying any potential problems that may be caused by changing the frequencies.
(d) Selecting the appropriate guard intervals between symbols.
2.5. Capacity Dimensioning
The system capacity refers to the numbers of connections that the wireless channel can support without unduly degrading the data service carried on the channel. In order to get a precise capacity planning, many related concepts should be studied and analyzed. Many parameters have a significant impact on the capacity like channel bandwidth, modulation and coding scheme used, Physical-layer data rate, SSs density and SS's applications demand and their distribution. In this stage the analyses are done considering bit rate and QoS as judgment criteria.
2.5.1 Bit Rate Calculation
The WiMAX OFDM physical layer data rate can be formulated as follows: [20]
The consistency of wireless system design strongly depends on the designer's ability to maintain an adequate signal to

R = Nused bmCr
Ts
(3)
noise ratio and interference over the entire coverage area [17]. Many types of interference may affect the network performance which should be noticed and manipulated. CoChannel Interference (CCI) happens when a user in an adjacent cell uses the same channel frequency, while Adjacent
Where bm is the number of bits per modulation symbol and
if M is the modulation level in a M-QAM constellation, then M= 2^ bm . The cr is the coding rate and the symbol duration TS is given by:
Channel Interference (ACI) happens when a user in the same region uses an adjacent channel frequency [18]. Other sources
T =T +T
s g b
(4)
IJSER © 2015 http://www.ijser.org
International Journal of Scientific & Engineering Research, Volume 6, Issue 1, January-2015 139
ISSN 2229-5518
T = [G + 1]T
s b
(5)
existing radio masts for a new network. According to these reasons, the existing site approach was adopted in deploying
Where G is Tg /Tb ratio, this value can be: 1/4, 1/8, 1/16 or
1/32. Tb = 1/Δf, with the sub-carrier spacing Δf given as:
F
the base stations. The existing sites are represented by the twenty two Telephone exchange locations in Baghdad owned and managed by the Ministry of Communications, see Fig. (2).
And
∆f = s N
FFT

nBW F = floor (
)8000
(6)
(7)
Sites coverage analysis will be performed to decide which site is best covered to be adopted, and hence worst coverage cell can be eliminated as shown in Fig.(3), to achieve maximum coverage with as littlest number of BS in order to
s 8000
avoid overlapping, which is represented by pink area in Fig.
(2).
Where: FS is the sampling frequency, n is the sampling
factor, BW is the nominal channel bandwidth and NFFT is the number of points for FFT or total number of subcarriers. Based on the calculation made above, the theoretical throughput can be achieved, but it should be noted that different overhead bits are included in both physical and MAC layer implementations that must be removed to determine the practical throughput.
2.5.2 Quality of Service
The wireless medium has limited bandwidth, high packet error rate, and high packet overheads that all together limit the capacity of the network to offer guaranteed QoS. MAC scheduler plays a vital role in addressing the QoS issue in WiMAX 802.16’s MAC layer by enabling classification of application flows and mapping them to connections with distinct scheduling services that ensure both guaranteed handling and traffic enforcement. Each connection is associated with a single scheduling data service, theses are; (Unsolicited Grant Service (UGS), the real-time Polling Service (rtPS), extended real-time Polling Service (ertPS), non-real-time Polling Service (nrtPS), Best Effort (BE)). Each data service is associated with a set of QoS parameters that quantify aspects of its behavior [21].
3. NETWORK ANALYSIS AND EVALUATION
The total number of SSs is assumed to be 1000, where 90% of the SSs are distributed randomly in urban while 10% of the SSs are distributed in suburban area of Baghdad, which is equal to 358.5 Km2 of the total area of Baghdad that equals to
1078 Km2. High resolution digital maps representing the different clutter types of the planned area, are required for the network design. These maps are provided by the ICS Telecom software network planning tool. The following analyses are performed on the designed network:
3.1 Coverage planning
Nowadays, there is a reluctance to allow new radio masts to be erected in many countries. For this reason, and often for reasons of cost and time provision it is desirable to re-use
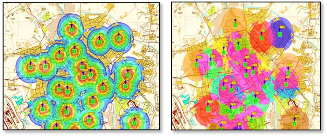
(a) 22 cell sites (b) 22 Best sites
Figure 2: Initial design
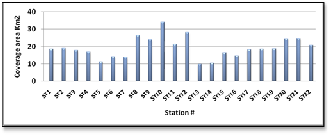
Figure 3: Best sites coverage,
Nine network profiles are adopted in this work, to be investigated, these are: For B.W = 20MHz with Omni antenna, monopole antenna, three directional antenna, four directional antenna and six directional antennas, (with each network profile contains twelve sites); and for B.W= 5 MHz with Omni antenna and monopole antenna-twenty two sites each, three directional antennas and four directional antennas (with seventeen sites each). For each profile the receiver sensitivity was calculated to determine the maximum coverage radius and for different modulation and coding schemes as illustrated in table (3).
Comparing different profiles in terms of percentage coverage area and connected SS due to field strength is represented in Fig. (4). It is obvious that the network with
5MHz B.W- twelve BS -four sectors per cell, gains the highest coverage. The coverage design was implemented with fixed
IJSER © 2015 http://www.ijser.org
International Journal of Scientific & Engineering Research, Volume 6, Issue 1, January-2015 140
ISSN 2229-5518
BS (35m) and SS antenna height (6m). Since the same factors affect both coverage and interference, they will be discussed later for both stages.
Table 3: Receiver sensitivity
illustrate the effect of Inter cell interference.
(a) Coverage map
(b) Interfered area% of BS#1
Figure 5: PTP interference analysis
(b) Interference map was simulated and plotted for all cell design profiles as shown in Fig.(6). At each point of the coverage; the unwanted field strength subtracted from the wanted one and the maximum C/I ratios are calculated within each element coverage. These interference maps and calculations are represented in Fig. (7).
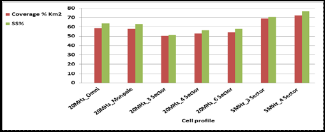
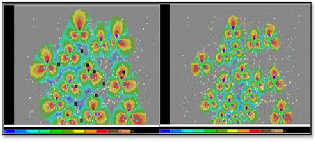
Figure 4: Comparing different network profies in
terms of coverage area% Km2 and connected SSs% (a) B.W=5MHz (b) B.W = 20 MHz
Figure 6: Interference map
3.2 Interference Mitigation
At this stage the interference effects are sensed by analyzing the network using three different ways as follows:
(a) Point to Point (PTP) interference analysis where all
activated BSs are considered in as wanted and as unwanted signals consecutively. For example, Fig.(5) represents BS1 as wanted station and all the others as unwanted stations and
IJSER © 2015 http://www.ijser.org
(a) B.W = 5MHz
International Journal of Scientific & Engineering Research, Volume 6, Issue 1, January-2015 141
ISSN 2229-5518
These analyses help to identify how the interference is affecting each point in the network for different cell profiles. In the following sections approaches to mitigate the interference are discussed.
3.2.1 Frequency Reuse
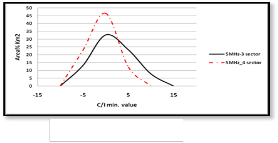
There are many patterns for frequency assignment can be adopted. In order to achieve 100% B.W usage, the frequency patterns that adopted in this work are illustrated in Fig. (8-a). The simulations of the four schemes shown above were investigated. The calculation is performed from all active base stations to all subscribers and the results are shown in Fig. (8- b).
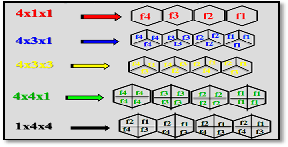
(a) Frequency reuse pattern
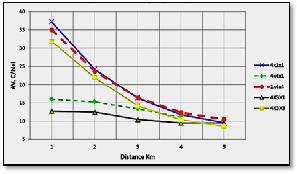
(b) SSs Av. C/N+I vs. distance
Figure 8: Frequency Reuse
It is worthy to note that the analysis of various reuse patterns leads to adopt 1x4x4 pattern for further evaluations and analyses, since it was having the minor interference comparing to other patterns.
3.2.2 Power management
One approach to mitigate the interference is to reduce the power of the interferer, however reducing the power of the
interferer will also reduce its service area and this will have an effect on network coverage and capacity in the region around the interfering base station. Thus MIMO approach and its role in mitigating the interference effects have been investigated. By adopting a MIMO approach in the simulation, the power is reduced by a factor equal (1/ number of antennas) and the antenna gain is increased by log10 (number of antennas). The results are represented in the table (4) for down link (DL) only.
Table 4: MIMO Schemes configuration
It is
clearly that as the number of antennas increased, the interference decreased due to the reduction of the interferer power. Network simulation with 6 antennas array leads to
41% reduction in the interfered area while keeping the same coverage area.
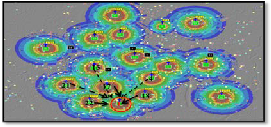
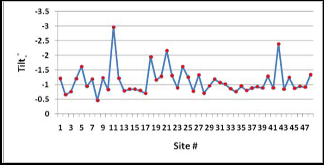
3.2.3 Adjusting antenna tilt of interferer BS.
In this simulation each station - subscribers tilt was calculated. An average tilt to each station was assigned accordingly as shown in Fig (9).
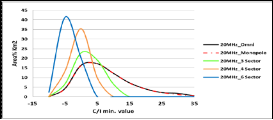
Combining the three previous approaches, will cumulative their effects on the interference mitigation which can be sensed from the simulation results shown in Fig. (10).

IJSER © 2015 http://www
Figure 9: Assigning Tilt to BS
International Journal of Scientific & Engineering Research, Volume 6, Issue 1, January-2015 142
ISSN 2229-5518
64 QAM 1/2 | 18 |
64 QAM 2/3 | 20 |
64 QAM 3/4 | 21 |
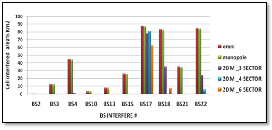
(a) AV. C/N+I vs. distance
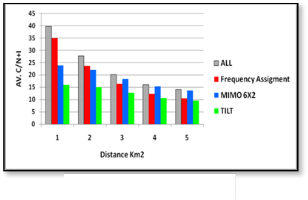
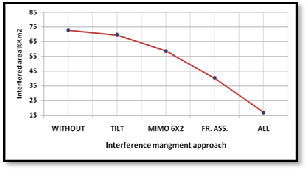
(b) BS interfered area %
Figure 10: Effects of frequency reuse, tilt, MIMO
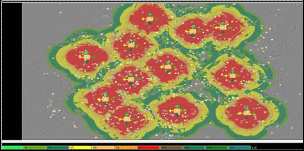
(a) C/N+I map
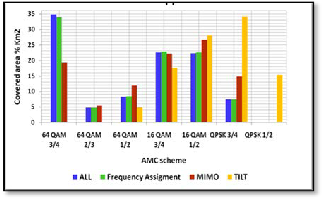
b- coverage area %
Figure 11: Effects of frequency reuse, tilt, MIMO
scheme on AMC distribution
The C/I+N map can also be configured with the AMC scheme, according to their requirements that given in table (5). The interference mitigation approaches are utilized to investigate how they can enhance the network performance by increasing the spectral efficiency through good AMC distribution as shown in Fig (11).
Table 5: AMC and related C/N[16]
3.2.4 Selecting appropriate guard interval

The radio network planner specifies a guard interval created by the cyclic prefix (CP) of the simulated equipment. This guard interval must be more than the worst case of the delay between the direct path and the reflected one, in order to get constructed field strength, and hence keep orthogonality between subcarriers and mitigate ICI. In this work CP is chosen to be 1/8 from the symbol data duration according to the results obtained from the simulation of the 3D reflection paths, which are provided by the ICS Telecom program as shown in Fig. (12), where interfered area represented by pink color = 27.06% Km2 according to CP=1/16 in (a), while the interfered area=6.42% Km2 according to CP =1/8 in (b).

IJSER © 2015 http://www.ijser.org
International Journal of Scientific & Engineering Research, Volume 6, Issue 1, January-2015 143
ISSN 2229-5518
3.3 CAPACITY PLANNING
In order to ensure that the presented network will satisfy the SSs capacity requirement, the network (with various proposed profiles) was analyzed in terms of connected SSs percentage depended on the bit rate and QoS requirements. This simulation was carried out for a proposed scenario of 1000
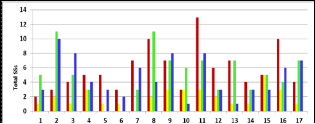
SSs, which are classified into four classes representing the main internet service applications. Table (6) depicts the four applications with their bit rate demands and the SSs activity factor. As an example of this simulation stage, Fig (13) represents the connected SSs according to their bit rate demands within each cell in the 20 MHz network, while Fig. (14) represents the connected SSs according to the five QoS service flow levels in the same network.
Table 6: Proposed SSs scenario for capacity planning
The overall network performance after all planning stages being performed is shown in Fig (15). It is clearly that the network with B.W= 5MHz- four sector has achieved the highest performance. It gains coverage area = 72% of Baghdad total area and the SSs connected according to FS = 89.6%, according to bit rate demands= 81.7% and according to QoS=57.7%.
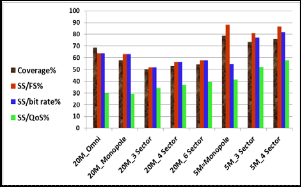
Figure 15: Wimax Network overall performance
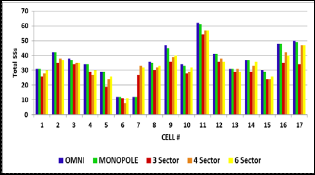
Figure 13: SSs connected based on Bit Rate-20MHz
3.4 OPTIMUM NETWORK
The evaluation of the previous design stages leads to another trail that might be done to get more robustness assurance and performance enhancement. A site search has been carried out to find the best site location for adding a new cell(s), in order to
increase the
coverage area and hence the connected SSs. The search results in adding only one site (where most of the unconnected SSs were sensed) in order not to increase the interference. The new site increases the percentage of the connected SSs according to their FS by 3.3%, and as a result the total SSs will be 929 SSs. The rest orphan SSs were modified by their antenna height as in table (7) in order to be covered.
Table 7: SS antenna height vs. SS coverage
IJSER © 2015 http://www.ijser.org
International Journal of Scientific & Engineering Research, Volume 6, Issue 1, January-2015 144
ISSN 2229-5518
By adding the last cell, the SSs connected according to the bit rate control will be =100% and according to QoS control will be=92.3%. Increasing coverage will enhance the capacity planning consequently, as it has been described previously.
3.5 24 HOURS TRAFFIC ANALYSIS
A scenario that simulates the traffic during 24 hours was suggested in Fig. (16). The figure depicts the E-government activity during the day. The response of the network to the suggested traffic is illustrated in Fig. (17) in term of QoS %.
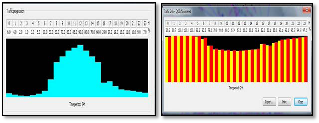
a- Traffic progression b- QoS %
Figure 16: 24H Traffic Analysis
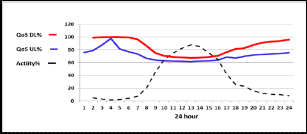
Figure 17: The response of the network to the suggested traffic
4. CONCLUSION
As the WiMAX technique is a key solution for cellular network deployment all over the world, it is adopted to design and simulation an E –government wireless network for the city of Baghdad. The efficient network planning is based on radio network planning tools, where the results can be obtained accurately within short periods of time as compared to mathematical analysis and solutions. ICS Telecom software is adopted to plan and design the WiMAX network. The planning is performed in three stages. The first stage is the coverage planning stage, where a maximum coverage is required to be obtained using as minimum as number of BSs deployment. Various profiles were analyzed also. The network profile with B.W=5MHz and four sectors was nominated, because the results of the simulation of this profile showed maximum percentage coverage equals to 75% of the total area of Baghdad, and connected SSs equals to 87.6% of the 1000 SSs. The second stage was to mitigate the overall
interference obtained at the maximum coverage of the previous stage. Many approaches were investigated to get as minimum interference as possible. Combing frequency assignments, MIMO schemes and tilt adjustments together in one network profile reduces the interfered area by 52% and increases AV.(C/N+I) by 14dB, and also enhances modulation and coding schemes distribution over the network area. In the third stage the capacity of the network was simulated putting into consideration bit rate and QoS that satisfy analyzed SSs demands. This results in satisfaction of 80% of the SSs demands. The connected SSs according to their QoS required levels were approximately 60%. The simulation was done iteratively to optimize the network configuration in order to achieve high performance. Another enhancement is tried by adding one site and adjusting antenna height. This trial results in increased coverage of 75%, the connected SSs increased based on the FS and bit rate control to 100% and based on their QoS to 92.3%.
5. ACKNOWLEDGEMENT
The authors are grateful to the Ministry of Communication for providing the necessary information required to plan the WiMAX E- government network and Ministry of Science and Technology, in Iraq for providing the ICS Telecom.
References
[1] M. Araújo, A. Navarro and A. Rocha, "Cellular planning of 802.16e WiMAX networks", [Online]. Available:http://www.av.it.pt/conftele2009/Papers/17.p df. [Accessed: Sept. 12, 2014].
[2] F. Velez, P. Sebastia˜o, R. Costa, D. Robalo,C.
Comissa´rio, A. Rodrigues, and A. Hamid Aghvami"Radio and Network Planning" in WiMAX Networks Techno-Economic Vision and Challenges,,Ramjee Prasad Fernando J. Velez, Springer Science+Business Media B.V. 2010.
[3] K. Farkas, H. Csaba, A. Szabó, Z. Horváth, "Planning of Wireless Community Networks" in Handbook of Research on Telecommnications Planning and Mangment for Busniness , Lee (Western IIIinois University),USA, 2009.
[4] B. Rés, S. Sargento, "WiMAX Deployment, Planning and Optimization: Application to Different Scenarios", In Proceedings of the Conference of Telecommunication (ConfTele), Santa Maria da Feira (Portugal), Maio 2009.
[5] M.shbat, "Syria Mobile WiMAX Plan", M.Sc. thesis
Information and Communication University,
2008.
IJSER © 2015 http://www.ijser.org
International Journal of Scientific & Engineering Research, Volume 6, Issue 1, January-2015 145
ISSN 2229-5518
[6] N. Moraitis1, D. Vouyioukas and P. Constantinou, "Propagation Study and Performance Evaluation of a Mobile WiMAX System at 3.5 GHz", In Proceedings of the IEEE International Conference on Communication (ICC), 2011.
[7] D. Mshelia," WiMAX Radio Network Planning and Analysis ", ARPN Journal of Science and Technology, VOL. 3, NO. 8, August, pp.882-891, 2013.
[8] Adrian W. Graham, Nicholas C. Kirkman and Peter M.
Paul ,Mobile Radio Network Design in the VHF and
UHF Bands, John Wiley & Sons Ltd Press, 2007.
[9] B. RAMASANKAR, "COMPARISON OF RADIO PROPAGATION MODELS FOR WiMAX COVERAGE AT 450 MHz, 2.5 GHz AND 3.5 GHz FOR DIFFERENT TERRAINS" MSc thesis, Glasgow Caledonian University, 2012.
[10] J. Eira, A. Rodrigues, "Analysis of WiMAX data rate performance"[Online].Available:http://029b499.netsolho st.com/whitepapers/UnivLisbon_Analysis_WiMAXData Perfo.pdfl, Portuga ,2009. [Accessed: Sept. 1, 2014].
[11] H. B. Nafea, F. W. Zaki, H. Moustafa ," Penetration Loss of Walls and Data Rate of IEEE802.16mWiMAX including Adaptive Modulation and Coding (AMC)", journal of Wireless and Mobile Technologies, Vol. 1, No.
1, 29-36, 2013.
[12] S. AL-Rashdy, Q.Guo, " Overhead Estimation over Capacity of Mobile WiMAX", International Journal of Electrical, Robotics, Electronics and Communications Engineering Vol:6 No:2, PP. 7-12,2012.
[13] M. Alshami, T.Arslan, J.Thompson, and A.T. Erdogan
"Frequency Analysis of Path Loss Models on WIMAX",
3rd computer science and electronic engineering conference CEEC ,PP.1-6, July 2011.
[14] WiMAX Forum, Mobile WiMAX - Part I: A Technical
Overview and Performance Evaluation, August 2006.
[15] WiMAX Forum, "IEEE 802.16 Broadband Wireless
Access Working Group",2008.
[16] WiMAX Forum, IEEE 802.16-2009, “IEEE standard for local and metropolitan area networks Part 16: Air Interface for Broadband Wireless Access Systems”, Dec.
2009.
[17] F. Is. Kandah, "A SECURE AND RELIABLE INTERFERENCE-AWARE WIRELESS MESH NETWORK DESIGN ", Doctoral Dissertation, North Dakota State University Fargo, USA ,2012.
[18] HANDBOOK OF WIRELESS NETWORKS AND MOBILE COMPUTING, Series Editor: Albert Y. Zomaya , John Wiley & Sons, Inc, 2002.
[19] M. S. Baig," Signal Processing Requirements for WiMAX (802.16e) Base Station", MSc thesis, Chalmers University of Technology ,Gothenburg, Sweden ,2005.
[20] A. M. AHMADZADEH "Capacity and Cell-Range Estimation for Multitraffic Users in Mobile WiMAX", MSc. Thesis, University College of Borås, 2008.
[21] I. Ahmad and D. Habibi,"Quality of Service in WiMAX" in WIMAX NETWORK PLANNING AND OPTIMIZATION, Edited by Yan Zhang, Taylor & Francis Group, LLC, 2009.

Author Profile
Associate Professor Dr. Aied K. AL-Samarrie received the BSc degree from the University of Technology Baghdad -Iraq, the MSc degree from the University of Science and Technology Montpellier-France and the PhD degree from the University of Salford Manchester-England. He worked as an associate professor at the University of Technology Baghdad- Iraq, and Mu'tah University Karak-Jordan. He published many researches in the field of communication engineering, supervised many PG students. Now he is working as a member of staff at the University of Technology dept. of Elec. Eng., Baghdad-Iraq.

Hayam Alyasiri received B.Sc. 1991, M.Sc. 1996, Ph.D. 2001. She worked as a Lecturer at University of Technology in Baghdad (2001 – 2007). Currently she is the Minister Advisor at the ministry of communications in Baghdad. She has tens of published papers. Her research interests are wireless communications, mobile communications, and satellite communications.

Aseel H. AL-Nakkash received B.Sc. degree in 1988 from Control and System Engineering department at the University of Technology in Baghdad, and M.Sc. in 2001 from Technical Educational department. Currently she is lecturer at Collage of Electrical and Electronic Techniques, department of
IJSER © 2015 http://www.ijser.org
International Journal of Scientific & Engineering Research, Volume 6, Issue 1, January-2015 146
ISSN 2229-5518
Computer Engineering Techniques in Baghdad and at the same time, she is Ph.D. student at the University of Technology department of Electrical Engineering in Baghdad. She published many researches in the field of communication engineering.
IJSER © 2015 http://www.ijser.org