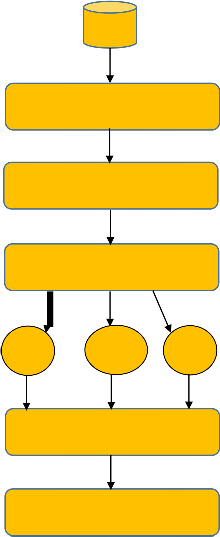
Block diagram of the whole process is given in the Figure 1.
International Journal of Scientific & Engineering Research, Volume 4, Issue 8, August-2013 81
ISSN 2229-5518
Data Mining Approach to predict stock market scenario of Public Sector Units of India
Hina Saxena, Zubair Khan, Ashutosh Bhatnagar
Abstract— in this paper large amount of stock market data of PSUs of India are identified which is based on rise and fall their share values in Indian stock market. Research work has been done in two stages, in first stage stock data have been categorized based on zero growth, moderate growth, and fast growth. This clustering has been done using Fuzzy C- Means algorithm which is very popular data mining approach. In second stage moving aver- age approach has been used to determine trends about the behavior of stock market. The stock market trend holds to understand the present scenario and after that forecast the next stock price. Our research provides a platform to investors to take appropriate decision strategically to earn the profit in their investment in appropriate PSUs based on zero growth, moderate growth and fast growth in that time horizon. According to our research investiga- tions, it has been observed that two stage mining process that is fuzzy c means algorithm and moving average methodology can develop more useful information to invest in market in order to provide profit for investors.
Index Terms— Stock Price, Pattern Recognition, Zero Growth (ZG), Moderate Growth (MG), Fast Growth (FG), and clustering, Original Price (OP), Predicted Price (PP), Public Sector Unit (PSU).
—————————— ——————————
IN any organization or any business process storing and analysis of data is very essential. Now a day’s large amount of data scaled up to peta bytes has been generated and stored in databases or digital data warehouses [15] for years because it is the most natural form to store information. Therefore it is very difficult task to analyze such amount of huge data manu- ally because of complexity involvement. In order to tackle this kind of information overloaded problem, clustering have been used as a solution. Clustering [12], [13], [19] is a mean for achieving better organization of the information by partition- ing the data space into groups of entities with similar content. Some of clusters may be accepting on other hand some clus- ters maybe declining.
One of the most important means in dealing with data pro- cessing is to classify or group it into categories or clusters. Classification plays an important and indispensable role in the long history of human development. There are two types of classification, supervised and unsupervised. In supervised classification, predefined knowledge is available.
————————————————
• Hina Saxena Invertis University Bareilly, India, 8449090363. E-mail:
• Zubair Khan Invertis University Bareilly, India, E-mail:
• Ashutosh Bhatnagar DRDO Mussooriee, India, 9456074323, Email:
meashoo@gmail.com
On the other hand in unsupervised classification, called as clustering or exploratory data analysis, no labeled data are available. In order to take decision in business word, this kind of information generated after clustering is very useful. Clus- tering as Zero growth (ZG), Moderate Growth (MG) and Fast Growth (FG) will provide the platform for investors to take decision regarding investment in market. Data mining [16] techniques such as clustering and association rules [14] can be very useful to forecast market trends based on available data sets. Similar items sets can be grouped by clustering on other hand association is used to get generated rules of dependent variables. The key functionalities of data mining are associa- tion mining, classification, prediction, and cluster analysis. These techniques are often applied to different types of data to solve different problems. Some applications of data mining are target marketing, customer relation management, market bas- ket analysis, cross selling, market segmentation, forecasting [17] , [18], quality control, fraud detection, and intellectual query answering.
Stock market is very dynamic and inclined to very quick changes because of several tangible and intangible factors. Know a day’s electronic media provides all kind of Infor- mation related to stock market through various websites like yahoo finance, financial times, Google finance, CNN money, Bloomberg etc.
In this research work data from Bombay Stock Exchange (BSE)
of different PSUs like NTPC (1), BHEL (2), BEL (3), BPCL (4), HPCL (5), GAIL (6), NHPC (7), BEML (8), and ONGC (9) has been taken from yahoo finance and data set is used for our
two
IJSER © 2013 http://www.ijser.org
International Journal of Scientific & Engineering Research, Volume 4, Issue 8, August-2013 82
ISSN 2229-5518
stage research process. Decision regarding the selection of high growth company for investment and to get profit is very difficult task. In our case we have to identify PSUs which have maximum growth rate and possibility of getting profit is max- imum while investing in them. Another aim of research is to investigate the accuracy of this kind of two stage work for prediction of patterns in stock time series. This research is also helpful for investors of stock market to find out the PSUs which are reliable to invest with the maximum profit. Also it can be a useful approach to identify the PSU's growth rate based on some of the attributes. Here different PSUs, having different volumes based on their high, moderate and low val- ue, have been analyzed and their growth pattern has been forecasted. Based on this scenario it is easy to predict reason for Zero Growth, Moderate Growth and Fast Growth.
It is very challenging task to predict the future trend in stock market, because of dynamic nature of market. Lots of research work have been already done in this field but scope is still here in order to predict future trend more and more accurate- ly. Data mining techniques are very powerful in this context. In order to group huge data clustering is useful. There are so many clustering techniques available such as K means, Fuzzy C means etc. K-Means and its variants [1], [2] are the most well-known partitioning methods which are used in several clustering applications. Fuzzy C mean clustering gives more accurate result as compare to K- Means in several applications. In the literature it has been found that lots of work has been performed in the context of prediction of share market trends. Aurangzeb Khan; Kairullah Khan used the Most Frequent Item set rule to generate patterns on super market and trend- ing data [3]. J. ting et al proposed a technique based trending data mining approach for intra stock mining which usually perform concentrates on finding most appearing items for the stock time series data and inter trading mining which used to discover the different strong relationship among the several socks. Dattatray P. Gandhmal et al have done two stage min- ing process that is k-means and CIR algorithm to predict and generate future trends about the behavior of stock market [4]. In our two stage analysis, for first stage fuzzy c means algo- rithm has been used. In order to predict time series data, sev- eral methods can be used such as linear fitting, polynomial fitting, exponential smoothing and moving average method etc. But in this research work it has been investigated for this kind of share market trend prediction moving average is one
of the most reliable method.
In this research moving average curve has been used, that helps in predicting the future trend of the PSUs share prices. This research consists of two phases. In the very first phase the Fuzzy C-means algorithm has been applied on the data set, which divide the data set in the 3 distinct clusters i.e. Fast Growth (FG), Moderate Growth (MG), and Zero Growth (ZG). In the second phase the moving average curve is applied to predict the future trend.
Proposed approach in this research work is two stage model. First the Fuzzy C-Means algorithm is applied to generate clus- ters, and after that moving average curve is applied to predict the future trends.
Block diagram of the whole process is given in the Figure 1.
Fig. 1. Block Diagram of the proposed architecture.
IJSER © 2013 http://www.ijser.org
International Journal of Scientific & Engineering Research, Volume 4, Issue 8, August-2013 83
ISSN 2229-5518
Among pattern recognition methodologies, whose main objec- tive is to recognize objects with similar features, defining thus a pattern class, the Fuzzy C- Means (FCM) algorithm is a very useful tool. It was proposed by Dunn [10] in 1973. This pattern class, also known as cluster, is a set of like objects, defined on
A moving average [7] is a time series constructed by taking averages of several sequential values of another time series. It is a type of mathematical convolution. If we represent the orig- inal time series by y1…. yn , then moving average of the time series is given by
1
the basis of some attributes or features relating to the objects
𝑍𝑡 =
𝐾+1
𝐾
𝑗=0
![]()
𝑦𝑡−𝑗 , t=K+1, K+2… n.
[5], [6].
Fuzzy c-means (FCM) is a method of clustering which allows one piece of data to belong to two or more clusters. The phi- losophy of FCM has been extensively used in different fields of research [8], [9], [10], [11]. This method is frequently used in pattern recognition.
It is based on minimization of the following objective function:
Thus Zk+1……. Zn-k forms a new time series which is based on averages of the original time series, {yt }. Moving averages are very simple methods, they are often building blocks for more complicated methods of time series smoothing, decomposition and forecasting.
𝑁 𝐶 𝑚
2 , 1 ≤ m < ∞
𝐽𝑚 = ∑𝑖=1 ∑𝑗=1 𝑢𝑖𝑗
⃦𝑥𝑖 − 𝑐𝑗
Before doing actual task it is essential to arrange the selected
where m is any real number greater than 1, uij is the degree of
measured data, cj is the d-dimension center of the cluster, and
||*|| is any norm expressing the similarity between any measured data and the center.
Fuzzy partitioning is carried out through an iterative optimi-
zation of the objective function shown above, with the update of membership uij and the cluster centers cj by:
𝑁 𝑚
data in desired format after that transform, aggregate and as-
cess is called the preprocessing.
PSU, Code, Date, Open, High, Low, Close, Volume
NTPC, 1, 5/9/13, 156, 157.9, 155, 156.3 , 1824900
BHEL, 2, 5/9/13, 195.15, 197.9, 192.6, 195.95, 2677200
BEL, 3, 5/9/13, 1255.15, 1267, 1238.7, 1245.65,15200
BPCL, 4, 5/9/13, 412.95, 412.95, 406.4, 409.8,676000
HPCL 5, 5/9/13, 305, 308.05, 302.7, 306.75,51100
GAIL 6, 5/9/13,343.3, 343.3, 337.5, 339.85, 18600
1 ∑𝑖=1 𝑢𝑖𝑗 .𝑥𝑗
𝑢𝑖𝑗 =![]()
![]()
2 , 𝐶𝑗= ∑𝑁
𝑢𝑚
NHPC 7, 5/9/13,20.85, 20.9, 20.6, 20.75, 673200
𝐶 ⃦𝑥𝑖 −𝑐𝑗
𝑚−1
𝑖=1
𝑖𝑗
BEML 8, 5/9/13,175.05, 176.7, 166, 168.25, 24800
![]()
∑𝐾=1� ⃦𝑥𝑖 −𝑐𝑘 �
ONG 9, 5/9/13,320.1, 323.5, 319.3, 321.55 1873000
This iteration will stop when
𝑚𝑚𝑥 �� 𝑢(𝐾+1)
(𝐾)
𝑖𝑗
��<ᵟ
Fig. 3. Unprocessed Data Set of PSUs
, where ᵟ is a termination criterion between 0 and 1, whereas K are the iteration steps. This procedure converges to a local minimum or a saddle point of Jm.
This iteration will stop when, where is a termination criterion between 0 and 1, whereas K are the iteration steps. This pro- cedure converges to a local minimum or a saddle point of Jm. Steps of the algorithm:
1. Initialize U= [uij] matrix, U (0)
2. at k-step: calculate the centers vectors C (k) = [cj] With
U (k)
Data quality is key issue now a days, most of the data mining experts spend their time in evaluating quality of data. The data collected in Figure 3 was preprocessed by using SQL Server Data Transformation Services.
Table 1: PSUs Processed Data Set
𝑁 𝑚
∑𝑖=1 𝑢𝑖𝑗 .𝑥𝑗
![]()
𝐶𝑗= 𝑁
𝑖=1
𝑚
𝑖𝑗
3. Update U(k) , U(k+1)![]()
𝑢𝑖𝑗 =![]()
𝐶
1
⃦𝑥𝑖 − 𝑐𝑗![]()
2
𝑚−1
∑𝐾 =1 � ⃦𝑥 − 𝑐 �
𝑖 𝑘
4. If || U (k+1) - U (k) ||<ᵟthen STOP; otherwise Re-
turn to step 2.
IJSER © 2013 http://www.ijser.org
International Journal of Scientific & Engineering Research, Volume 4, Issue 8, August-2013 84
ISSN 2229-5518
Table 4: Fast Growth PSUs
In technical analysis Fuzzy C-means is applied on prepro- cessed data, which will result in three clusters i.e. Fast growth (FG), Moderate Growth (MG), Zero Growth (ZG). Later the moving average curve is applied on the preprocessed data set to predict the future trend of the public sector units.
Both the techniques is applied on the original dataset of Bom- bay Stock exchange, which has been taken from the Yahoo Finance.
In this stage Fuzzy C-Means algorithm is applied to form three clusters Zero growth (ZG), Moderate Growth (MG), Fast Growth (FG).
Cluster 1 (Zero Growth): The PSUs which consists of very low volume are contained in this cluster.
Table 2: Zero Growth PSUs
PSUs/ code | Date | Open | High | Low | Close | Vol- ume |
BEL 3 | 5/9/1 3 | 1255.15 | 1267 | 1238.7 | 1245.65 | 15200 |
HPCL 5 | 5/9/1 3 | 305 | 308.05 | 302.7 | 306.75 | 51100 |
GAIL 6 | 5/9/1 3 | 343.3 | 343.3 | 337.5 | 339.85 | 18600 |
BEML 8 | 5/9/1 3 | 175.05 | 176.7 | 166 | 168.25 | 24800 |
Cluster 2 (Moderate Growth): The PSUs which consists of moderate volume are contained in this cluster.
Table 3: Moderate Growth PSUs
In the second phase moving average curve is applied to pro- duce a property matrix of the PSUs. Property matrix of the PSUs is shown in Table 5, which predict the future trends of the public sectors. Entire trends of the Fast Growth cluster are represented by the Fig. 2, Fig. 3, and Fig. 4.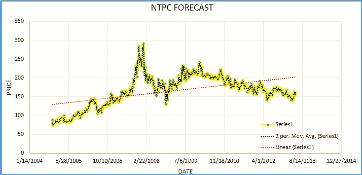
Fig. 2. NTPC Moving Average and Linear Forecast.
Fig. 2 shows the Moving Average and Linear Forecast of NTPC which lies in the Fast Growth cluster. It has been ob- served that Moving Average method forecast by more than 90
% accuracy. While the accuracy of the Linear forecast is con- siderably less.
Fig. 3 shows the Moving Average and Linear Forecast of BHEL which also lies in the Fast Growth cluster. Moving Av- erage method forecast by more than 90 % accuracy. While the Linear forecast is considerably less accurate.
Fig. 4 shows the Moving Average and Linear Forecast of ONGC which also lies in the Fast Growth cluster. Moving Av- erage method forecast by more than 90 % accuracy. While the
Linear forecast is considerably less accurate.
Cluster 3 (Fast Growth): The PSUs which consists of highest
volume are contained in this cluster.
IJSER © 2013 http://www.ijser.org
International Journal of Scientific & Engineering Research, Volume 4, Issue 8, August-2013 85
ISSN 2229-5518
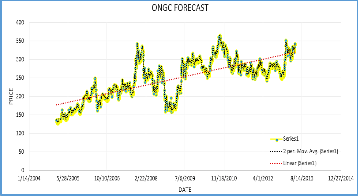
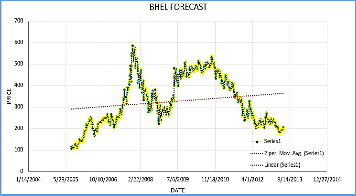
Fig. 3. BHEL Moving Average and Linear Forecast. Fig. 4. ONGC Moving Average and Linear Forecast.
Table 5: Property Matrix of PSUs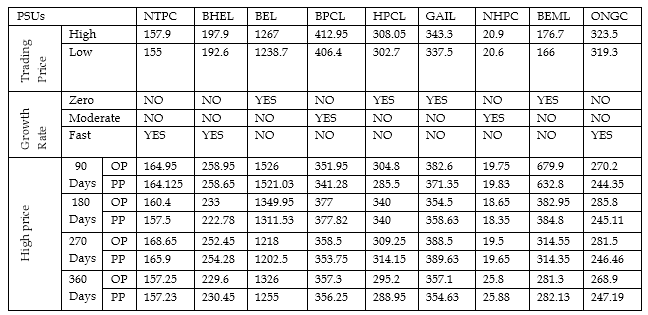
This research work provide solution for the investors in order to invest in share market with high accuracy prediction of future trend in order to earn maximum profit. This two stage research work is highly successful in both stage. In first stage Fuzzy C Means algorithm has been used to group the PSUs in three clus- ters i.e. Zero Growth, Moderate Growth and Fast Growth. And in second stage future trend has been predicted more than 90% accurately which provide a platform to investors to gain maxi- mum profit by investing their money in share market.
[1] D. R. Cutting, D. R. Karger, J. O. Pedersen, and J. W. Tukey, “Scat- ter/gather: A cluster-based approach to browsing large document collections”. In Proceedings of the Fifteenth Annual International
ACM SIGIR Conference on Research and Development in Infor- mation Retrieval, pp. 318-329, 1992.
[2] L. Kaufman and P. J. Rousseeuw, “Finding Groups in Data: An In- troduction to Cluster Analysis”, John Wiley and Sons, March 1990.
[3] Aurangzeb Khan, Khairullah khan “Frequent Patterns Mining of Stock Data Using Hybrid Clustering Association Algorithm”, Uni- versity Technology PETRONAS.
[4] Dattatray P. Gandhmal et al “An optimized approach to analyze stock market using data mining technique” ICETT, 2011.
[5] J. Bezdek and S.K. Pal. Fuzzy Models for Pattern Recognition. IEEE,
pp. 88-94, 1992.
[6] A.K. Jain and R.C. Dubes. Algorithms for Clustering Data. New Jer- sey: Prentice Hall, 1988.
[7] Moving averages, Rob J Hyndman
,http://robjhyndman.com/papers/movingaverage.pdf
[8] Zhang, D.Q.—Chen, S.C.: A Novel Kernelized Fuzzy C-Means Al- gorithm with Application in Medical Image Segmentation. Artif. In-
tel. Med, Vol. 32, 2004, pp. 37–50.
IJSER © 2013 http://www.ijser.org
International Journal of Scientific & Engineering Research, Volume 4, Issue 8, August-2013 86
ISSN 2229-5518
[9] Albayrak, S.—Armasyali, F.: Fuzzy C-Means Clustering on Medical
Diagnostic System. Proc. Int. XII Turkish Symp. On Artif. Intel. NN,
2003.
[10] Dunn, J.C.: A Fuzzy Relative of the ISODATA Process and Its Use in
Detecting Compact Well-Separated Clusters. J. Cybernet, Vol. 3,
1973, pp. 32–57.
[11] Pal, N.R.—Bezdek, J.C.: On Cluster Validity for the Fuzzy C-Means
Model. IEEEFS, Vol. 3, 1995, No. 3, p. 370.
[12] Chen Yanyun, Qiu Jianlin, Gu Xiang,Chen Jianping, Ji Dan, Chen Li,
: Advances In Research Of Fuzzy C-means Clustering Algo- rithm,2011 International Conference on Network Computing and Information Security.
[13] Yujie Zheng, Clustering Methods in Data Mining with its Applica- tions in High Education,2012 International Conference on Educa- tion Technology and Computer (ICETC2012).
[14] R. Srikant and R. Agrawal. Mining generalized association rules.
VLDB’95, 407-419, Zurich, Switzerland, Sept. 1995.
[15] Richard D. Holowczak, Nabil R. Adam, Francisco J. Artigas, and Irfan Bora: Data Warehousing in Environmental Digital Libraries. September 2003/Vol. 46, No. 9ve COMMUNICATIONS OF THE ACM.
[16] Jiawan Han, Micheline Kamber “Data Mining Concepts and Tech- niques” 2nd edition 2004.
[17] Makridakis S. and S.C. Wheelwright, Forecasting Methods for Man- agement, John Wiley & Sons, 1989.
[18] Roy Bathcelor, Pami Dua: Roy Bathcelor, Pami Dua: Forecaster ide- ology, forecasting technique, and the accuracy of economic fore- casts. Volume 6, Issue 1, 1990, Pages 3–10.
[19] T. Warren Liao: Clustering of time series data—a survey, Volume
38, Issue 11, November 2005, Pages 1857–1874.
IJSER © 2013 http://www.ijser.org