International Journal of Scientific & Engineering Research, Volume 4, Issue 7, July-2013 578
ISSN 2229-5518
DENOISING OF MEDICAL IMAGES USING WAVELET TRANSFORM
Ajeet Singh
Abstract— A signal or an image is unfortunately corrupted by various factors which effects as noise during acquisition or transmission. The disturbances caused by various factors affect the image quality which leads to incorrect analysis and hence reduce image quality in terms of parameters like contrast, illumination variation. Noise decreases the performance of visual analysis and computerized analysis. The denoising process can be described as to remove the noise while retaining and not distorting the quality of processed image. The traditional way of denoising to remove the noise from a signal or an image is to use a low or band pass filter with cut off frequencies. However the traditional filtering techniques are able to remove a relevant of the noise, they are incapable if the noise in the band of the signal to be analyzed. Therefore, many denoising techniques are proposed to overcome this problem. The algorithms and processing techniques used for signals can be also used for images because an image can be considered as a two dimensional signal. Therefore, the digital signal processing techniques for a one dimensional signal can be adapted to process two dimensional images.
Index Terms— wavelets transform, Denoising threshold.
—————————— ——————————
HE wavelet transform (WT) a powerful tool of signal and image processing that have been successfully used in many scientific fields such as signal processing, image compression, Digital images
play an important role both in daily life applications such as satellite
communication, magnetic resonance imaging, computer tomography as well as in areas of research and technology such as geographical infor- mation systems and astrophysics. Data sets collected by image sensors are generally contaminated by noise. Imperfect instruments, problems with the data acquisition and interfering natural phenomena can all de- grade the data of interest. Furthermore the noise can be introduced by transmission errors and compression. Thus the denoising is often a nec- essary and the first step to be taken before the images data is analyzed. It is important to apply an efficient denoising technique to compensate for such data corruption. Image denoising is still a challenge for researchers because noise removal introduces artifacts and causes blurring of the images. This paper describes different methodologies for noise reduction (or denoising) giving an insight as to which algorithm should be used to find the most reliable estimate of the original image data given its de- graded version.
The paper is organised in such a way that the section 2 explain the concept of wavelet transform, section 3 explain the different types of thereshold estimation techniques, section 4 explain the image degnoising techniques section 5 explain the proposed method, section 6 shows the simulation result and section 7 summarises the paper.
————————————————
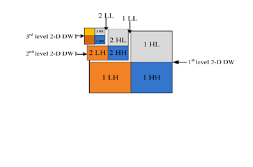
The 2D- wavelet transform is a flexible tool offering richer image resolu- tions. In the orthogonal wavelet decomposition procedure, the general step splits only the approximation coefficients sub-band of the image into four sub-bands. After the spliting, we obtain a sub-band of approxi- mation coefficients (LL) and three sub-bands of detail coefficients (LH – HL – HH). The next step consists of splitting the new approximation coefficient sub-band in a recursive manner where the successive details sub-bands are never re-analyzed. In the corresponding wavelet situation, each detail coefficients sub-band is also decomposed into four sub-bands using the same approach as in approximation sub-band splitting. The DWT for two levels is shown in Table. (1). the wavelet transform for an image gives a vast amount of sub-bands of wavelet coefficients at differ- ent resolutions.
TABLE 1
THE DWT FOR TWO LEVELS.
LL2 LL1 | HL2 LL1 | LL2HL1 | HL2 HL1 |
LH 2 LL1 | HH2 LL1 | LH 2 HL1 | HH2 HL1 |
LL2 LH 1 | HL2 LH 1 | LL2HH 1 | HL2 HH 1 |
LH 2 LH 1 | HH2 LH 1 | LH 2 HH 1 | HH2 HH 1 |
Fig.(1)-3 level wavelet transform
IJSER © 2013 http://www.ijser.org
International Journal of Scientific & Engineering Research, Volume 4, Issue 7, July-2013 579
ISSN 2229-5518
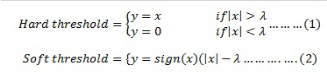
The estimated noise level is used in order to threshold the small coeffi- cient assumed as noise. The procedure of the signal denoising based on DWT is consist of three steps; decomposition of the image, thresholding and reconstruction of the image. Several methods use this idea proposed and implements it in different ways. When attempting to decrease the influence of noise wavelet coefficients, it is possible to do this in particu- lar ways, also the need of information of the given images leads to dif- ferent statistical treatments of the available information. In the linear penalization method every wavelet coefficient is affected by a linear shrinkage particular associated to the resolution level of the coefficient. It can be said that linear thresholding is appropriate only for homogeny signals with important levels of regularity. The wavelet thresholding or shrinkage methods are usually more suitable. Since the work of Donoho and Johnstone (Donoho and Johnstone 1994), they has done a lot of research on the way of defining the threshold levels and their type. Donoho and Johnstone proposed a nonlinear strategy for thresholding. In his approaches, the thresholding can be applied by implementing either hard or soft thresholding method, which also called as shrinkage. In the hard thresholding, the wavelet coefficient below a give value are stetted to zero, while in soft thresholding the wavelet coefficient are reduced be a quantity to the thresh value. The threshold value is the estimation of the noise level, which is generally calculated from the standard deviation of the detail coefficient (Donoho 1995). Equation (1) indicates the two types of thresholding, which can be expressed analytically as shown;
Where x is the input image, y is the signal after threshold and ℷ is the threshold value, which is critical as the estimator leading to destruction,
reduction, or increasement in the value of a wavelet coefficient
All digital images contain some degree of noise due to the corruption in its acquisition and transmission by various effects. Particularly, in medical image are likely disturbed by a complex type of addition noise depending on the devices which are used to capture or store them. No medical imaging devices are noise free. The most commonly used medical images are received from MRI (Magnetic Resonance Imaging) and CT (Computed Tomography) equipments. Usually, the addition
noise into medical image reduces the visual quality that complicates
diagnosis and treatment. Because the wavelet transform has an ability to capture the energy of images in few energy transform values, that’s why wavelet denoising technique is very effective as stated previous parts. As stated previous sections, when an image is decomposed using wavelet transform, the four subimages are produced, approximation details, horizontal details and vertical details and diagonal details. Fig. (3) Represents a sample medical image which belongs to a patient having MRI and its four sub band images when decomposed for one level using DWT. This image has acquired from a BT device. A noise added on MRI image and its denoised form using wavelet denoising procedure is given Fig. (3). The added noise has Gaussian distribution, and symlet 6, decomposition level of two, soft thresholding are chosen as wavelet denoising parameters.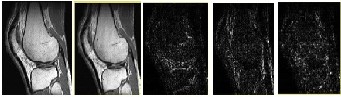
Fig.(2) Decomposition of a sample medical image; original, approxima- tion, horizontal details, vertical details, and diagonal details in left to right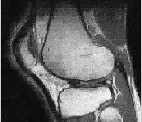
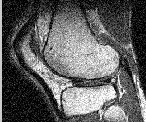
Fig.(3 ). A noisy image having PSNR 46 dB and its denoised version. Quantitatively assessing the performance in practical image application
is complicated issue because the ideal image is normally unknown. Therefore this approach is to use known images for the test, as in other image processing applications, in the test of performance of the wavelet denoising methods like two dimensional image denoising is used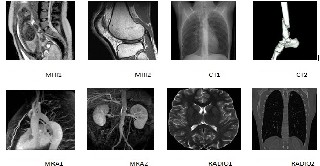
Fig. (4) Represents the medical test images to be used
IJSER © 2013 http://www.ijser.org
International Journal of Scientific & Engineering Research, Volume 4, Issue 7, July-2013 580
ISSN 2229-5518
Here, we use again a classical comparison receipt based on noise simulation. The comparison can be realized on the result reconstructed image and the original image after adding Gaussian white noise with known variance to the original image. Then it will be computed the best
image recovered from the noisy one. Firstly, we should determine the
effective decomposition level because the most important factor in wave- let denoising is decomposition level. For this purpose, a noise added image will be used to obtain how the performance is changing respect to the decomposition level. The recovering process is performed on the test image given in Fig( 4), on which a Gaussian noise added to be
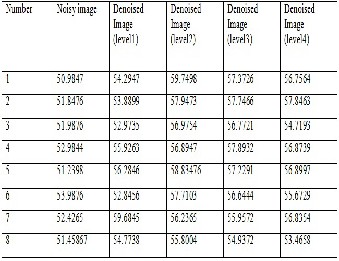
PSNR is 62dB. The noisy image and a sample recovered or denoised is given Fig. (3), respectively. The PSNR values after denosing process is given Table 3. In this denoising process, the symlet 6 and universal thresholding is chosen as mother wavelet and noise level estimator.
Step 1- Take a medical image
Step 2 -Add noise (salt $ pepper noise on image) Step 3-Take the dwt wavelet transforms
Step 4-Apply soft threshold techniques in all the sub bands
Step 5-Take inverse wavelet transform
Step 6 -Apply soft threshold method to all four level
Step 7 -Find the psnr of denoised output image
.
The performance evolution of the denoising approach is checked against various levels. The Peak-Signal-To-Noise ratio is defined as:
PSNR=10log (255)2/MSE……………………(3)
![]()
Where MSE is the mean simage and is defined as follows:
)
Where m,n give the size of the image and I(i,j),K(i,j) are the pixel values at location (i,j) of the original and noisy image respectively :
The best PSNR is obtained at the decomposition level of two. As can be seen in Table 3, the result PSNR value is decreasing if the decomposition level getting higher. The wavelet transform concern the main component of the original image when the decomposition level is increased. If the decomposition level of the image is higher, the thresholding can elimi- nate some coefficients of the originalimage signal, as in one dimentional signal denoising process. Therefore, to increase the decomposition level too high will decrease the PSNR after an optimal level and also increase the complexity of decomposition. In further part, the decomposition level is chosen as two because the performance of the DWT denoising obtained at this level. Another question about the performance of the wavelet denoising is if it is dependent on the content or the distribution of the coefficient of the image. We can answer the question by applying the denoising algorithm on different images. Table 2 represents the PSNR values respect to the number of the test images given in table. 3 after the denoising process.
The wavelet denoising techniques offers high quality and flexibility for the noise problem of image. The performances of denoising methods for several variations including thresholding rules were examined in the examples in order to put forward the suitable denoising results of the methods. The comparisons have made for the three threshold estimation method give good and acceptable results. The examinations have showed that most important factor in wavelet denoising is what the
decomposition level is, threshold type or the estimation of threshold
IJSER © 2013 http://www.ijser.org
International Journal of Scientific & Engineering Research, Volume 4, Issue 7, July-2013 581
ISSN 2229-5518
value. However, someone has not seen any noteworthy differences in the methods from level one to level six, after this level, rigresure method has showed a better performance than the other methods in terms of SNR level. Consequently, it is determined the denoised version of image is very good to persieve and acceptable with good PSNR.
The authors would like to acknowledge the Encyclopedia of medical images as the source of the images used in this research (http://www.images.md/).
[1] M. and C. Mello (1998). Wavelets for biomedical signal processing, IEEE.
[2] Akay, M., J. Semmlow, et al. (1990). "Detection of coronary occlu-
sions using autoregressive modeling of diastolic heart sounds." Bi- omedical Engineering, IEEE Transactions on 37(4): 366-373.
[3] Alfaouri, M. and K. Daqrouq (2008). "ECG signal denoising by wavelet transform thresholding." American Journal of Applied Sci- ences 5(3): 276-281
[4] Beylkin, G., R. Coifman, et al. (1991). "Fast wavelet transforms and numerical algorithms I." Communications on pure and applied mathematics 44(2): 141-183.
[5] Blu, T. (1998). "A new design algorithm for two-band orthonormal rational filter banks and orthonormal rational wavelets." Signal Pro- cessing, IEEE Transactions on 46(6): 1494-1504.
[6] Buades, A., B. Coll, et al. (2006). "A review of image denoising
algorithms, with a new one." Multiscale Modeling and Simulation
4(2): 490-530
[7] Chang, T. and C. C. J. Kuo (1993). "Texture analysis and classifica- tion with tree-structured wavelet transform." Image Processing, IEEE Transactions on 2(4): 429-441.
[8] Chen, G. and T. Bui (2003). "Multiwavelets denoising using neigh- boring coefficients." Signal Processing Letters, IEEE 10(7): 211-
214.
[9] Chen, G., T. Bui, et al. (2010). "Denoising of three dimensional data cube using bivariate wavelet shrinking." Image Analysis and Recognition: 45-51.
[10] Cohen, A., I. Daubechies, et al. (1993). "Wavelets on the interval
and fast wavelet transforms." Applied and Computational Harmonic
Analysis 1(1): 54-81.
[11] Daubechies, I. (1990). "The wavelet transform, time-frequency localization and signal analysis." Information Theory, IEEE Trans- actions on 36(5): 961-1005
[12] Do, M. and M. Vetterli (2002). Texture similarity measurement using Kullback-Leibler distance on wavelet subbands, IEEE
[13] Donoho, D. L. (1995). "Denoising by soft-thresholding." IEEE
Trans. Inform. Theory 41(3): 613-627.
[14] Donoho, D. L. and I. M. Johnstone (1994). "Ideal spatial adaptation via wavelet shrinkage." Biometrika 81(3): 425-455.
[15] Jing Tian , Li Chen Image despecling using a non-parametric statis- tical model of wavelet coefficients Biomedical signal processing
and control 6 (2011) 432-437
[16] Jing Tian, Weiyu Yu, Lihong Ma, AntiShrink: Ant colony optimi- zation for image shrinkage, pattern recognition Letters Science Di- rect 31 (2010) 1751-1758
IJSER © 2013 http://www.ijser.org