International Journal of Scientific & Engineering Research Volume 4, Issue 2, February-2013 1
ISSN 2229-5518
Control Flow Tracer - A method for quicker understanding of code
Arul Siva Murugan Velayutham, Ramakrishna Rajanna, Mayank Gupta
Abstract— Understanding a huge and complex code base is a challenging task. New software engineers would struggle to find the executed code for a particular feature. Locating the files/classes/methods related to a particular application feature can be daunting a task until they are familiar with the code. This paper will be discussing a method to help understanding application code faster with minimal effort.
Index Terms— Tracing Code Execution, Software Engineering, Debugging, Code Comprehension, Code Learning, Control Flow, Code
Bubbles.
—————————— ——————————
1 INTRODUCTION
racer is a tool whose main objective is to save the control flow of the core component of code and present to the
user as a animated video play mode or listing for the easy search mode with following are the objectives.
Easy to use with any binary and users should have ability to control when to trace.
Must not change the normal execution behavior.
Ability to trace every thread.
Minimal performance impact when being traced and oth- erwise no impact.
Ability to filter packages/classes to be traced.
Automatic elimination of repeated sets of traced records occurring due to loops in the code.
Traces generated once can be viewed multiple times with
good visualization for easy conceptualization.
This tool is aimed only at understanding the code easier and
not for debugging or using it as a profiler, though it is using concepts from the profilers.
2 EXISTING TECHNIQUES
Why another tool and not debugger or log statements? Debugger will be difficult to use at the initial stage of code understanding, especially when there are many implementations of the interface and dynamic bindings. It will be difficult for new developers to narrow down the relevant implementation. They may be struggling to put the break point at appropriate places and needs to make the conscious decision of step-in or step-out or step-return. This is a very time consuming process. Thread based callbacks makes the process trickier. These limitations force the developers to run
Arul Siva Murugan Velayutham was working at Google India, Banga- lore. E-mail: arulsmv@gmail.com
Ramakrishna Rajanna is currently working at Google India, Banga- lore. E-mail: ramakrishna.r@gmail.com
Mayank Gupta was an intern in Google India, Bangalore. Email:
m08genius@gmail.com
the debugger multiple times. Log/print statements also leave the developers in similar state.
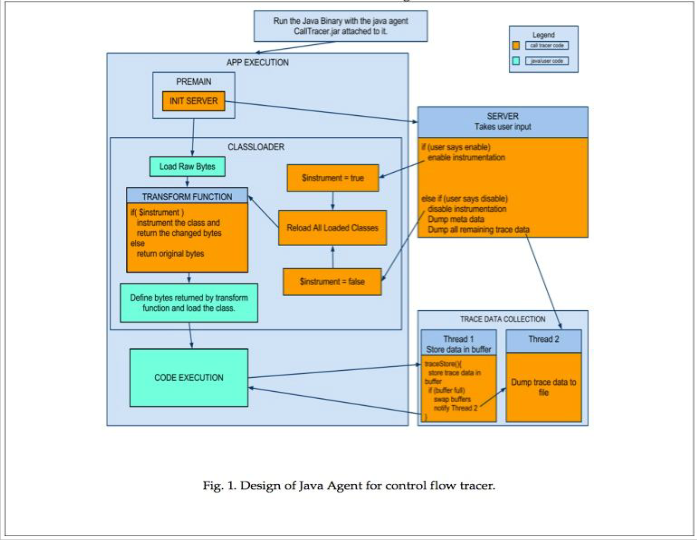
3 DESIGN OF CONTROL FLOW TRACER
To achieve the objectives we have built two components.
1. Control flow Tracer (or) Call Tracer
2. Code Visualizer.
The Control Flow Tracer is used to instrument the binary and control the traces of the execution and the code visualizer is used to view the trace after the execution of the binary.
The Control flow tracer is a Java agent with Trace control server and Class Transformer.
The code visualizer comes with two approaches:
Call-graph mode: Ability to play calls made during the execution as animation and expand the call graph in sequence
List mode: List of the function calls in the order of sequence. It can be easily search-able for the function. Visualizer is an independent entity like code bubble [1] that can
be used for general code browsing and explained in later part
of the paper. This paper focuses on the Java binaries, however the concept is very generic and can be extended for other languages.
3.1 Java Agent
Java 1.5 introduced Java agents, which provide a way to in strument classes at load/run time. Control flow tracer (Fig.1) is a Java agent to instrument the needed classes so that the executed lines are tracked. Control flow tracer listens on con- figurable port for trace commands. The path to Control flow tracer agent must be passed as jvm_arg (javaagent) to the
application.
IJSER © 2013 http://www.ijser.org
International Journal of Scientific & Engineering Research Volume 4, Issue 2, February-2013 2
ISSN 2229-5518
3.2.1 Trace control server
Trace control server listens on the given port for start and stop commands. It takes inclusion and exclusion filters for each trace started.
On receiving start command, the server attaches the tracer transformer to jvm and instructs to reload all the classes. The transformer instruments classes to record the execute lines and the reloads them. On receiving the stop command the server detaches the transformer and reloads the original classes and spans another thread for generating a report that can be used for both graph mode and list mode visualizations.
3.2.2 Class Transformer
Class transformer is modified version of Emma[2] which is an open source code coverage tool. Emma provides code coverage logging and report generation. The functionalities of Emma that were reused with some modifications include: Block Detection: Block is a nonbranching sequence of in structions. Data collection optimized by only logging at block level. Emma does not treat a function call as a branching instruction but it is modified here to treat function call as end of block just like other branching instructions.
Class Metadata generation: At the time of tracing Classid,
methodid and blockid are stored in a trace file. Corresponding mappings of classid to classname, methodid to methodname and blockid to line numbers are stored in a metadata file.
Filter: Transformer should not transform all the classes. It should only transform classes which pass the inclusion and exclusion package filters. Protocol Buffers[3] are automatically detected by looking at interface implementations. Similarly other generat ed files like gxps can be auto detected. Instrumentation: Emma is used to interpret the raw “.class“ files and instrument the application classes to log execution se quence. At the end of each basic block, the following five lines of opcodes are added for tracing the basic blocks that are executed.
load classidD
load methodidD load blockidD load opcode
DgetstaticrefIndexToStaticMethodD
The values of variables classid, methodid and blockid are calculated during the static analysis and hence they are essentially integer constants being loaded at time of instrumentation. A constant pool entry, referring to the static
International Journal of Scientific & Engineering Research Volume 4, Issue 2, February-2013 3
ISSN 2229-5518
method “printClassIDMethodIDBlockID()” is made and it’s reference index is loaded.
Report generation: Emma is modified to generate the report
by reading the class metadata and trace data.
4 TRACE DATA COLLECTION DESIGN
As mentioned earlier, the user’s application binary will be invoked with additional jvm_arg along with all the arguments needed for the binary. jvm_arg will point to the Java agent with filters and port parameters. Once the tracing is enabled, trace records are collected and stored for each basic block.
4.1. Trace Records
Each of the traces will have the one byte threadid, four bytes classid, four bytes methodid, four bytes blockid, and the one byte for type of the opcode that identifies the block.
4.2. Trace Collection
The tracer has a static method “printClassIDMethodIDBlock ID()” which is called with classid, methodid, blockid and opcode representing the basic block at every basic block level indicating that this block is the one being executed stored in an inmemory data buffer. At this point thread id is also recorded. Thread names lead to better comprehension than thread ids. However collecting thread name at every block downgrades performance. Instead Java’s threadlocals were used to populate the thread idthread name mapping in a Threadlocal variable's init method. And a “tim” file with thread Id Mapping is generated for the future references. This ensures there is negligible performance hit in thread name col lection during thread context switch.
4.3. Dumping Thread
The “trace data” is periodically dumped in a separate thread. This model was chosen as we did not want the application to be blocked while data is written to disk/ sent over network.
Efficiency is achieved by extending producer con
sumer problem[4]. Simple technique of maintaining two buffers (each of size 32M) is used. When “trace data collection” is enabled, the data is collected in one of the buffers. As soon as the buffer is full, the two buffers are swapped. Also, the dumping thread is no tified with the first buffer to dump the collected data. Dumping 32MB data to file takes approximately 25 milliseconds. The buffer sizes can be configurable to suit different applications.
The collected data consists of threadid (1 byte), class
id (4 bytes), methodid (4 bytes) and blockid (4 bytes)
and opcode (1 byte). This data is collected for every basic block (when “trace data collection” is enabled). The data is dumped in binary format (faster) in “trace.etr” file. The requisite mapping of the IDs to the names is dumped as metadata in “trace.em” file.
When “trace data collection” is disabled, the dumping
thread finally dumps of the data of the active buffer.
5 SCALABILITY
Data generated is huge when all the application classes are traced. We use several techniques to reduce this size.
1. Inclusion and Exclusion filters: Users can provide the packages they are interested in the form of inclusion and exclusion filters. This greatly limits the classes instrumented and therefore reduces the data size and improves performance.
2. Automatic generated file detection: Generated files
might have some unique fields which can be looked for in the .class files to detect and remove them from instrumentation.
3. Loop Sequence: Loops are the biggest contributor to the trace data. The algorithm is explained in the fol lowing section.
6 REPORT GENERATION
Report can be generated from the traces that were collected during the tracing. In order to reduce the number of trace records, some optimization are done at the time of generating report.
6.1 Loop Sequence removal
Most of the iterations have the same execution sequence providing little value in understanding the code. Finding unique paths will greatly reduce the data size and also im prove comprehension with concise data.
At the time of report generation, a “best effort” pattern[5] matching algorithm is used to remove repeated sequences oc curring due to loops. Only unique paths in the iteration are preserved.
6.2 Identification of Function Boundaries
In order to identify the call levels keeping track of the calls and returns/throw is essential and is achieved by recording the basic blocks opcode type with CALL, RETURN, THROW and OTHER along with the threadid and carefully moving between call levels whenever call or return/throw is encoun
IJSER © 2013 http://www.ijser.org
International Journal of Scientific & Engineering Research Volume 4, Issue 2, February-2013 4
ISSN 2229-5518
tered. For example when CALL is encountered next set of the trace records of the same thread are treated as new sequences of the execution and when return/throw is encountered, it is returning to the previous call sequence, at this time the loops boundaries are identified and repeated sequence intervals are marked.
6.3 Identification of Loop Boundaries
Loop sequences are identified from the traces by examining them with some clues. If there were trace records from the same call level but have the next blockid lesser than the current trace record's blockid then it is a backward jump. This determines the loop boundaries. For each of the identified loop boundaries, the sequence of the block executed at that call level are tracked. If it happens to be already found sequence, then the corresponding interval in the trace is marked as duplicate for removal.
6.4 Complications with Instrumentation filter
In the trace records from single thread, identifying the calls that are made between instrumented code and noninstru mented code is very essential. There are three possible cases of the calls that are made
Instrumented code calls a function that is instru
mented
Instrumented code calls a function that is nonin
strumented
NonInstrumented code calls a function that is in
strumented D
Trace records about nonInstrumented code calling a function that is also noninstrumented will not be recored. Identifying
the call levels for each of the case are handled by opcode of the next trace record and block id of the next sequence.
If a call opcode trace record is followed by the block id that is zero and the class id and method Id are the called then it is an instrumented method calling in strumented method. Next set of sequences are for new call levels (i.e) invoked method/function.
If a call opcode trace record is followed by nonzero
blockid and the classid and methodid are the same then it is an instrumented method calling non instrumented method. Next set of sequences are continuation of the current call level (ie) same method.D
If a return opcode trace record is followed by classid
& methodid that matches to the previous call level and the blockid value of the next is greater than that of the previous call levels blockid it is a return from an instrumented method to direct call of the methodD
If a return opcode trace record is followed by classid
& methodid that does not match to the previous call level but the blockid value is zero, then it is return from instrumented method to a noninstrumented method and a call to instrumented method is considered as indirect calls.
6.5 Finalizing the trace reports
IJSER © 2013 http://www.ijser.org
Inte
ISS
The trace records that are outside the marked (by loopse quence remover) intervals are considered for report genera tion. Then remapping the Classid, Methodid & Block Id to corresponding Java class method line numbers are done and written to the report with opcode. Opcode is used for animated graph mode to deduce the graph structure. And this report can be used again for given version of the code depot any time later.
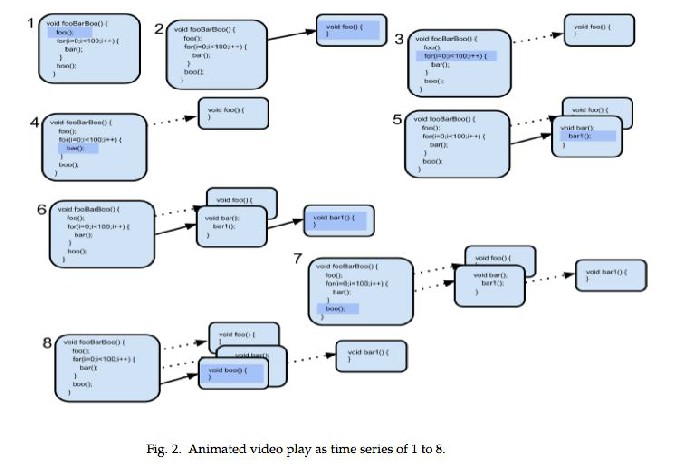
7 VISUALIZER
Visualization is the key for understanding the complex code. The callgraph mode visualizer is based on the codebubble. It will start animations as video by highlighting the execution part and displaying the methods or functions as and when required. Fig 2 Illustrates the visualization with simple example code as time series during the callgraph mode. Even though methods “bar” and “bar1” called and executed 100 times the visualizer will show only few of them that are need ed for the code understanding of particular feature.
Here in this example At first the method “fooBarBoo()” calls method “foo” and was shown as time series 1 and 2. And time series 3 shows, the control returned to “fooBarBoo” highlighting the “for” loop execution and so on. At the end of the time series 8th one shows all the functions that were executed. This will help the engineer to look at all the methods
at a time than going back and searching for the meth ods for
understanding part of the complex code.
The visualizer is rich in the functionalities like zoom, replay, stepback etc. Also during the playing of the execution it can be controlled and other parts of the graph can be expand ed manually by clicking the methods.
8 PERFORMANCE ANALYSIS
In our experiment with Gmail Frontend server, we achieved
85% reduction (on an average) in data size. No performance hit when tracing is disabled and 30100% performance hit de pending on the inclusion and exclusion filters.
For “Send mail” feature we brought down the number of trace records to less than 5000 trace records. Playing this code exe cution in graph mode visualization completed in 30 mins with two seconds pause between function calls.
IJSER © 2013 http://www.ijser.org
International Journal of Scientific & Engineering Research Volume 4, Issue 2, February-2013 6
ISSN 2229-5518
9 CONCLUSION
This technique helps in new team members to quickly find and understand the relevant code in a few minutes. Unlike de buggers this is a faster technique to follow the execution se quence for any user action. Coupled with different visualiza tions this is a very productive tool for developers to quickly start working on new large projects.
REFERENCES
[1] Code Bubbles: A Working Setbased Interface for Code Understand ing and Maintenance. Andrew Bragdon, Robert Zeleznik, Steven P. Reiss, Suman Karumuri, William Cheung, Joshua Kaplan, Christo pher Coleman, Ferdi Adeputra, and Joseph J. LaViola Jr
[2] Emma http://emma.sourceforge.net/
[3] Protocol buffers: https://developers.google.com/protocol-
Dbuffers/docs/overview
[4] Implementation and Experimentation of ProducerConsumer Synchronization Problem: Syed Nasir Mehmood, Nazleeni Haron and Vaqar Akhtar, Younus Javed,
http://www.ijcaonline.org/volume14/number3/pxc3872398.pdf
[5] Detection of interspread repeat sequence in genomic DNA sequence.: Mu rakami H, Sugaya N, Sato M, Imaizumi A, Aburatani S, and Horimoto K. http://www.ncbi.nlm.nih.gov/pubmed/15712120
IJSER © 2013 http://www.ijser.org