International Journal of Scientific & Engineering Research, Volume 3, Issue 10, October-2012 1
ISSN 2229-5518
Comparison of GIS based SCS-CN and Strange table Method of Rainfall-Runoff Models for Veeranam Tank, Tamil Nadu, India.
M.Latha, M.Rajendran, A.Murugappan
Abstract - One of the major problems confronted by the hydrologists for many years is the prediction of runoff from a given basin for a known rainfall. In this situation, development of a rainfall runoff model is important in Veeranam tank catchment located at latitude 11°
15’00” and longitude 79° 30’00’ E in Cuddalore District of Tamilnadu, India. By considering the above said aspect the rainfall-runoff model studies were carried out by using two rainfall-runoff models, one of the empirical strange method and SCS-CN method. All these works are carried out for three rain gauge stations, namely Jayankondam, Lower Anaicut and Senthurai station which come under Karuvattuodai sub watershed (4B1A5F) of Coleroon river basin, Tamilnadu, India with four years of daily rainfall (2000 – 2004). From the results it is inferred that scs – in method yields more run off than strange Table method even by considering the parameters which influence run off characteristics.
Index Terms - Runoff Model, Remote sensing and Geological information system Soil conservation service – curve number, strange table
1 INTRODUCTION
—————————— ——————————
ater is the elixir of life and a precious gift of nature to the mankind. It is fast becoming a scarce commodity in most parts of the world. The source of all water on the
globe is precipitation. Proper estimation of run-off magnitude is required for efficient design, planning and management of river basin projects that deal with conservation & utilization of water for various purposes. To determine accurate quantity of surface run-off that in any river basin, understanding of the complex relationship between rainfall and run-off processes of particular basin is necessary. Because it depends on many geo morphological and climate factors etc., The strange method can be used with a reasonable degree of accuracy for the pre- diction of run-off from catchments of irrigation tanks and small reservoirs (Krishnan P.S 1987). The SCS model was mod- ified with a small change in the formula of initial abstraction is
0.2s (for US soil condition) changed into 0.3s (for Indian soil condition) for getting the good results. (Karmegam, et al.(1994). The estimation of run-off using GIS based SCS meth- od can be used in watershed management efficiently. (Poongothai. et al(2007)). The combination of remote sensing
&SCS model makes the run off estimate more accurate and fast. Geographical information system arises as an efficient tool for the preparation of most of the input date required by the SCS curve number model.
————————————————
M.Latha is a Ph.d Scholar in the Department of Civil Engineering
Annamalai University, Tamilnadu, India – 608 002
E-mail: kmlatha@gmail.com
M.Rajendran, Professor, Department of Civil Engineering, Annamalai University, Tamilnadu, India – 608 002
A.Murugappan, Professor & Head, Department of Civil Engineering
Annamalai University, Tamilnadu, India – 608 002
The run off estimated using SCS curve number model are comparable with the run off measured by the conventional method. P.Sunder et al, (2010). The statistical analysis indi- cates that the SCS CN method can be applied to predict run off- depths of ungauged watershed. The same reveals that re- mote sensing and GIS based SCS- CN model can be used effec- tively to estimate the run off from the ungauged Indian water- shed of similar geo-hydrological characteristics. N.Nagarajan and S.Poongothai (2011)
2 STUDY AREA
Veeranam tank is one of the biggest tanks in Tamil Nadu, built during the reign of the Chola Dynasty, some time in the
9th century A.D and it is located at longitude 79º 30’E and Lat- itude 11º 15’N and about 24 km west of Chidambaram town, in the Cuddalore District, Tamil Nadu. The tank lies between the Vellar and Kollidam rivers in the Eastern Coastal plain tract. Geographical location of the Veeranam is shown in fig
2.1
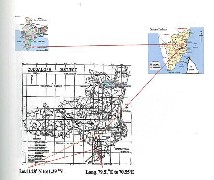
Fig. 2.1 Veeranam Tank Location
IJSER © 2012
http://www.ijser.org
International Journal of Scientific & Engineering Research, Volume 3, Issue 10, October-2012 2
ISSN 2229-5518
The Veeranam tank has a tropical climate with a hot sum- mer and a mild winter. Agro-Climatically the area falls under the group of semiarid regions. Veeranam basin lies between latitudes 11° 15’N and Longitudes 79° 30’E covering a total catchment of 427.35 sq. km. Veeranam tank is mainly an irriga- tion tank receive it’s main source of water from lower Coleroon anicut system through Vadavar channel is 2200 Cu. Sec. In addition to these Sengal Odai and Karuvattu Odai are the main source of drainage water from it’s own catchement. In this paper, the rainfall-runoff process of one of the sub ba- sin, Karuvattu odai is considered for the study. The catchment area was predominantly influenced by North East Monsoon in the month of October to December accounts for nearly 57% of total rainfall. The total annual average rainfall of the basin is
1415mm.
3 WATERSHED DATABASE
The data required for this study are acquired from several organizations and they are listed below.
The IRS I - C, False Colour Composite and LISS – III data of scale 1: 50,000. Based on this data, The base map, drainage map, and land use map are pre- pared.
Daily rainfall data (2000-2004) of Jayankondam, Low- er anicut and Sendurai rain gauge stations are used. (Source: Ground Water Division, PWD and Depart- ment of Statistics, Chennai)
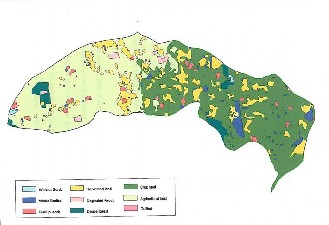
Fig. 3.2 Land use Map of The Study Area
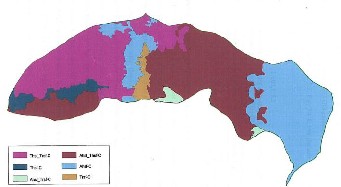
Fig. 3.3 Soil Map of the Study Area
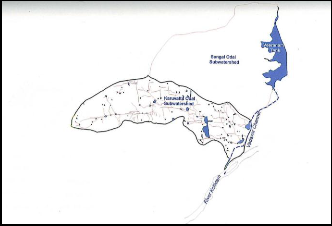
Various thematic maps such as Drainage, land use and soil map of the study area are prepared by using GIS
software Map info and depicted in the fig 3.1, 3.2 and 3.3. 4 METHODOLOGY
The methodology adopted for estimating the run-off depth in this study are Strange and SCS methods are described in the sub-section. The study period is 4 years of rainfall (2000-2004) for three rain gauge stations are considered.
Fig. 3.1 Drainage Map of the Study Area
4.1 Strange Table Method
One of the widely used empirical methods for computa- tion of runoff yield is the one developed by Strange. He con- ducted his experiments in Bombay Presidency and framed his tables based on his observations. He developed a set of curves for the Bombay Presidency catchments. In these curves the runoff is read as percentage of rainfall. According to the yield- ing qualities, he classified the catchments as good, bad and average. For a certain rainfall, if the catchment yields a copi- ous runoff, it is classified as good. If the yield is poor, it is clas- sified as bad. All those catchments lying between these two types are classified as average catchments.
Hence a good catchment is the one which gives more runoff
IJSER © 2012
http://www.ijser.org
3
International Journal of Scientific & Engineering Research, Volume 3, Issue 10, October-2012 3
ISSN 2229-5518
for the same rainfall, compared to average and bad type of catchments.
Krishnan P.S. (1987) has used the Strange table method in one of the small catchment of a tank in Tamilnadu state with a reasonable degree of accuracy for the prediction of run- off for catchments of irrigation tanks and small reservoirs. This method is one of the widely used empirical methods by Government department dealing with irrigation, including public works department of Tamil Nadu. This approach is preferred to many other recently developed ones, due to its simplicity and easy adaptability.
tion, surface storage, are of which occur before runoff begins. The relation between Ia and S (which includes Ia) was devel- oped by means of rainfall and runoff data from experimental small watersheds. The empirical relationship is:
Ia = 0.3S (For Indian Conditions)
the term S is the potential maximum retention and it is given by
25400
4.2 Soil Conservation Service Method
The Soil Conservation Service Curve Number method is used to estimate surface runoff volume from the rainfall
S =

254
CN
depths. This method takes into account the land use, hydro- logical soil cover and antecedent moisture conditions for pre- dicting the yield from the basin.
For the simpler storm, the relation between rainfall, runoff and retention can be expressed as,


F Q S P
where,
F - Actual retention in mm
S - Potential maximum in mm (S F) Q - Runoff in mm
P - Precipitation in mm (P Q)
where CN is known as the Curve Number, which can taken from the tables, Chapter – 7, SCS Hand book, Section – 4 (1972)
5 COMPUTATION OF RUNOFF
In Strange table method catchment is classified as dry
– damp – wet by various transition conditions. For daily rain-
fall, the corresponding runoff of the catchment is computed
using strange Table.
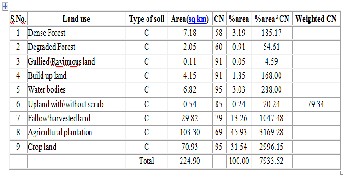
The weighted curve number for the catchment is es- timated as per the SCS methodology and results are depicted in Table 1. Potential maximum retention is calculated by us- ing the estimated Curve number and by giving the daily rain- fall and potential maximum retention as inputs the run off is calculated.
The volume of runoff (Q) depends upon the volume of precipitation (P) and the volume of storage that is available for retention. The potential retention S is a constant for a particu- lar storm because it is the maximum that can occur under the existing conditions if the storm continues without limit.
Using equation
TABLE : 1
WEIGHTED CURVE NUMBER (AMC II) FOR THE STUDY AREA
P I a

Q = P I a S
which is the rainfall – runoff relation with the initial abstrac- tion taken into account.
Initial abstraction consists mainly of interception, infiltra-
A sample data set (2000 -2004) of results of Jayankondam station only are presented in Table No.2 & Fig. 5.1.
IJSER © 2012
http://www.ijser.org
International Journal of Scientific & Engineering Research, Volume 3, Issue 10, October-2012 4
ISSN 2229-5518
TABLE: 2
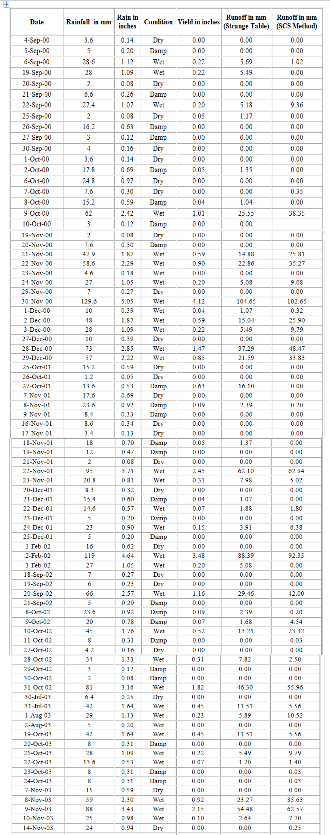
RUN-OFF OF THE JAYANKONDAM STATION BY AREA BY STRANGE TABLE AND SCS METHOD
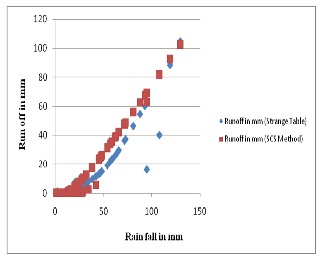
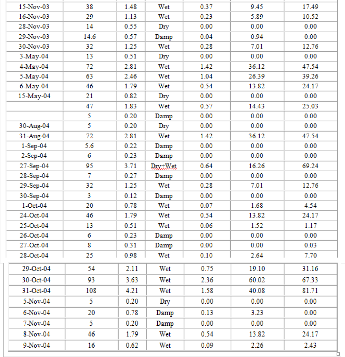
Fig. 5.1 Run off of Jayankondam by SCS and strange table method
6 RESULTS DISCUSSION AND CONCLUSION
In this study the runoff is estimated to ‘Karuvattu odai sub water shed (4B1A5F) of veeranam tank comes under coleroon river basin, Cuddalore District, Tamil Nadu, India located at latitude 11 15’N and longitude 79 30’ E by two methods namely strange Table and SCS – CN method and compared. The strange table method recommended by Krishnan P.S
IJSER © 2012
http://www.ijser.org
International Journal of Scientific & Engineering Research, Volume 3, Issue 10, October-2012 5
ISSN 2229-5518
(1987) gives lesser runoff which is an empirical method used by Government department dealing with irrigation, including public works department of Tamil Nadu and is a thumb rule
considers only previous ten days rainfall to calculate runoff. 5
But the SCS-CN method recommended by Manokaran.A, Murugappan.A, (2012), N.Nagarajan, and S.Poongothai (2011) and W.de, Hamer, D Love, M.J. Booij, for calculating runoff for ungauged catchments gives more runoff than strange table method even by considering all the parameters which influ- ences runoff namely soil type, land use pattern and antecedent soil moisture conditions. From this study it is inferred that SCS – Curve Number suits to this study area to calculate run- off to an ungauged catchments.
ACKNOWLEDGEMENT
This study is part of the research scheme on “Rain Water Harvesting in Veeranam Catchment” funded by Ministry of Water resources, Govt.of. India. Authors thank the funding and Annamalai University authority to carry out the above said research work. Thanks are also due to NRSA, Hydrabad and PWD (Tamilnadu) for providing their valuable data re- quired for this study.
REFERENCES:
[1] Arun K. Saraf, Kundu, P. and Sharma, B. (2003). “Integrated Remote Sensing and GIS in groundwater recharge investigation and selective of artificial re- charge sites in a hard rock terrain”. Department of Earth Sciences, Indian Insti- tute of Technology, Roorkee – 247667, India.
[2] Chen, S.J. and Singh, V.P (1993), “Improved SCS models for computing Run- off Volume”. Hydrology Journal, pp. No. 14-18, Vol.16, No.1 & 2, January - June 1993.
[3] Chow Ven Te, David R. Maidment and Larry W. Mays (1988), “Applied
Hydrology”, McGraw – Hill book Company, New York.
[4] Karmegam, M. (1994), “Rainwater harvesting in vaippar Basin”, Centre for water resources, Anna University.
[5] Krishnan P.S. (1987), “Yield estimation for Pandiyanallur tank”, M.E., thesis
Annauniversity.
[6] Poongothai, S. and Thayumanavan, S. (2002a). “Estimation of Runoff from a Watershed Using GIS Based SCS Method”. Proceedings of National Seminar on Water Resources Systems Planning and Management, 7-8, March 2002, Department of Civil Engineering. Annamalai University, Annamalai Nagar, pp – A27 – A37.
[7] Pramod Kumar (1991), “Establishing SCS Runoff Curve number from IRS Digital Database”, Journal of Indian Society of Remote Sensing, Vol. 19, No. 4, September 1991, pp. No. 245 – 250.
[8] P.Sundar kumar et.al,2010. Analysis of the Run off for watershed using SCS –
CN Method and Geographic information systems. Vol.2(8) 2010, 3654-3947.
IJSER © 2012
http://www.ijser.org