for 15 min at 3000rpm. After centrifugation, both phases become transparent with a clear phase boundary. The phenol concentration in the dilute phase was measured using UV-visible spectrophotometer wavelength at 530 nm.
International Journal of Scientific & Engineering Research, Volume 5, Issue 1 2, December-2014 18
ISSN 2229-5518
Cloud point extraction of Phenol using TX-100 as non-ionic surfactant
M.D. Duraimurugan alias Saravanan 1, D.K. Shanmugapriya 1, P.Kalaichelvi 1, A.Arunagiri 1,*
1 Department of Chemical engineering, National Institute of Technology, Tiruchirappalli -620015, Tamil nadu, India. email: durai_sar2003@yahoo.co.in
Abstract - Cloud point extraction is one of the surfactant-based separation technologies based on the clouding phenomenon of non-ionic surfactants. In this study, the experiments are carried out to study the effect of non-ionic surfactant concentration and additives concentration on Cloud point of non-ionic surfactant which is one of the design parameter for the cloud point extraction system. The effect of surfactant concentration, solute concentration, electrolytes concentration and operating temperature on the vital parameters of the system such as phase volume ratio (RV), pre-concentration factor (fC), solute distribution coefficient (Kd) and extraction efficiency (η %) has been studied. In the present study, Triton X-100 and phenol are used as non-ionic surfactant and solute respectively. In order to study electrolyte effects, NaCl and Na2SO4 are used for salting-out effect and NaI and NH4SCN are used for salting-in effect.
—————————— ——————————
The removal of aromatic compounds is paid more attention recently, due to their carcinogenic and mutagenic characteristics. The amount of this type of compounds discharged into the environment is increasing day by day, especially in hydrosphere. Phenol is one of the major pollutants which have toxic effects on human health. The ingestion of phenol polluted water in the human body causes proteins degeneration, tissue erosion and paralysis of the central nervous system and also damages the kidney, liver and pancreas. Hence, it is necessary to remove the phenol from effluents before discharging into the water stream. However, because of their low solubility in water, common separation methods are inefficient in its acquirement and for its analysis. In treatment of water containing aromatics, traditional methods, such as coagulating sedimentation, adsorption, oxidation or biodegradation methods, are inefficient or costly in time or money [1], [2]. Hence, it is necessary to identify the new separation technique. Even there are different separation techniques are available; recently the CPE (micelle mediated separation process systems) is identified as one of the potential separation system [3].
Aqueous solutions of non-ionic surfactants turn cloudy at a definite temperature on heating and this temperature is referred to as the Cloud Point temperature (CP). This clouding phenomenon is caused by the decreased solubility
of a surfactant in aqueous media as a result of weakening of hydrogen bonding between a water molecule and the hydrophilic moiety of the surfactant due to heating. By allowing the solution to settle at a temperature above the cloud point, phase separation takes place. The smaller phase contains most of the surfactant and usually sinks to the bottom, some cases at the top called as surfactant rich phase. This unique surfactant solution phase separation phenomenon has been utilized in the design of some creative extraction, pre concentration and purification schemes. This is known as Cloud Point Extraction (CPE) [3].
Triton X-100 is used as non-ionic surfactant. It is an octylphenol ethoxylate consisting of 9 to 10 moles of ethylene oxide and abbreviated as TX-100. It is a high purity and water-soluble liquid. Phenol is used as solute. K2HPO4 and KH2PO4 are used for the preparation of phosphate buffer. Ammonia is used to maintain the pH of the solution. 4-amino antipyrene and potassium ferricyanide are used as coloring agent. The electrolytes used are Sodium chloride and Sodium sulfate, Ammonium thiosulphate and Sodium iodide
The determination of the cloud points was carried out in a water-bath with a good temperature control within 0.1C. The phase separation can be achieved using centrifugation
IJSER © 2014 http://www.ijser.org
International Journal of Scientific & Engineering Research, Volume 5, Issue 1 2, December-2014 19
ISSN 2229-5518
for 15 min at 3000rpm. After centrifugation, both phases become transparent with a clear phase boundary. The phenol concentration in the dilute phase was measured using UV-visible spectrophotometer wavelength at 530 nm.
The cloud point of aqueous surfactant solution was determined by heating 10 ml of such micellar solution in
graduated glass tubes. The rate of temperature increase in the water bath is set at 1ºC per min. The cloud point is determined by visual observation at the temperature at which the solution became obviously turbid. The measurement of cloud point temperature is reproducible within ± 0.2ºC. The same procedure is repeated for aqueous nonionic surfactant micellar solution with addition of phenol and electrolytes. When the solution is heated above the cloud point temperature, it will accelerate the phase separation. After centrifugation, the volumes of both phases have been noticed. The amount of phenol in the dilute phase can be determined by 4-aminoantipyrene methods using UV-visible spectrophotometer.
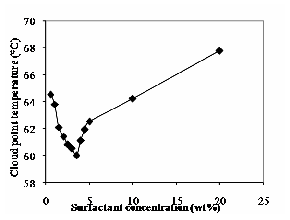
The variation of cloud point with the surfactant concentration is shown in Fig.1. The cloud point temperature of aqueous solutions of TX-100 decreases up to
3.5% (by wt) and then increases with increases in TX-100 concentration. The micelles concentration increases with increase in TX-100 concentration. Because of this, the cloud point of aqueous solutions of TX-100 decreases up to 3.5% (by wt). At higher surfactant concentration, the cloud point continues to increase due to the presence of structured water-surfactant system and the water molecules might act as buffers between micelles also observed the same trend [4].
Fig. 1 Effect of Triton-X 100 concentration on cloud Point
Fig. 2 shows the change in cloud point temperature for different concentration of Phenol. Phenol concentration varied from 0.1 to 0.5% (wt %). The cloud point temperature decreases with increase in phenol concentration. When phenol is added to the aqueous non- ionic surfactant solutions, the decrease in cloud point may be due to the decreased hydrophilic (water-liking) character of the surfactant micelle [5]. It may be also due to the decrease in hydrophilic nature of the nearest ethylene oxide units, which results in a loss of some hydration. Due to the loss of hydration, the ethylene oxide chain should be shorter observed the similar results [6].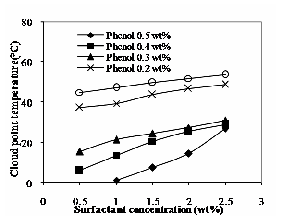
Fig. 2 Effect of phenol on cloud point of TX-100
In order to study the effect of electrolytes on cloud point, four different salts were used for the present study to consider both salting-in and salt out effect. When small amount of salt is added to nonionic surfactant solutions, the cloud point remains constant. Salting in effect salts
IJSER © 2014 http://www.ijser.org
International Journal of Scientific & Engineering Research, Volume 5, Issue 1 2, December-2014 20
ISSN 2229-5518
(NH4SCN, NaI) increase the critical micelle concentration and raise the cloud point. In contrast, salting out salts (NaCl, Na2SO4) can decrease the cloud point. The cloud point changes of the aqueous TX-100 solution in presence of electrolytes are shown in Fig. 3. The cloud point changes of the aqueous TX-100 solution in presence of solute and electrolytes are shown in Fig. 4. In the following sections, the salting in and salting out effects is explained.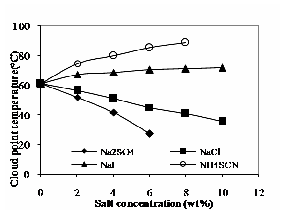
Fig. 3 Effect of electrolytes on cloud point of TX-100
The addition of most neutral electrolytes such as chlorides sulfates and carbonates typically depress the cloud point due to their salting-out effect in proportion to their concentration. In Fig. 3, it is shown that the cloud point decreases with increase in NaCl and Na2SO4 concentration for Triton X-100. In Fig. 4, it is shown that the cloud point decreases with increase in NaCl and Na2SO4 concentration and it decreases further with concentration of solute for Triton X-100. The addition of salts such as Cl-, SO42- to the non-ionic surfactant solution can depress the cloud point temperature by decreasing the availability of non associated water molecules to hydrate the ether oxygen’s of the poly (ethylene) chains [7]. It is also observed that the depression of cloud point is more for Na2SO4 than NaCl [7], [8].
Salting-in effect salts such as iodides, thiocyanates and nitrates typically increase the cloud point. Fig. 3 shows the cloud point of aqueous TX-100 solution increases with increase in NH4SCN and NaI concentration. Fig. 4 shows the cloud point of aqueous TX-100 solution decreases linearly because of the solute present in the solution as compared to Fig. 3. The increase in cloud point is more for NH4SCN compared to NaI. The positive charge of NH4SCN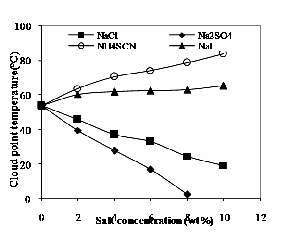
and NaI increases the cloud point since it breaks the water structure. When NH4SCN and NaI are added to the aqueous non-ionic surfactant solution, the mixed micelles have been formed. If the concentration of NH4SCN and NaI increases, then mixed micellar charge density also increases due to increase in micellar size. The charge density depends on the micellar size and it does not depend on the concentration of salts [4].
Fig. 4 Effect of phenol and electrolytes on cloud point of
TX-100
The effects of surfactant concentration, solute concentration and operating temperature on CPE are discussed. The concentration of surfactant is varied from 0.5 to 2.5% (by wt) and solute concentration is varied from 0.1 to 0.5% (by wt). All the experiments have been conducted at three different temperatures such as 50, 60 & 70ºC. These operating temperatures have been selected based on the Cloud point temperatures.
The phase volume ratio, RV, is defined as the ratio of the volume of the surfactant-rich phase to that of the volume of the aqueous phase. The volumes of the two phases are measured using graduated centrifuged tubes
RV = VS / VW (1)
Where VS and VW are the volumes of the surfactant-rich phase and the aqueous phase respectively.
IJSER © 2014 http://www.ijser.org
International Journal of Scientific & Engineering Research, Volume 5, Issue 1 2, December-2014 21
ISSN 2229-5518
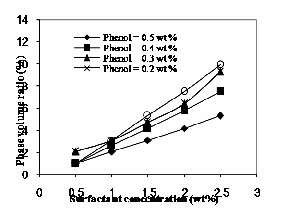
Fig. 5 Effect of solute and surfactant in phase volume ratio
Fig.5 shows the effect of surfactant and solute concentration in phase volume ratio. From the figure it is observed that the phase volume ratio increases with increase in surfactant concentration and it decreases with increase in solute concentration. The phase volume ratio increases because of increasing volume of surfactant-rich phase. It is due to the distribution of surfactant increases in the surfactant rich phase. The low phase volume ratio for higher concentration of solute shows that the amount of phenol in surfactant-rich phase would be high [9].
The pre concentration factor fC is defined as the ratio of the volume of bulk solution before phase separation to that of the surfactant-rich phase after phase separation.
Fig. 6 shows the effect of surfactant and solute concentration on pre-concentration factor. It is observed that the pre-concentration factor decreases with increase in surfactant concentration and decreases with solute concentration. The high solubility of solute in the surfactant micelles and the solute concentration in the surfactant-rich phase was very high. Because of high solubility of solute shows the decreasing pre-concentration factor due to increase in surfactant concentration and decrease in solute concentration also observed the similar result [9], [10].
The distribution coefficient or equilibrium partition coefficient Kd or Kp is defined as the ratio of the concentration of solute in surfactant-rich phase to that of the concentration of solute in dilute phase.
Kd = CS / CW (3)
Where CS and CW are the concentration of solute in the surfactant-rich phase and the dilute phase respectively.
fC = Vt / VS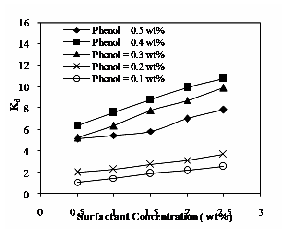
(2)
Where Vt and VS are the volumes of the bulk solution before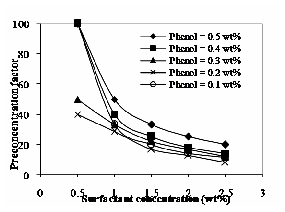
phase separation and the surfactant-rich phase respectively.
Fig. 6 Effect of solute and surfactant in pre-concentration factor
Fig. 7 Effect of operating temperature at 60ºC on distribution coefficient
Fig.7 shows the effect of operating temperature at 60ºC on distribution coefficient. The same pattern is observed for
50ºC & 70ºC. It increases with increase in both surfactant and solute concentration. The distribution of solute depends on the specific solute-water interaction. If the interaction is more, then distribution coefficient will be high. The distribution coefficient increases with increase in operating temperature is shown in Fig. 8 for the phenol concentration of 0.4% (by wt) and three different temperatures. The observations made by are similar to the present experimental observation [10], [11].
IJSER © 2014 http://www.ijser.org
International Journal of Scientific & Engineering Research, Volume 5, Issue 1 2, December-2014 22
ISSN 2229-5518
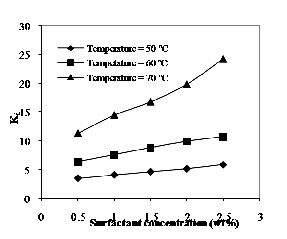
Fig. 8 Effect of operating temperature at phenol concentration of 0.4% (by wt) on distribution coefficient
The recovery efficiency of solute, η, can be characterized as the percentage of solute extracted from the bulk solution into the surfactant-rich phase.
CoVt Cw(Vt Vs)
hydrophilic (Phenol has a short hydrophobic portion (benzene ring) and a highly polar hydroxyl group) and then the extraction efficiency is low at 50ºC. The extraction efficiency is high, when the system is at higher operating temperature. The increase in recovery at elevated temperatures may be due to an increase in solubility of the solutes in the micellar phase [11].
The following section deals on the effect of electrolytes concentration and operating temperatures on phase volume ratio, pre-concentration factor, distribution coefficient and the extraction efficiency. Both salting-in and salting-out effects are studied with three different operating temperatures which is selected based on their cloud point. NaCl and Na2SO4 are used as salting-out effect salts and all the experiments have been conducted at three different temperatures. For NaCl, the experiments are conducted at
50, 60 & 70ºC. For Na2SO4, the experiments are conducted at
50, 55 & 60ºC. NaI and NH4SCN is used to study the salting-in effect and all the experiments have been conducted at three different temperatures i.e. 80, 82.5 &
85C. All the experiments are conducted for the surfactant
η % =![]()
CoVt
*100 (4)
concentration and solute concentration 2.5% (by wt) and
0.1% (by wt) respectively. The salt concentration is varied
Where C0 is the initial concentration of solute in the micellar solution and CW is the concentration of solute in dilute phase.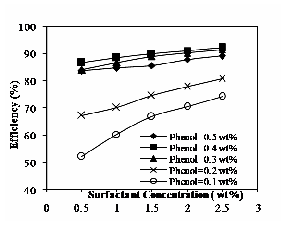
Fig. 9 Effect of operating temperature at 60ºC on efficiency
(%)
Fig. 9 shows the effect of temperature at 60ºC on the extraction efficiency. For temperature 50 and 70oC, the observed trend is similar to 60oC. It increases with increase in surfactant concentration and also increases with increase in operating temperatures. The nature of solute is more
from 0 to 10% (by wt).
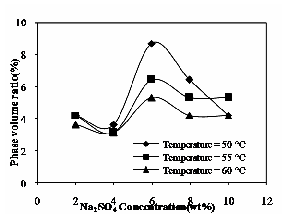
The effect of Na2SO4 concentration and operating temperature on the phase volume ratio is shown in Fig. 10. The phase volume ratio increases with increase in Na2SO4 concentration and it decreases with increase in operating temperature. The addition of electrolyte would compress the volume of surfactant-rich phase from 0.9 ml to 0.25 ml because of the dehydration process.
IJSER © 2014 http://www.ijser.org
International Journal of Scientific & Engineering Research, Volume 5, Issue 1 2, December-2014 23
ISSN 2229-5518
Fig.10 Effect of Na2SO4 and operating temperature on phase
volume ratio
The effect of Na2SO4 concentration and operating temperature on the pre-concentration factor is shown in Fig.11. The pre-concentration factor was obtained in the CPE process for 0.1% (by wt) of phenol and 2.5% (by wt) of TX-100 without any electrolyte is 11. The addition of electrolyte may compress the surfactant-rich phase volume and the pre-concentration factor for the same concentration of solute and surfactant in presence of salt fall down from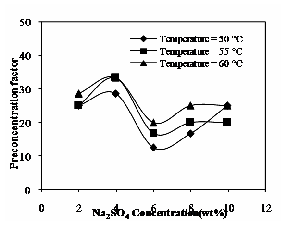
40 to 10 at three different operating temperatures [12].
Fig. 11 Effect of Na2SO4 and operating temperature on pre- concentration factor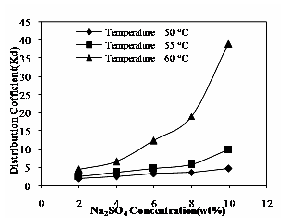
The effect of Na2SO4 concentration and operating temperature on distribution coefficient is shown in Fig.12. The distribution coefficient increases with increase in Na2SO4 concentration and also it increases with increase in operating temperatures. The addition of electrolyte would compress the volume of surfactant-rich phase (VS); due to low VS, the amount of solute in surfactant-rich phase is very high. Because of high CS, distribution coefficient also found as high value [12].
Fig. 12 Effect of Na2SO4 and operating temperature on distribution coefficient
Fig.13 illustrates the effect of Na2SO4 concentration and operating temperature on the recovery of phenol. The efficiency increases with increase in concentration of Na2SO4 and operating temperature. An efficient change in the recovery is observed at the different salt concentrations. Recovery of phenol depends on the micellar concentration. Increasing salt concentration could lead to greater recovery efficiency. For example, the recovery of phenol for sodium sulfate increases up to 98% at the operating temperature of
60°C. At the higher operating temperature, the recovery of
phenol increases due to an increase in solubility of the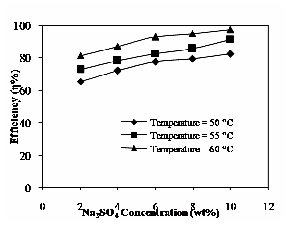
analyses in the micellar phase [13]. The above said parameters are studied for NaCl at the three different temperatures such as 50, 60 & 70ºC and the similar trend is observed.
Fig. 13 Effect of Na2SO4 and operating temperature on extraction efficiency
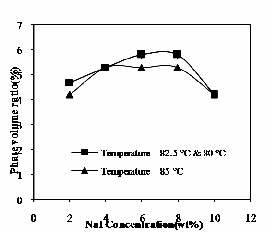
The following figures illustrate the results obtained for the effect of NaI concentration and operating temperature on above mentioned parameters. The influence of NaI concentration and operating temperature on phase volume ratio is shown in Fig.14. In this case the phase volume ratio attained high value such as salting-out at 6% (by wt) of electrolyte concentration and then decreases with increase in electrolyte concentration. The pre-concentration factor is obtained as high as 67, because of added electrolytes would compress the VS. This result has shown in Fig. 15. Distribution coefficient decreases with increase in concentration of NaI and at operating temperatures it increases.
IJSER © 2014 http://www.ijser.org
International Journal of Scientific & Engineering Research, Volume 5, Issue 1 2, December-2014 24
ISSN 2229-5518
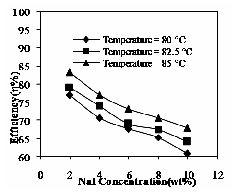
Fig. 14 Effect of NaI and operating temperature on phase volume ratio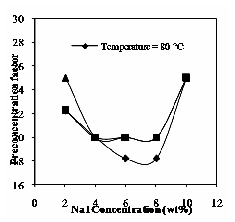
Fig. 15 Effect of NaI and operating temperature on pre- concentration factor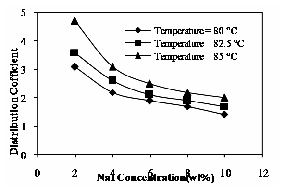
The distribution coefficient decreases with increase in solute hydrophobicity (the hydrophobicity of phenol increases with increase in phenol concentration).It is probably due to the increase in the water solubility of the hydrocarbon compounds. It is shown in Fig. 16.
Fig. 16 Effect of NaI and operating temperature on distribution coefficient
Fig. 17 Effect of NaI and Operating temperature on extraction efficiency
The recovery of phenol decreases with increase in concentration of NaI and it increases with operating temperatures. The recovery of solute decreases, because of solute hydrophobicity. The result is shown in Fig. 17. The above said parameters are studied for NH4SCN at the same set of temperature conditions.
CPE using Triton X-100 as non-ionic surfactant can extract phenol without using organic solvents. The effect of nonionic surfactant concentration (TX-100) on cloud point was studied. The cloud point temperature decreases up to
3.5% (by wt) with the increase in Triton X-100 concentration
and then it increases with increase in concentration. The cloud point temperature decreases with increase in phenol concentration, NaCl and Na2SO4 concentration (salting out effect). The cloud point temperature increases for NH4SCN and NaI due to its salting-in effect.
The design parameters such as phase volume ratio, pre-concentration factor, and distribution coefficient and extraction efficiency are studied with respect to the effect of surfactant, solute and electrolyte concentration and for different set of operating temperatures. The distribution coefficient and extraction efficiency are increases with increase in surfactant and solute concentration for without electrolytes. For added electrolytes, Phase volume ratio decreases with increasing operating temperature. Pre- concentration factor varies between 10 and 67. The Distribution coefficient and extraction efficiency increases with increasing in operating temperature and NaCl and Na2SO4 concentration for salting-out effect. The Distribution coefficient and extraction efficiency decreases with increasing in NH4SCN and NaI concentration.
IJSER © 2014 http://www.ijser.org
International Journal of Scientific & Engineering Research, Volume 5, Issue 1 2, December-2014 25
ISSN 2229-5518
[1] www.osha.gov, “Occupational safety and Health Guideline for phenol”. OSHA, Washington, DC, U.S. Department of labour.
[2] Pollution Control Department, Ministry of Natural Resources and Environment, Thailand.
[3] L. Willie and P. Edmondo, “A Critical Review of Surfactant- Mediated Phase Separations (Cloud-Point Extractions): Theory and Applications”. Critical reviews in analytical chemistry, Vol. 24, pp. 133-177 (1993) .
[4] L. Koshy, A. H. Saiyad and A. K. Rakshit, “The effects of
various foreign substances on the cloud point of Triton X
100 and Triton X 114”. J. Colloid Polym Sci., Vol. 274, pp. 582-
587 (1996).
[5] H. Saito and K. Shinoda, “The solubilization of hydrocarbons in aqueous solutions of nonionic surfactants”. J. Colloid Sci. Vol. 24, pp. 10-15 (1967).
[6] N. M. William “Factors affecting the solubility of nonionic emulsifiers”. J. Colloid Sci. Vol. 11, pp. 272-285 (1956).
[7] D. Bai, J. Li, S. B. Chen, and B.H. Chen, “A Novel Cloud- Point Extraction Process for Preconcentrating Selected Polycyclic Aromatic Hydrocarbons in Aqueous Solution”. Environ. Sci. Technol. Vol. 35, pp. 3936-3940 (2001).
[8] B. Haddou, J.P. Canselier and C. Gourdon, “Cloud point extraction of phenol and benzyl alcohol from aqueous stream”. Sep. Purif. Tech. Vol. 50, pp. 114-121 (2006).
[9] Y. Bingjia, Y. Li, H. Qiong and S. Akita, “Cloud Point Extraction of Polycyclic Aromatic Hydrocarbons in Aqueous Solution with Silicone Surfactants”. Chin. J. Chem. Eng. Vol. 15 (4), pp. 468-473 (2007).
[10] D. Sicilia, S. Rubio and D. Pérez-Bendito, “Evaluation of
the factors affecting extraction of organic compounds based on the acid-induced phase cloud point approach”. Analytica Chimica Acta. Vol. 460, pp. 13-22 (2002).
[11] Q. Fang, H. W. Yeung, H. W. Leung and C. W. Huie, “Micelle-mediated extraction and preconcentration of ginsenosides from Chinese herbal medicine”. J. Chromatography A. Vol. 904, pp. 47-55 (2000).
[12] L. Jing-Liang and C. Bing-Hung, “Equilibrium partition of polycyclic aromatic hydrocarbons in a cloud-point extraction process”. J. Colloid Sci. Vol. 263, pp. 625-632 (2003).
[13] S. R. Sarath, B. R. John and P. G. Donald, “Quantification
of Polycyclic Aromatic Hydrocarbons and Polychlorinated Dibenzo- p -dioxins in Human Serum by Combined Micelle-Mediated Extraction (Cloud-Point Extraction) and HPLC”. Anal. Chem. Vo. 68, pp. 1556-1560 (1996).
IJSER © 2014 http://www.ijser.org