International Journal of Scientific & Engineering Research, Volume 4, Issue 9, September-2013 937
ISSN 2229-5518
Chromosome Segmentation Using K-Means
Clustering
Soumya.D.S1,Arya.V 2
Department of Electronics and Communication Engineering,Younus college of Engineering and Technology
Kollam - 691 005, Kerala, India.
aryacek@gmail.com
Abstract-Multiplex or multicolor fluorescence in situ hybridization (M-FISH) is a recently developed cytogenetic labeling technique which can be used to find out the chromosomal abnormalities for cancer and genetic disorders. To detect the chromosomal abnormalities, an improved adaptive fuzzy c means clustering algorithm (IAFCM) was developed and applied to the segmentation and classification of M-Fish images. IAFCM method gives considerable classification accuracy among the existing methods such as FCM and AFCM. In this paper another algorithm k- means clustering is introduced, which runs faster than the IAFCM algorithm. Also a filter can be incorporated with this k- means clustering for denoising. Fuzzy C-Means Clustering is a soft version of K-means, where each data point has a fuzzy degree of belonging to each cluster.
Index terms – M-FISH images,Improved adaptive fuzzy c means clustering algorithm(IAFCM),k means clustering.
I. INTRODUCTION
Chromosomes are microscopic structures in cells that contain genetic information. Most individuals have 23 pairs of chromosomes; one of each pair coming from the mother and the other from the father.The non-sex chromosome pairs are numbered 1 through 22, and there are two sex chromosomes, designated X and Y. Individuals with two X chromosomes are female, and individuals with an X and a Y chromosome are male. Recently a 5-fluorophore combinatorial labeling technique (M-FISH) was developed ,in which each class of chromosomes binds with a different combination of fluorophores ,which is used for the analysis of human chromosomes[1] [4]. The technique has been used for the characterization of chromosomal translocations, to search for cryptic rearrangements, and to study mutagenesis, tumors, and radiobiology[9].In this technology the chromosomes are labeled with five flurophores and a DNA stain known as DAPI (4’-6-diamidino-2-phenylindole) is attached to DNA to label the chromosomes. DAPI is typically used to generate a traditional grayscale image of the chromosomes. Using these labeling techniques, it is possible to create a combination of fluorophores such that each class of chromosomes absorbs a different combination of these fluorophores . Since each fluorophore has a different emission spectrum, each chromosome class appears as a different color that is visually distinguishable from all other classes. Each dye is visible in a
particular wavelength and M-FISH signals can be obtained as multispectral or multichannel images, in which a chromosome was stained to be visible (signed as “1”) or not visible (signed as “0”).The chromosomal image of each fluorophore can be obtained by employing appropriate optical filters equipped with fluorescent microscope. Several sets of fluorophores are commonly used for M-FISH imaging. For a number n, the number of Boolean combination is 2n . Hence, five spectra are sufficient to distinguish the 23 pair of chromosomes in human genome. This pixel-wise classification technique is called color karyotyping[6],[8].
For a normal cell, each chromosome should be painted with the same color. Otherwise, it indicates that there may be some chromosomal abnormalities, which are associated with certain genetic disorders and cancers. Due to a number of factors that affects chromosomes which includes nonhomogeneity of staining, variations of intensity levels within and between image sets, and emission spectral overlaps between fluorophores, the reliability of the diagnosis technique has not reached the level for clinical use[3]- [5],[10]-[12]. To improve the detection of chromosomal abnormalities for clinical diagnosis, accurate segmentation and classification algorithms have to be developed. An improved adaptive fuzzy c-means clustering algorithm was developed and applied to the segmentation and classification of multicolor fluorescence in situ hybridization (M-FISH) images, which gives the lowest segmentation and classification error, which will contribute to improved diagnosis of genetic diseases and cancers[1].Our method introduces k means clustering which is faster than the existing fuzzy methods.
II. RELATED WORK
A. Chromosomes
Chromosomes in humans can be divided into two types: autosomes and sex chromosomes. Chromosomes are the body’s information carriers and that contain genes, which store in strings of DNA all of the data necessary for an organism’s development and maintenance.By examining images sets of chromosomes in a person, one can collect information about the genetic health of that individual to diagnose certain diseases in that individual. Under normal
IJSER © 2013 http://www.ijser.org
International Journal of Scientific & Engineering Research, Volume 4, Issue 9, September-2013 938
ISSN 2229-5518
circumstances, chromosomes are extremely long and thin and are essentially invisible,therefore at this stage, they can be stained to become visible and can be imaged by a microscope.
One of the most common chromosome abnormalities is Down syndrome, which is normally caused by an extra chromosome 21.Other serious chromosome abnormalities related to maternal age are trisomy 18 and trisomy 13, which are due to an extra chromosome 18 and an extra chromosome
13, respectively. Features of all three of these chromosome abnormalities, like most chromosome abnormalities involving extra chromosome material, include birth defects, growth problems, mental retardation, or a combination of these. The presence of an extra X or Y chromosome tends to be more subtle.The most common chromosome abnormalities found in early miscarriages include an extra chromosome 16 or other large chromosome, a missing X chromosome, or three sets of chromosomes (triploidy) instead of the normal pair.Deletions or duplications of part of a chromosome, rather than the entire chromosome is another type of chromosome abnormality.
B. Karyotyping
Karyotyping is the process of classifying each chromosome in a cell according to a standard nomenclature[2]. By convention, the 22 pairs, the X chromosome, and Y chromosome are assigned to 24 distinct classes, where the first
22 classes are numbered in order of decreasing length (that is, class number one is the longest homologous pair of chromosomes), and the last two classes are for the X and Y chromosomes.Segmentation is the process of dividing the image into segments, each of which has some meaning to a human observer. In chromosome analysis, it is desired to segment the image into background and chromosome pixels, and to divide further the chromosome pixels into individual chromosome type pixels. Classification usually follows segmentation in chromosome image analysis. Once segmented and classified, it is simple to arrange the chromosomes into a karyotype for examination. Several sets of fluorophores are commonly used for M-FISH imaging.
C. M-FISH Images
Using the new combinatorial labeling techniques, it is possible to create a combination of fluorophores such that each class of chromosomes absorbs a different combination of these fluorophores[2],[8].Since each fluorophore has a different emission spectrum, each chromosome class appears as a different color visually distinguishable from all other classes[13].The central idea in M-FISH is that each chromosome is labelled by a unique combination of the five fluors. Several such sets of fluors have been developed for M- FISH imaging. DAPI attaches to DNA and thus labels all chromosomes. Five distinguishable fluors are needed for combinatorial labelling to uniquely identify all 24 chromosome types.
An improved AFCM classification method (IAFCM) with a new objective function was developed and applied o the
classification of M-FISH images , which yields better background compensation and results in improved chromosome segmentation and classification.In our proposed method we are using a novel k means clustering algorithm which runs faster than the IAFCM algorithm. Also a filter can be incorporated with this k- means clustering for denoising. Among many factors that cause uneven distributed intensities in M-FISH images, there are three important ones [1],[3].They are
1) System error caused by the microscopic system
2) The flair effects of chromosomes
3) The uneven hybridization within a chromosome
Pham and Prince proposed an AFCM method that used a gain field to modify the centers of each cluster and to compensate the slowly changing inhomogeneities effects. In their method, they employed the energy of the first and second derivatives of the gain field to control the smoothness of the gain field[1]. The work has shown that AFCM segmentation yields lower error rates than that of the classical FCM algorithm when segmenting MR brain images with intensity inhomogeneities. In addition, the method that they proposed takes very long computational time.In IAFCM (Improved Adaptive Fuzzy C- Mean) algorithm that is also proposed by Pham and Prince, the regularization term uses the approximation of the first- order derivative with a filter, which can preserve the shape of the gain filed[5],[6],[7].
There are many clustering techniques and algorithms in use. K-means is the most common and often used algorithm. K- means algorithm takes an input parameter k, and partitions a set of n objects into k clusters according to a similarity measure of the objects in the dataset. The clusters have a high intra-cluster and a low inter-cluster similarity. As the number of objects in the cluster varies, the centre of gravity of the cluster shifts. The mean values, or centroids, are a summary measure of the similarity of data objects within the same cluster. First, the algorithm randomly chooses k initial centroids and then iterates over the dataset. In each iteration k- means uses the similarity metric to associate each data object with its nearest centroid. Then, the algorithm computes a set of new centroids by taking the mean of all the data objects in each cluster respectively. The final step is to calculate the change in the centroid positions between the latest iteration and the previous one. The iteration terminates when the change in the centroid position is less than some pre-defined threshold.
The median filtering, which effectively removes the shot noise and reduces the additive Gaussian noise, has to be applied on the images for denoising [4]. Depending on the integration time of image acquisition and the intensity of fluorophores the chromosome brightness can be different among channels or spreads. This can lead to the misclassification of a whole chromosome to another chromosome. Thus the image intensity has to normalized from
0 to 1 so that all the images display approximately the same intensity. The use of K-Means clustering method is fairly
IJSER © 2013 http://www.ijser.org
International Journal of Scientific & Engineering Research, Volume 4, Issue 9, September-2013 939
ISSN 2229-5518
simple when compared with frequently used fuzzy clustering methods. Efficiency and providing simple output are fundamental features of K-Means clustering method.
III. K-MEANS CLUSTERING ALGORITHM
Many approaches to image segmentation have been proposed over the years . Of these various methods, clustering is one of the simplest, and has been widely used in segmentation of grey level images. Cluster is a group of objects that are similar amongst themselves but dissimilar to the objects in other clusters. Identifying meaningful clusters and thereby a structure in a large unlabelled dataset is an important unsupervised data mining task. Among clustering formulations that are based on minimizing a formal objective function, perhaps the most widely used and studied is k-means clustering ,which is an algorithm to classify or to group objects based on attributes/features into K number of group. K is positive integer number[14],[15].
The grouping is done by minimizing the sum of squares of distances between data and the corresponding cluster centroid. Thus, the purpose of K-mean clustering is to classify the data. In the beginning, determine number of cluster K and assume the centroid or center of these clusters.Any random objects can be taken as the initial centroids or the first K objects can also serve as the initial centroids. Then the K means algorithm will do the three steps below until convergence .Iterate until stable (= no object move group):
1. Determine the centroid coordinate
2. Determine the distance of each object to the centroids
3. Group the object based on minimum distance (find the closest centroid).
The objective function of k-means clustering algorithm is given by

2 ....... (3.1)
Where  2 is the distance metric from any point
  to the group centroid
  .Thus, the J (objective function) represents the similarity measure of the n objects contained in their respective groups.
The flow chart for k-means clustering algorithm is as shown in figure 1.This algorithm, starts with the selection of the k initial random cluster centres from the n objects. Each remaining object is assigned to one of the initial chosen centres based on similarity measure. When all the n objects are assigned, the new mean is calculated for each cluster. These two steps of assigning objects and calculating new cluster centres are repeated iteratively until the convergence criterion is met. Comparing the similarity measure is the most intensive calculation in k-means clustering. For n objects to be assigned into k clusters, the algorithm will have to perform a
total of nk distance computations. While the distance calculation between any object and a cluster centre can be performed in parallel, each iteration will have to be performed serially as the centre changes will have to be computed each time.

Fig 1. Flow chart for k-means clustering algorithm
The main steps are
1) Initial value of centroids: Let (c1 , c2 ….) denote the coordinate of the centroids
2) Objects-Centroids distance: Calculate the distance between cluster centroid to each object. Use euclidean distance and then calculate distance matrix at iteration 0 . Each column in the distance matrix symbolizes the object. The first row of the distance matrix corresponds to the distance of each object to
the first centroid and the second row is the distance
of each object to the second centroid.
3) Objects clustering: Assign each object based on the minimum distance.
4) Iteration-1, determine centroids: Knowing the members of each group, compute the new centroid of each group based on these new memberships.
5) Repeat from step 2.
6) Comparing the grouping of last iteration and this iteration reveals that the objects does not move group anymore. Thus, the computation of the k-mean clustering has reached its stability and no more iteration is needed.
If the number of data is less than the number of cluster then we assign each data as the centroid of the cluster. Each centroid will have a cluster number. If the number of data is bigger than the number of cluster, for each data, we calculate the distance to all centroid and get the minimum distance. This data is said belong to the cluster that has minimum distance from this data. Since we are not sure about the
IJSER © 2013 http://www.ijser.org
International Journal of Scientific & Engineering Research, Volume 4, Issue 9, September-2013 940
ISSN 2229-5518
location of the centroid, we need to adjust the centroid location based on the current updated data. Then we assign all the data to this new centroid. This process is repeated until no data is moving to another cluster anymore. Mathematically this loop can be proved convergent[15].
There are a lot of applications of the K-mean clustering, range from unsupervised learning of neural network,Pattern recognitions, Classification analysis, Artificial intelligent, image processing, machine vision, etc. In principle, if there is several objects and each object have several attributes, and then this algorithm can be applied to classify the objects based on the attributes.
IV. RESULTS
The M-fish image segmentation using k-means clustering algorithm gives better segmentation results than other fuzzy based methods. The segmentation output using k-means clustering algorithm is shown in fig 2.Median filter can be incorporated with k-means clustering algorithm to get an accurate segmentation result while suppressing noise.k-means clustering segmentation is not oversegmented.It gives better accuracy and considerable processing speed compared with the existing methods.
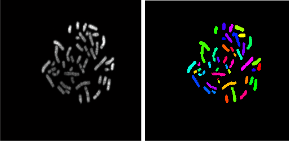
a) Input image b) k-means clustering
Fig 2) segmentation result using k-means clustering
V. CONCLUSION
In IAFCM (Improved Adaptive Fuzzy C-Mean) algorithm that is proposed by Pham and Prince, the regularization term uses the approximation of the first-order derivative with a filter, which can preserve the shape of the gain filed. Clustering algorithms can be applied to solve the segmentation problem.In this paper k-means clustering algorithm is used for segmentation which is faster than existing methods and denoising can be performed with a median filter. The use of K-Means clustering method is fairly simple when compared with frequently used fuzzy clustering methods. Efficiency and providing simple output are fundamental features of K-Means clustering method. It often is used as a preprocessing step for other algorithms, for example to find a starting configuration.
ACKNOWLEDGMENT
The authors would like to thank the management, and faculty member of Department of Electronics and Communication Engineering,Younus College of Engineering and Technology, Kollam for many insightful discussions and the facilities extended for completing the task.
REFERENCES
[1] Hongbao Cao, Hong-Wen Deng, and Yu-Ping Wang, “Segmentation of M-FISH Images for ImprovedClassification of Chromosomes With an Adaptive Fuzzy C-means Clustering Algorithm,” IEEE Transactions On Fuzzy Systems, Vol. 20, 2012
[2] E. Schrock, S. du Manoir, T. Veldman, B. Schoell, J. Wienberg, M. A.
Ferguson-Smith, Y. Ning, D. H. Ledbetter, I. Bar-Am, D. Soenksen, Y. Garini, and T. Ried, “Multicolor spectral karyotyping of human chromosomes,” Science, vol. 273, pp. 494–497, 1996.
[3] H. Choi, K. R. Castleman, and A. C. Bovik, “Joint segmentation and classification of M-FISH chromosome images,” in Proc. 26th Annu. Int.Conf. IEEE Eng. Med Biol. Soc., San Francisco, CA, Sep. 2004, pp.
1636– 1639.
[4] Y.Wang and K. R. Castleman, “Normalization of multicolor fluorescence in situ hybridization (M-FISH) images for improving
color karyotyping,” Cytometry, vol. 64, pp. 101–109, Apr. 2005.
[5] P. S. Karvelis, A. T. Tzallas, D. I. Fotiadis, and I. Georgiou, “A
multichannel watershed-based segmentation method for multispectral
chromosome classification,” IEEE Trans.Med. Imag., vol. 27, no. 5, pp.
697–708, May 2008.
[6] D. L. Pham and J. L. Prince, “An adaptive fuzzy c-means algorithm
for image segmentation in the presence of intensity inhomogeneities,”
Pattern Recog. Lett., vol. 20, pp. 57–68, 1998.
[7] D. L. Pham and J. L. Prince, “Adaptive fuzzy segmentation of
magnetic resonance images,” IEEE Trans.Med. Imag., vol. 18, no. 9, pp. 737–752, Sep. 1999.
[8] M. R. Speicher, S. G. Ballard, D. C. Ward, and Karyotyping, “Human
chromosomes by combinatorial multi-fluor FISH,” Nat. Genet., vol.
12,pp. 368–375, 1996.
[9] T. Liehr and U. Claussen, “Multicolor-fish approaches for the characterization of human chromosomes in clinical genetics and tumor
cytogenetics,” Curr. Genom., vol. 3, pp. 213–235, 2002.
[10] M. P. Sampat, A. C. Bovik, J. K. Aggarwal, and K. R. Castleman, “Supervised parametric and non-parametric classification of
chromosome images,” Pattern Recog., vol. 38, pp. 1209–1223, Aug.
2005.
[11] W. C. Schwartzkopf, A. C. Bovik, and B. L. Evans, “Maximum-
likelihood techniques for joint segmentation-classification of multispectral chromosome images,” IEEE Trans. Med. Imag., vol. 24, no. 12, pp. 1593–1610,Dec. 2005.
[12] H. Choi, K. R. Castleman, and A. C. Bovik, “Color compensation of multicolor FISH images,” IEEE Trans.Med. Imag., vol. 28, no. 1, pp.
129–135, Jan. 2009.
[13] Thomas Ried, Evelin Schröck, Yi Ning and Johannes Wienberg, “Chromosome painting: a useful art,” Human Molecular Genetics,
1998, Vol. 7, No. 10 Review 1619–1626.
[14] Amanpreet Kaur Bhogal,Neeru Singla,Maninder Kaur “,Comparison of Algorithms for Segmentation of Complex Scene Images,” International Journal Of Advanced Engineering Sciences And Technologies ,Vol No. 8, Issue No. 2, 306 – 310.
[15] Chris Ding , Xiaofeng He ,“ K-means Clustering via Principal Component Analysis”, Proceedings of the 21st International Confer- ence on Machine Learning, Banff, Canada, 2004.
IJSER © 2013 http://www.ijser.org