et al. [5] have investigated the influence of 25 vol.%, 0.28μm Al2 O3 particles dispersed in Al. The 0.2% proof stress and ultimate tensile strength are about 200 MPa and 330 MPa
International Journal of Scientific & Engineering Research, Volume 6, Issue 3, March-2015 75
ISSN 2229-5518
Cause and Catastrophe of Strengthening
Mechanisms in 6063/Al2O3 Composites Prepared by Stir Casting Process: Validation through FEA
A. Chennakesava Reddy
Abstract— The present research has been focused to study causes and misfortunes of strengthening mechanisms in 6063/Al2O3 metal matrix composites. It was found that the tensile strength and stiffness increase with increasing volume fraction of Al2O3 particulates. The tensile strength and stiffness were decreased with increased size of particulates. After heat treatment, most of the coarse intermetallic phases are dissolved to form stable Mg2Si, Al3Fe, AlFeSi and AlFeMnSi compounds. A clustering of particulates was observed in the composites having very small particles. The wettability and uniform distribution of particles have improved the strengthening mechanism. The proposed formulae by the author for the tensile strength and elastic modulus could predict them very close to the experimental values of 6063/Al2O3 composites. The FEA results validate the occurrence of particle debonding, porosity, and clustering in the composites.
Index Terms— 6063, alumina, metal matrix composites, strength, analytical modeling, mechanical testing.
—————————— ——————————
HE 6063 is an aluminum alloy consisting of magnesium and silicon as alloying elements. The 6063 is employed for window frames, door frames, roofs, and sign frames. In spite of their exceptional mechanical properties, Al-Al2 O3 composites fabricated through casting route, suffer disadvantageous effects such as sedimentation of particulates, higher porosity level, poor wettability, clustering and cracking of particulates and interfacial reactions [1], [2], [3], [4]. Redsten
particle / matrix interface, cracking of particles, and voids/porosity on the elastic modulus and tensile strengths of
6063/Al2 O3 metal matrix composites.
For a tensile testing of a rectangular cross-section, the tensile strength is given by:
et al. [5] have investigated the influence of 25 vol.%, 0.28μm Al2 O3 particles dispersed in Al. The 0.2% proof stress and ultimate tensile strength are about 200 MPa and 330 MPa![]()
σ t = t
At
(1)
respectively. Srivatsan [6] has studied the fracture behavior of
The engineering strain is given by:
2011 Al alloy reinforced with two different volume fractions of
10 and 15% Al2 O3 . The tensile strength in the 15 vol. %
composite is 2% more than that of the 10 vol. % composite.
ε = ∆Lt
to
= Lt − Lto
Lto
(2)
The tensile fracture surface shows microscopically local ductile and brittle fracture. Kamat et al. [7] have performed different tests on 2011-O and 2024-O Al alloy reinforced with Al2 O3 having 2 to 20 % volume fraction with different particle sizes. The yield strength is increased with decrease in spacing between particles. Pestes et al. [8] have studied the effect of particle size on the fracture toughness of Al/Al2 O3 composites. A swell in the inter-particle spacing increases the toughness either by decreasing the volume fraction of
where ΔLt is the change in gauge length, L0 is the initial gauge
length, and Lt is the final length, Ft is the tensile force and At is the nominal cross-section of the specimen.
The Weibull cumulative distribution can be transformed so that it appears in the familiar form of a straight line: Y = mx + b as follows:
x β
−
particulates or increasing size of the particles.
F (x) = 1 − e
α
(3)
.All these phenomena may influence the tensile strength
and stiffness of composite. With this principal background,
the motivation for this article was to study the influence of![]()
lnln( 1
) = β ln x − β lnα
(4)
volume fraction and particle size of Al2 O3 reinforcement, clustering of particles, the formation of precipitates at the
————————————————
• Professor, Department of Mechanical Engineering, JNTUH College of Engineering, Kukatpally, Hyderabad – 500 085, Telangana, India
acreddy@jntuh.ac.in, 09440568776
1 − F (x)
Comparing this equation with the simple equation for a line, we see that the left side of the equation corresponds to Y, lnx corresponds to X, β corresponds to m, and -βlnα corresponds to b. Thus, when we perform the linear regression, the estimate of the Weibull parameter (β) comes directly from the
IJSER © 2015 http://www.ijser.org
International Journal of Scientific & Engineering Research, Volume 6, Issue 3, March-2015 76
ISSN 2229-5518
slope of the line. The estimate of the parameter (α ) must be calculated as follows:
− b
![]()
The composites were prepared by the stir casting and low- pressure die casting process. The matrix alloy was 6063. The
α = e
β
(5)
reinforcement was Al2 O3 particulates. The volume fractions of
Al2 O3 reinforcement are 12%, 16%, and 20%. The particle sizes
According to the Weibull statistical-strength theory for brittle materials, the probability of survival, P at a maximum stress (σ) for uniaxial stress field in a homogeneous material governed by a volumetric flaw distribution is given by
of Al2 O3 reinforcement are 2µm, 5µm, and 10 µm.
The 6063 matrix alloy was melted in a resistance furnace. The
P(σ f ≥ σ ) = R(σ ) = e− B(σ )
(6)
crucibles were made of graphite. The melting losses of the
alloy constituents were taken into account while preparing the charge. The charge was fluxed with coverall to prevent
where σf is the value of maximum stress of failure, R is the
reliability, and β is the risk of rupture. A non-uniform stress
field (σ) can always be written in terms of the maximum stress
as follows:
dressing. The molten alloy was degasified by tetrachlorethane (in solid form). The crucible was taken away from the furnace and treated with sodium modifier. Then the liquid melt was allowed to cool down just below the liquidus temperature to
σ (x, y, z ) = σ 0 f (x, y, z )
(7)
get the melt semi solid state. At this stage, the preheated
For a two-parameter Weibull model, the risk of rupture is of the form
(5000C for 1 hour) reinforcement particles were added to the liquid melt. The molten alloy and reinforcement particles are
σ β
![]()
B(s) = A
σ
(σ 0 , β > 0)
(8)
thoroughly stirred manually for 15 minutes. After manual
steering, the semi-solid, liquid melt was reheated, to a full
0
β
liquid state in the resistance furnace followed by an automatic
mechanical stirring using a mixer to make the melt
where
A = [ f (x, y, z )] dv
v
(9)
homogenous for about 10 minutes at 200 rpm. The
and σ0 is the characteristic strength, and β is the shape factor that characterizes the flaw distribution in the material. Both of these parameters are considered to be material properties independent of size. Therefore, the risk to break will be a function of the stress distribution in the test specimen. Equation (8) can also be written as
temperature of melted metal was measured using a dip type
thermocouple. The preheated cast iron die was filled with
dross-removed melt by the compressed (3.0 bar) argon gas [2], [3], [4].
σ β
![]()
B(σ ) =
σ
(10)
Prior to the machining of composite samples, a solution treatment was applied at 6000C for 1 hour, followed by
A
− 1
quenching in cold water. The samples were then naturally
aged at room temperature for 100 hours.![]()
σ A = σ [A] β
(11)
And the reliability function, Eq. (11) can be written as a two- parameter Weibull distribution
β
σ
=
R(σ ) = e − A
(12)
The tensile tests of specimens containing different stress fields can be represented by a two-parameter Weibull distribution with the shape parameter and characteristic strength. The authors have proposed expression for the tensile strength considering the effects of reinforced particle size and voids/porosity. The expression of tensile strength is given below:
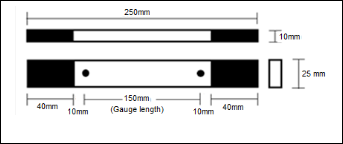
Fig. 1 Shape and dimensions of tensile specimen
The heat-treated samples were machined to get flat-
σ t = σ
o [Vm
+ V p
− Vv
]−1 / β
(σ 0
, β t
> 0)
(13)
rectangular specimens (figure 1) for the tensile tests. The
tensile specimens were placed in the grips of a Universal Test
where σ0 is the characteristic strength of tensile loading, β is the shape parameter which characterize the flaw distribution
in the tensile specimen, Vm, Vp , and Vv are respectively volume of the matrix, volume of the reinforced particles and volume of the voids/porosity in the tensile specimen.
Machine (UTM) at a specified grip separation and pulled until failure. The test speed was 2 mm/min (as for ASTM D3039). A strain gauge was used to determine elongation.
IJSER © 2015 http://www.ijser.org
International Journal of Scientific & Engineering Research, Volume 6, Issue 3, March-2015 77
ISSN 2229-5518
An image analyzer was used to study the distribution of the reinforcement particles within the 6063 aluminum alloy matrix. The polished specimens were ringed with distilled water, and etched with 0.5% HF solution for optical microscopic analysis. Fracture surfaces of the deformed/fractured test samples were analyzed with a scanning electron microscope (SEM) to define the macroscopic fracture mode and to establish the microscopic mechanisms governing fracture. Samples for SEM observation were obtained from the tested specimens by sectioning parallel to the fracture surface and the scanning was carried using S-
3000N Toshiba SEM.
Particle distribution, clustering and porosity in the composite were modeled using ANSYS software [9]. A test coupon of
0.03mm x 0.03mm composite was modeled to examine particle clustering, debonding. In addition, a porosity of 36µm was modeled in the test coupon of 0.1mm x 0.1mm. A triangle element of 6 degrees of freedom was used to mesh the Al2 O3 particle, precipitates and the matrix alloy. For load transfer from the matrix to the particle point-to-point coupling of zero length was used. The test coupon was tensile loaded.
Assuming that the metal matrix is linear leads to the following system of discrete equations: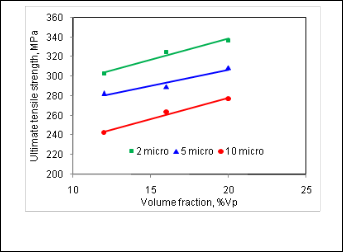
The modulus of elasticity is the stiffness of the composite. The tensile strength is the maximum stress that the material can sustain under a uniaxial loading. For metal matrix composites, the tensile strength depends on the scale of stress transfer from the matrix to the particulates.
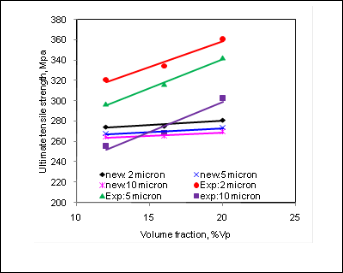
Fig. 2. Variation of the tensile strength with the volume fraction and particle size of Al2O3
𝑘00 ⋯ 𝑘06
𝑑2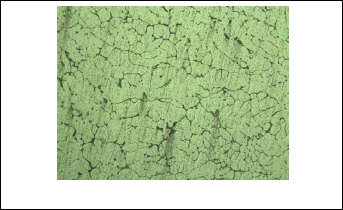
𝑄2
� ⋮ ⋱ ⋮
� � ⋮ � = � ⋮ � (14)
𝑘16 ⋯ 𝑘66
𝑑6
𝑄6
Where 𝑑𝑖 = ⌊𝑑0 … 𝑑6 ⌋𝑇 is the finite element degrees of freedom, 𝑄𝑖 = ⌊𝑄0 … 𝑄6 ⌋𝑇 is the load vector and 𝑘𝑖𝑖
stiffness coefficient.
The dislocation loop is represented by two levels sets f(x) and
g(x). The dislocation line is the intersection of f(x) = 0 and g(x)
Fig. 3. Microstructure of heat treated 6063 Al2O3 composite
= 0. The presence of dislocation line is
ζ = Λf × Λg . The
discrete equations for dislocations are given by
1
The variation of tensile strength with volume fraction and
K uu d u = f ext
∑ K ui q i
i =0
(15)
particle size is shown in figure 2. It is clearly shown that, for a
given particle size the tensile strength increases with an
The stiffness matrix is independent of the number,
orientation and location of the dislocations. In addition, since the effect of the dislocation appears only as a nodal force, the dislocation model is easily incorporated into ANSYS. In the present work the element edges were aligned with the grain boundaries and phase interfaces. The interface was assumed to be MgZn2 at grain boundaries. The crack propagation was not considered for the finite element modeling; however the likelihood of particle or matrix cracking was identified by the stress that exceeds the allowable stress of alumina particle or
6063 matrix alloy.
increase in the volume fraction of Al2 O3 . As the particle size decreases the tensile strength increases. This is due to fact that the smaller particles have a larger surface area for transferring stress from the matrix. The microstructure of heat treated composite is shown in figure 3. The other possibility, of increasing strength is owing to the formation of precipitates at the particle/matrix interface. The solubility of Mg and Si in the Al matrix decreases with a decrease of temperature as shown in figure 4. Thus, a lot of equilibrium phases precipitate by heterogeneous nucleation in the supersaturated solution. The presence of precipitations of Mg2 Si and AlFeSi influences the size of grains, avoiding the excessive growth of grain. Precipitated Mg2 Si is found as small particles in the interdendritic areas. The precipitation sequence is as follows:
IJSER © 2015 http://www.ijser.org
International Journal of Scientific & Engineering Research, Volume 6, Issue 3, March-2015 78
ISSN 2229-5518
β’ + β’’ β (stable) (16)
where β’ is GP-1 (Guinier-Preston-1 )+ β’’ (GP-2) zones, and β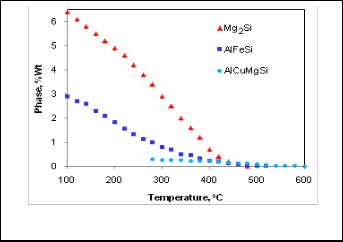
is M2 Si.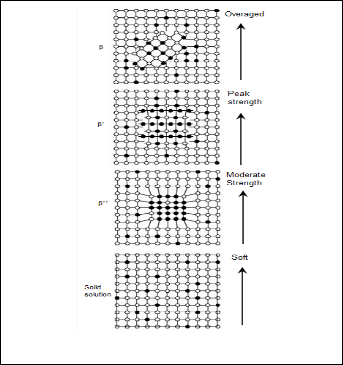
Fig. 4. Precipitates in of heat treated 6063 Al2O3 composite
Fig. 5. Strengthening mechanism due to formation of precipitates
A typical microstructure of 6063/Al2O3 consists of a mixture of Al3Fe, AlFeSi and AlFeMnSi intermetallic phases distributed at cell boundaries, accompanied sometimes with coarse Mg2Si. The strengthening mechanism due to formation of the precipitates is shown in figure 5. An increase in volume fraction with smaller particles of Al2O3 increases the amount of strengthening owing to increasing obstacles to the dislocations. This is because, smaller particle size means a lower inter-particle spacing so that nucleated voids in the matrix are unable to coalesce as easily.
Finite element model of test coupon of size 0.03mm x
0.03mm consisting of uniformly distributed particles of 10µm
size is shown figure 6a. The volume fraction of Al2 O3 is nearly
21%. The maximum tensile strength is 298.171 MPa (figure 6b)
whereas the experimental value is 300.864 MPa. This is error is due to assumption of uniform distribution of particles in the matrix. The maximum stress-intensity values are found over the particles and in the regions between the particles where the debonding occurs as shown in figure 6c. There is accumulation of dislocations in the path from the matrix to the particles through the matrix/particle interface collinear to the direction of tensile loading as shown in figure 6d. The stress intensity peaks across the centre line particles in the direction of tensile loading is shown in figure 5e. The stress intensity is highly concentrated at the particle cites. The particles are subjected to compressive stresses in the transverse direction to the tensile loading. The same kind of phenomena is observed with strain-intensity values (figure 6e) at the particle/matrix interface. The Al2 O3 particle experiences low level of strains as compared to the matrix because of their stiffness value of 476
GPa (figure 5f). The deformation of particles is negligible as compared to the matrix. This gives an impression of near uniform distribution of particles in the matrix due to two-level mechanical stirring and addition of Mg as a wetting agent.
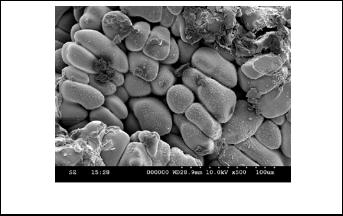
As the particle size increases the tensile strength decreases as shown in figure 2. The coarser particles were more likely to contain flaws, which might severely reduce their strength than smaller particles [11, 12]. There is a possibility of clustering (A) of Al2 O3 particles as seen in figure 7. These clusters act as sites of stress concentration. At higher volume fractions the particle-particle interaction may develop clustering in the composite. The formation of clustering increases with an increase in the volume fraction and with a decrease in the particle size. A five-particle clustering (particle size = 2µm and volume fraction = 20%) is modeled in ANSYS as shown in figure 8a. The experimental tensile strength is 337.26 MPa. The FEA result is 340.454 MPa (figure 8b). The transfer of load from the matrix to the particle via the matrix/particle interface and vice-versa is seen in figure 8c. The density of dislocations is highly colonized due to obstruction of the particle around it. The reduction of strength is due to debonding of particles in the direction of tensile loading. The maximum stress intensity is observed at the connectivity of adjacent particles with center particle in the direction of tensile loading as seen figure 8d. The cohesion of particles is likely to fracture under severe loading. The maximum strain intensity is also observed at the clustering interface of particles as seen in figure 8e.
IJSER © 2015 http://www.ijser.org
International Journal of Scientific & Engineering Research, Volume 6, Issue 3, March-2015 79
ISSN 2229-5518
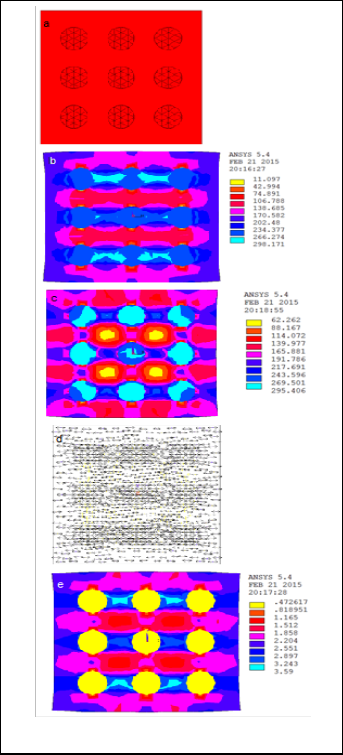
Fig.7. SEM illustration on particle clustering
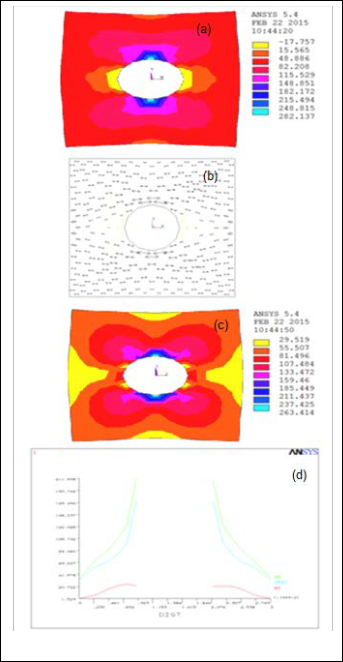
There is every possibility of cavity formation during the preparation of composite or during testing of composite due to debonding. The porosity of approximately 36µm is also revealed in the 6063/Al2 O3 composite having 10µm particles. Finite element model of test coupon of size 0.1mm x 0.1mm consisting of particles of size of 10µm is shown figure 9a. The experimental tensile strength is 277.48 MPa whereas the FEA result is 282MPa. The difference may be attributed not only to the effect of porosity but also to the cleavage gap of particle/matrix. The distribution of stress vectors around the cavity is shown in figure 6b. The maximum stress intensities are found in the matrix in the direction of tensile loading as shown in figure 6c. The stress intensity peaks in the direction of tensile loading as shown in figure 6d. The interruption of stress intensity curve is on account of porosity present in the composite.
The strength of a particulate metal matrix composite depends on the strength of the weakest zone and metallurgical phenomena in it. Even if numerous theories of composite strength have been published, none is universally taken over however. Along the path to the new criteria, we attempt to understand them.
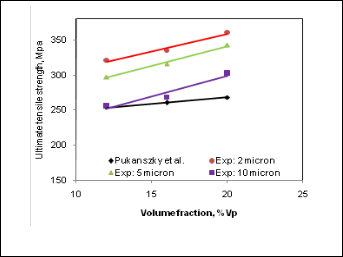
For very strong particle-matrix interfacial bonding, Pukanszky et al. [10] presented an empirical relationship as given below:
Fig. 6. Particle distribution and its effect on strengthening mechanism
σ c = σ
1 − v
m 1 + 2.5v
e
Bv p
(16)
where B is an empirical constant, which depends on the
surface area of particles, particle density and interfacial
bonding energy. The value of B varies between from 3.49 to
3.87. The strength values obtained from this criterion are
approaching the experimental values of the composites as shown in Figure 10. This criterion has taken care of the presence of particulates in the composite and interfacial bonding between the particle/matrix. The effect of particle size and voids/porosity were not considered in this criterion.
IJSER © 2015 http://www.ijser.org
International Journal of Scientific & Engineering Research, Volume 6, Issue 3, March-2015 80
ISSN 2229-5518
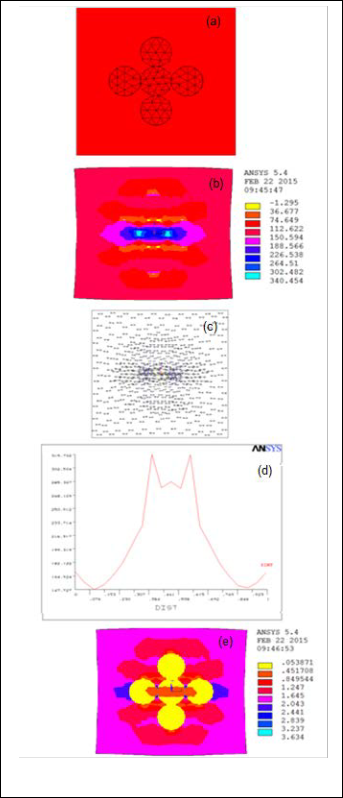
Fig. 9. Porosity and its effect on strengthening mechanism
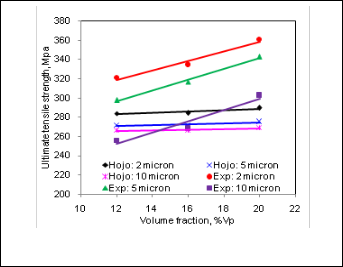
. Hojo et al. [11] found that the strength of silica-filled epoxy decreased with increasing mean particle size dp according to the relation
σ c = σ m + k (v p )d p −1/ 2
(17)
Fig. 8. Clustering of Al2O3 particles and its effect on strengthening mechanism
where k(vp) is a constant being a function of the particle loading. This criterion holds good for small particle size, but fails for larger particles as shown in figure 11. Withal, the composite strength decreases with increasing filler-loading in the composite.
IJSER © 2015 http://www.ijser.org
International Journal of Scientific & Engineering Research, Volume 6, Issue 3, March-2015 81
ISSN 2229-5518
Fig. 10. Pukanszky et al. criterion for strengthening mechanism
Fig. 12. Strengthening mechanism proposed by the author
Elastic modulus (Young’s modulus) is a measure of the stiffness of a material and is a quantity used to characterize materials. Elastic modulus is the same in all orientations for isotropic materials. Anisotropy can be seen in many composites. Alumina (Al2O3 ) has much higher Young's modulus (is much stiffer) than 6063 aluminum alloy.
Ishai and Cohen [12] developed based on a uniform stress
applied at the boundary, the Young’s modulus is given by![]()
c = 1 +
E m
1 + (δ − 1)v p
![]()
1 + (δ − 1)(v p
2 / 3
− v p )
(19)
2 / 3
Fig. 11. Hojo’s criterion for strengthening mechanism
A new criterion is suggested by the author considering
which is upper-bound equation. They assumed that the particle and matrix are in a state of macroscopically homogeneous and adhesion is perfect at the interface. The lower-bound equation is given by
adhesion, formation of precipitates, particle size, agglomeration, voids/porosity, obstacles to the dislocation, and the interfacial reaction of the particle/matrix. The formula![]()
c = 1 +
E m
v p
![]()
δ /(δ − 1) − v
1 / 3
p
(20)
for the strength of composite is stated below:![]()
where δ = E p E m .
σ = σ
1 − (v + v )
2 / 3
mm (v p +vv ) + ( )
−1/ 2
(18)
The proposed equation by the author to find Young’s modulus
c m 1 − 2(v
p
e
+ v )
k v p m p d p
includes the effect of voids/porosity in the composite as given below:
where vv is the volume fraction of voids/porosity in the
c 1 − vv
2 / 3
1 + (δ − 1)v p
2 / 3
composite, mm and mp are the possion’s ratios of the matrix
and particulates, and k(vp) is the slope of the tensile strength
against the mean particle size (diameter) and is a function of![]()
![]()
=
E m 1 − vv
2 / 3
v 1 + (δ − 1)(v p
2 / 3
− v p )
(21)
particle volume fraction vp. The predicted strength values are within the allowable bounds of experimental strength values as shown in figure 12.
The results of Young’s modulus derived from the proposed
equation (21) are approximately equal to the experimental
values and these values are also matching with those
computed by Ishai and Cohen criteria (table 1).
TABLE 1
IJSER © 2015 http://www.ijser.org
International Journal of Scientific & Engineering Research, Volume 6, Issue 3, March-2015 82
ISSN 2229-5518
Young’s modulus obtained from various criteria
Criteria | Young’s modulus, GPa | ||
Criteria | Vp =12 | Vp =16 | Vp =20 |
Ishai and Cohen (upper bound) | 166.23 | 174.29 | 182.30 |
New proposal from Author | 165.07 | 172.84 | 180.16 |
The tensile strength of 6063/Al2 O3 was analyzed by Weibull statistical strength criterion using Microsoft Excel software. The slope of the line, β, is particularly significant and may provide a clue to the physics of the failure. The Weibull graphs of tensile strength indicate lesser reliability for filler loading of 12% than those reliabilities of 16%, and 20% (figure
13). The shape parameters, βs (gradients of graphs) are 06.558,
10.537 and 11.924 respectively, for the composites having the
particle volume fraction of 12%, 16%, and 20%.
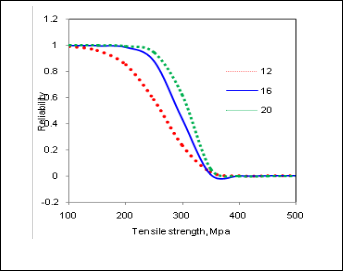
The Weibull characteristic strength is a measure of the scale in the distribution of data. It so happens that 63.2 percent of the composite has failed at σ0. In other words, for a Weibull distribution R (=0.368), regardless of the value of β. With
6063/Al2 O3 , about 36.8 percent of the tensile specimens should survive at least 330.036 MPa, 305.143 MPa, and 319.773
MPa for 12%, 16%, and 20% volume fractions of Al2 O3 in the specimens respectively. The reliability graphs of tensile strength are shown in figure 14. At reliability 0.90 the survival tensile strength of 6063/Al2 O3 containing 12% of volume fraction is 234.170 MPa, 16% of volume fraction is 246.463
MPa, and 20% of volume fraction is 264.776 MPa. This clearly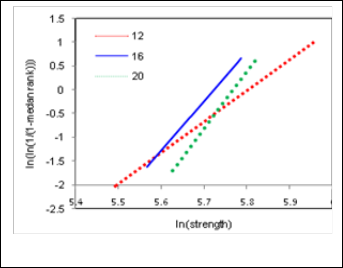
indicates that the tensile strength increases with increase in volume fraction of Al2 O3 . These results are matching with those of FEA results with an error ranging 2.26 to 5.08%.
Fig. 14. Reliability of 6063/Al2O3 composites
Fractography (figure 15) reveals microscopically local ductile and brittle mechanisms. Failure of the composite was found to occur by particle-matrix decohesion at the interface. The fracture process in a high volume fraction (20%) aluminum/Al2 O3 composite is very much localized. The failure path in these composites is from the matrix to the particle through the matrix/particle interface elongation or cracking [13], [14]. The presence of Al2 O3 reinforcement particles reduces the average distance in the composite by providing strong barriers to dislocation motion. The interaction of dislocations with other dislocations, precipitates, and Al2 O3 particles causes local accumulation of the dislocations. The presence of voids is also observed in the composites having larger Al2 O3 particles. The void coalescence occurs when the void elongates to the initial intervoid spacing.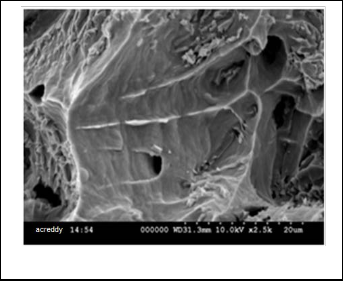
Fig. 13. Weibull distribution of tensile strength
Fig.15. Fractography of 6063/Al2O3 composite
IJSER © 2015 http://www.ijser.org
International Journal of Scientific & Engineering Research, Volume 6, Issue 3, March-2015 83
ISSN 2229-5518
The stable precipitates such as Mg2Si, Al3Fe, AlFeSi and AlFeMnSi were observed in the 6063/Al2 O3 composites. The porosity of approximately 39µm was also revealed in the
6063/Al2 O3 composite having 10µm particles. At higher volume fractions concentration, i.e., small interparticle
distances, the particle-particle interaction may develop agglomeration in the composite. The tensile strength increases with increase in volume fraction of Al2 O3 , whereas it decreases with increasing particle size. The experimental values of tensile strength and Young’s modulus are nearly equal to the predicted values by the new formulae proposed by the author. The FEA results confirm the occurrence of particle debonding, porosity, and clustering in the composites.
The author acknowledges with thanks University Grants Commission (UGC) – New Delhi for sectioning R&D project, and Tapasya Casting Private Limited – Hyderabad, and Indian Institute of Chemical Technology – Hyderabad for their technical help.
[1] P.K. Rohatgi, R. Asthana and S. Das, “Solidification, Structures and Properties of Cast Metal-Ceramic Particle Composites,” International Materials Reviews, vol. 31, pp. 115-139, 1986,.
[2] A.C.Reddy, “Mechanical properties and fracture behavior of 6061/SiCp Metal Matrix Composites Fabricated by Low Pressure Die Casting Process,” Journal of Manufacturing Technology Research, vol.1, pp. 273-286, 2009.
[3] A.C..Reddy, “Strengthening mechanisms and fracture behavior of
7072Al/Al2O3 metal matrix composites,” International Journal of
Engineering Science and Technology, vol.3, pp6090-6100, 2011.
[4] A.C.Reddy, “Tensile fracture behavior of 7072/SiCp metal matrix composites fabricated by gravity die casting process,” Materials Technology: Advanced Performance Materials, vol.26, no.5,pp. 257-262, 2011.
[5] A. M. Redsten, E. M. Klier, A. M. Brown, D. C. Dunand, “Mechanical properties and microstructure of cast oxide-dispersion-strengthened aluminum” Materials Science & Engineering, vol.201A, pp.88-1021995.
[6] T.S. Srivatsan, “Microstructure, tensile properties and fracture behavior of Al2O3 particulate-reinforced aluminum alloy metal matrix composites,” Journal of Materials Science, vol.31, no.5, pp.1375-1388, 1996.
[7] S.V. Kamat, J.P. Hirth, and R. Mehrabian, “Mechanical properties of particulate-reinforced aluminum-matrix composites,” Acta Metallurgica, vol.37, no.9, pp.2395-2402, 1989.
[8] R. H. Pestes, S.V. Kamat, and J.P. Hirth, “Fracture toughness of Al-
4%Mg/Al2O3 composites, Materials Science & Engineering, vol.189A, pp. 9-
14, 1994.
[9] Chennakesava R Alavala, ‘Finite Element methods: basic Concepts and
Applications,” PHI Learning Pvt. Ltd, New Delhi, 2009.
[10] B. Punkanszky, B.Turcsanyi, and F.Tudos, “Effect of interfacial interaction on the tensile yield stress of polymer composites”, In: H. Ishida, editor, Interfaces in polymer, ceramic and metal matrix composites, Amsterdam: Elsevier, pp
467-7, 1988.
[11] H. Hojo, W. Toyoshima, M. Tamura, and N. Kawamura, “Short- and long- term strength characteristics of particulate-filled cast epoxy resin”, Polymer
Engineering and Science, vol. 14, pp 604-609, (1974).
[12] O. Ishai, and I.J Cohen, “Elastic properties of filled and porous epoxy composites”, International Journal of Mechanical Sciences, vol. 9, pp 539-546,
1967.
[13] A. C. Reddy, “Fracture behavior of brittle matrix and alumina trihydrate particulate composites”, Indian Journal of Engineering & Materials Sciences, vol. 5, pp 365-368, 2002.
[14] A. C. Reddy, and S. Sundararajan, “Influence of ageing, inclusions and voids on ductile fracture mechanism in commercial Al-alloys,” Bulletin of Materials Science, vol.28, pp.75-79, 2005.
IJSER © 2015 http://www.ijser.org