International Journal of Scientific & Engineering Research, Volume 5, Issue 2, February-2014 719
ISSN 2229-5518
Carbon Balance Estimation of Agricultural Practices through Evaluation of Paddy Cultivation Processes – A Case Study in Murshidabad District, West Bengal (India)
Soumyajit Bhar, Abhijit Das
Abstract: Over last 4-5 decades, rampant usage of energy has significantly increased GHG emissions from agricultural sector. Though currently available estimates don’t focus only on agriculture and also don’t include its carbon capture potential. Hence the picture presented is an incomplete one. On the other hand a more direct & focussed study has been conducted to measure the carbon balance of agricultural practices by incorporating the carbon capture potential of agriculture. This estimate will possibly provide a more appropriate picture of the existing status of agricultural emissions in-comparison to the other GHG emitting sectors.
Field based study has been conducted on paddy cultivation as it’s one of the most significant GHG emitting agricultural practices. The study area has been chosen from Murshidabad district being one significant rice producing district of the highest rice producing state, W est Bengal.
Incorporating estimates from both the seasons the total agricultural GHG emissions from paddy cultivation estimated to be around 1374-2481 kg of CO2 equivalent/ha without including livestock and allied emissions and soil carbon loss occurred during cultivation. Including approximated emissions from livestock and manure management the emissions level will rise up to 1932-3377 kg/ha. The amount of CO 2 equivalent of carbon being captured in the growth of paddy plants is being evaluated to be 14474-20880 kg/ha throughout the year. W ith these sets of evaluation it has been found that in both the considered seasons (monsoon & winter) the maximum emission accounted for only 20-21% of the total capture and thus the carbon balance of modern agriculture practices is still significantly negative. Hence the conclusion is that GHG emissions from systems, like agriculture, with carbon capture potential should not be compared directly with the other GHG emitting sectors without capture potential. Also it has been found that controlling the irrigation requirements in both the seasons may provide a comprehensive solution to reduce the overall agricultural GHG emissions through significant reduction in methane emission and lower operational emissions from irrigation requirements.
Index Terms: Carbon Balance, Agricultural GHG Emission, Carbon Captured in Agriculture, Biomass Estimation, Climate Change, Energy Usage in Indian Agriculture, Climate Change & Paddy Cultivation.
Introduction: It is a fact that modern day agriculture is
one of the most significant GHG emitting sectors along with other major GHG emitting sectors like energy or industry. At present agriculture directly contributes 14% of total global emissions and when combined with related changes in land use including deforestation, agriculture’s contribution rises to more than one-third of
Soumyajit Bhar is a PhD student in Conservation Science & Sustainability Studies at ATREE, Royal Enclave,Sriramapura, Jakkur Post, Bangalore- 560 064, Office Ph No: +91 80 23635555, Mobile No:
+91 92315 05159 || +91 78468 83691, Email Id:
bharsoumyajit88@gmail.com || soumyajit.bhar@atree.org
Dr. Abhijit Das, Assistant Professor, Department Of Economics
Kandi Raj College, Kandi, Murshidabad, West Bengal, Ph No: +91
94334 49642, Email Id: abhijit.dasecon@gmail.com
Corresponding Author: Soumyajit Bhar
total GHG emissions [1]. It has been reported that
from India [2]. These estimates predominantly consider the direct emissions in the forms of methane and N2 O emission, along with emissions from agricultural allied sector like livestock management. In the total emission from Indian agricultural system around 35.9% account directly from methane emission from paddy field, N2 O emission from the soil and emission due to biomass burning. The rest 64.1% accounts from livestock emission and manure management. In the total emission from Indian energy sector 3.1% account due to energy use, except the use of grid electricity, in agriculture and fisheries [2]. The operational1 GHG emission from agriculture doesn’t get included in the estimate directly. Rather the energy inputs2 required for agriculture are

1 Emissions from fertilizer production processes, tillage, irrigation and transportation requirements.
2
agriculture contributes 17.6% of the total GHG emission
Direct energies used in agriculture are either electricity or
fossil fuels, mainly diesel.
IJSER © 2014 http://www.ijser.org
International Journal of Scientific & Engineering Research, Volume 5, Issue 2, February-2014 720
ISSN 2229-5518
being considered in the other GHG emitting sectors like energy or industry. The operational emissions should be integrated in the same estimate because these avenues also possess a significant contribution to the overall agricultural emissions. The global warming potential of conventional agriculture is strongly affected by the use of synthetic nitrogen fertilizers and by high nitrogen concentrations in soil. Global nitrogen fertilizer consumption (produced by fossil energy) in 2005 was
90.86 million tonnes [3]. It takes approximately 90 million tonnes of fossil fuel (diesel equivalent) to produce nitrogen fertilizer. This is about 1% of global fossil energy consumption [4]. So to get a more appropriate estimation of agricultural emissions it would be essential to include the following in an estimate: Under Operational emissions i) the direct use of fossil fuels in farm operations; ii) the indirect use of embodied energy in inputs that are energy-intensive to manufacture (particularly fertilizers); Under Direct emissions iii) loss of soil organic matter or carbon due to cultivation of soils, iv) methane emitted due to paddy cultivation, v) N2 O emission from soil and emission due to biomass burning.
On the other hand, agriculture is also an accumulator of carbon, offsetting losses when organic matter is accumulated in the soil, or when above-ground woody biomass acts either as a permanent sink or is used as an energy source that acts as substitute for other fossil fuels usage. In the discussed estimates the carbon capture potential of agriculture also has not been included. At present the frequencies of cultivation have also increased. Currently through out the year a land is being
In this context paddy cultivation practices, due to the methane emissions, is one of the most significant contributors of total agricultural GHG emission, especially in India. Methane emission level is 20.9% of the total amount of emission from agriculture, amounting to 69.87 million ton of CO2 ’s equivalent [2]. As paddy is the principle crop of West Bengal, the state accounts for the highest amount of methane emission from the paddy fields among the other states of India [5]. Hence it is imperative to measure the carbon balance of Paddy cultivation in West Bengal to capture the overall picture of carbon balance of various crops cultivated throughout India. This will generate a holistic picture of the entire agricultural sector of the country in this context.
Materials and Methodology:
Study area
Murshidabad district is selected as the study area
because of its Rice productivity stands in forth positions (2806.3 kg/Ha) among the other 18 rice producing districts of West Bengal. Monsoon and winter paddy are predominantly
cultivated in
this district. Though in some areas of the district for another season paddy is being cultivated, but this study has
concentrated
cultivated approximately 2-3 times. Sometime it goes up
to even 3-4 times. This increased cultivation frequency has proportionately enlarged the scope of carbon capture through biomass accumulation in various crops. Hence, instead of just measuring the GHG emissions level, it is
only on monsoon and winter paddy cultivation.
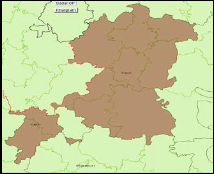
Fig1: Map of Kandi Community
Development Block. Source: "West
Bengal."Map. Www.ssa.ind.in. RIDDHI, n.d. Web. 8
Jan.
necessary to evaluate the net carbon balance of
agricultural practices in developing countries considering both emissions and absorptions. This will eventually present an appropriate and rather pragmatic view on the effective contribution of GHG from agricultural sector in comparison to other significant GHG emitting sectors like industry, transportation or energy.
From the Murshidabad district, Kandi block is only being considered as it possess 5th and 3rd positions among the other blocks in terms of total paddy cultivated area throughout the year and total paddy production level respectively. The map of the block is given in Fig. 1. Its geographical area and population are 238.54 km2 and
192,952 (2001 Census report) respectively. For monsoon and winter paddy cultivation 68% and 63% of total area of the block is being utilized respectively. Throughout
IJSER © 2014 http://www.ijser.org
International Journal of Scientific & Engineering Research, Volume 5, Issue 2, February-2014 721
ISSN 2229-5518
the block, 206 families are being surveyed over 15 villages and covering all its Gram Panchayats (10 GPs).
This research has used two levels of methodologies. First level is used for the collection of primary data from the selected field areas. Second level is applied to compile those collected primary data sets to meet the research objectives.
Primary data has been collected through interview based method. Samples were taken from the selected study areas, through random sampling among the families directly related with agriculture especially paddy cultivation. Individual interviews and focussed group discussions have been conducted to collect data sets and to cross check them for validation and authentication.
In the process of evaluating the amount of carbon captured, both soil carbon loss and sequestration has not been considered as this study focussed predominantly on the crop cycle. The emission due to biomass burning also has not been considered, being very negligible and not being a common practice in paddy cultivation.
Methodology for Emission Evaluation
• The standard GHG emissions potential of various fertilizers during its manufacturing is being considered from different literatures. Generally in the study areas, four kinds of fertilizers are predominantly used. These are Urea (46:0:0), DAP (18:46:0), NPK (10:26:26), MOP (0:0:60). Now the amount of CO2 equivalent of GHG emitted in production of per kg of the Urea is 1848.7 g, DAP is
866.2 g [6] and MOP is 340 g [7]. As NPK (10:26:26)
emission level is not available in any literature hence to calculate that it’s constitutes are being used considering their respective percentage. The predominant constitutes of NPK (10:26:26)3 are Urea, TSP, MOP and their emission levels are respectively
601g, 170g, 340g per kg of production [7]. With these values the emission level of NPK (10:26:26) is appraised to be 280 g per kg of production. In Kongshaug, 1998 [7] the methane emission during fertilizer production has not been considered where

3 NPK (10:26:26) have different constitutes but the stated in the paper is the most common one.
Davis and Haglund, 1999 [6] has considered that [8]. The average ratio of the estimates of Urea and DAP from both the literatures are being considered as a multiplication factor to include the methane emission from production in the estimates of NPK (10:26:26) and MOP. The emission level of Urea and DAP in Kongshaug, 1998 [7] is 610 g and 460 g respectively for per kg of production. So the ratios of these two estimates are 0.32 and 0.53 respectively. The average ratio or the multiplication factor has been derived to be 0.42. So the final estimates of NPK (10:26:26) and MOP considering the average multiplication factor is being evaluated to be 886 g and 810 g per kg of production. The emissions from transportation requirements in fertilizers production processes for only DAP is available in Davis and Haglund, 1999 [6] among the other fertilizers that has been considered in this literature. The corresponding emissions level from DAP is 211.3 g per kg [6]. This stated amount for DAP has been used for the other fertilizers also. The final estimates considering the transportation emission during manufacturing of Urea, DAP, NPK (10:26:26) and MOP are 2060 g, 1077.5 g, 1097.3 g, 1021.3 g per kg of production respectively.
• The GHG emissions from irrigation sectors will be evaluated on the basis of the following ways, based on the type of operation of the irrigation methods.
• In case of pump set is run by electricity, according to the wattage of the pump set, 0.94 kg CO 2 emission level per unit of electricity production in eastern zone of India during 2009-10 [9] will be used to calculate the total emissions occurred during irrigation.
• In case of pump set run by diesel, emission factor for diesel of 2.67 kg/lt [10] will be multiplied with the amount of diesel consumed to calculate the emission.
• The GHG emissions for the tillage and transport requirement in agriculture will be evaluated from the amount of fuel used (generally diesel) in litres and the emission factors expressed in kg/lt. For diesel it is 2.67 kg/lt [10].
IJSER © 2014 http://www.ijser.org
International Journal of Scientific & Engineering Research, Volume 5, Issue 2, February-2014 722
ISSN 2229-5518
• If bullocks are being used for tillage, the GHG (predominantly methane) emissions due to enteric fermentation of bovine stock and due to manure management will be evaluated. The emissions rates of methane due to enteric fermentation of non-dairy indigenous cow 20 kg/animal/year and the same for manure management is 1.85 kg/animal/year [11].
• The methane emission levels from paddy field are being taken as 2.01±1.49 g/m2 for irrigated intermittently flooded multiple aeration zones and
6.62±1.89g/m2 for irrigated intermittently flooded
single aeration zones4 [5] Methane’s Global Warming Potential (GWP) will be taken as 21 times of CO2 according to IPCC standard.
• The N2 O emission factor from soil is 0.3 kg/acre or
0.76 kg/Ha for paddy cultivation where urea is directly used without any inhibitors5 [12]. GWP of N2 O will be considered as 298 times of CO 2 according to IPCC standard.
Methodology for Capture Evaluation
• The percentage of carbon present in rice straw and
husk will be used to evaluate the amount of carbon in the above ground biomass. These percentages are 39 and 44 by weight respectively [13]. The average root to shoot ratio of four considered ecotypes on Indica lowland rice varieties has been found to be 0.13 [14]. This value will be used to evaluate the carbon content6 of the root biomass. After the harvest generally around
10% by height above ground biomass left in the field

4 These two zones, out of other five possible zones have been considered because of there apparent prevalence in the selected field area.
5 Inhibitor or Urease inhibitors reduce the initial atmospheric loss of surface applied urea by reducing the conversion of urea to ammonium. Nitrification inhibitors slow the subsequent process of converting ammonium to nitrate, and hence to nitrous oxide in soil which is then released into the atmosphere. Source: Website of Department of Climate Change and Energy Efficiency, Australian Government.
6 Percentage of carbon content of the root biomass has been taken same as that of the straw.
along with the root biomass. The weight of the above ground left-over biomass is also assumed to be 10% of the weight of the harvested straw. Hence the net weight of the left-over biomass will be 23%7 of the net harvested straw.
• Generally the rice grain content 80% of carbohydrates
and approximately 6% of protein, 2% of fat [15].
Adequate literatures are not available to estimate the exact chemical compositions of proteins and fats present in various rice grains. Thus Carbon content of rice grain is being approximated from carbohydrate’s carbon content, considering its amount to be 88%8 by weight.
Result:
Emission from Fertilizer Production
Following two sets of fertilizers application strategies
have been observed in the study area:
Set 1: DAP and MOP are being used in the time of soil
preparation. Later Urea is applied separately.
Set 2: NPK (10:26:26) and Urea are being used in the time
of soil preparation. Later Urea is applied again.
The collected data sets of fertilizers application levels show a high variation. For all the fertilizers the amount been applied is considered in three levels: maximum, average and minimum to get a complete picture of the emissions due to fertilizers production.
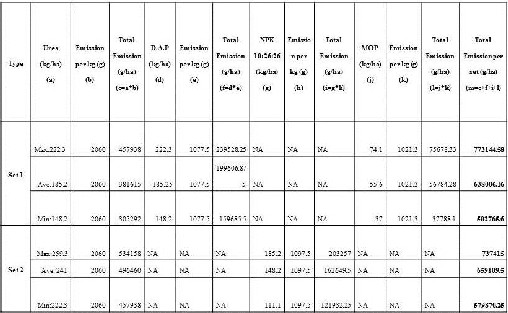
Considering the above two sets of usages and the three levels of fertilizer application in each sets, total six CO2 equivalent emission levels from fertilizers production have been calculated for both monsoon (Table 1A) and winter (Table 1B).
Considering both the sets final estimates of CO2 equivalent emission from fertilizer production for monsoon season are within 338.9-620.6 kg/ha and for winter are within 502.8-773.1 kg/ha.
Emission from Irrigation Requirements

7 Root biomass being 13% has been evaluated from root to shoot ratio of 0.13.
8 Including the amount of protein i.e. 6% and fat i.e. 2% by weight is equivalent to that of carbohydrate.
IJSER © 2014 http://www.ijser.org
International Journal of Scientific & Engineering Research, Volume 5, Issue 2, February-2014 723
ISSN 2229-5518
It has been found that over last few decades the use of underground aquifer for meeting irrigation needs have increased in the study area. Due to the use of underground aquifer the electricity operated submersible pumps, instead of diesel driven pumps, are predominantly being used especially in winter. Actually winter paddy cultivation is completely irrigation dependent. Even in the monsoon due
Table 1A Estimation of Emission from Fertilizer Production in Monsoon Season
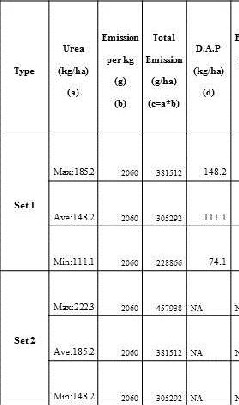
Table 1B: Estimation of Emission from Fertilizer Production in Winter Season
to erratic rainfall 9, significant amount of irrigation is
IJSER © 2014 http://www.ijser.org
International Journal of Scientific & Engineering Research, Volume 5, Issue 2, February-2014 724
ISSN 2229-5518
required. The amount is estimated to be around one third of that of winter season. Still it is an average approximated estimate because the irrigation requirements are completely dependent on timing and quantity of rainfall in a particular season. The detailed calculation for winter is shown in Table 2.
Table 2: Estimation of Emission from Irrigation
Requirements
The final estimate of emissions varies within the range of
501.6-626.8 kg of CO2 equivalent/ha in case of winter. In
case of monsoon the estimate will be around 167.2-208.9 kg of CO2 equivalent/ha considering it is one third of the winter season’s emission.
Emission from Tillage Requirements:
It has been observed in the study area that normal tractor
is predominantly being used for tillage. In some areas
though mechanized hand tractor is being used, yet its usage is very limited. Fuel consumption level of the mechanised hand tractor is almost same as the normal tractor. Hence the emission level is being calculated as per the use of normal tractor. Generally for paddy in every season the field is being tilled for 4 times. This fact has been considered to calculate the duration of tractor usage in each season. As now a day’s bullock based tilling is very rare10 so the methane emission from bullock due to enteric fermentation has not been considered. The detailed estimation is available in Table
3. The CO2 equivalent emitted due to tillage in both

9 According to the farmers the distribution of rainfall has reduced. Hence during the critical period of the paddy cultivation, even in monsoon, irrigation is required.
10 Bullock driven ploughing has been rare due to the amount of time required for ploughing compared to mechanized modes, lack of availability of labour for bullock driven tilling and also due to the insufficient availability of fodder for the bullock throughout the year.
seasons is around 78.8-98.8 kg/ha irrespective whether it is hand or normal tractor.
Table 3: Estimation of Emission from Tillage
Emission from Transport Requirement
The transport requirements for agriculture mainly
accounts for the following two areas:
Due to fertilizers or other inputs transportation.
Due to transportation of the final produce to the market. In this case it is the transportation of rice grain to rice mill.
In the first case due to high demand, the fertilizers shops
are available within the vicinity of the villages. Farmers
generally carry the fertilizers on their bicycle or in a paddle van. So there is no question of GHG emission from these types of transportation means.
In the second case, the average distance of the nearest rice mill from each village and the fuel required for per kg of produce to cover that distance in a standard goods carrying vehicle, are being used to evaluate the amount of emissions from the transportation requirements. The amount of CO2 equivalent emitted in g per kg of the produce is being evaluated in Table 4 to be 4.4-5.1 g/kg. Now considering the primary production level in monsoon and winter to be 3705-4446 kg/ha and 4446-
5187 kg/ha, the total emission due to produce
transportation will be 16.3-22.7 kg/ha and 19.6-26.4 kg/ha
respectively.
Table 4: Estimation of Emission from Transport
Requirement
IJSER © 2014 http://www.ijser.org
International Journal of Scientific & Engineering Research, Volume 5, Issue 2, February-2014 725
ISSN 2229-5518
Emission from the Anaerobic Zone in the Paddy Field
In the study area it has been observed during the winter
season, the water level in the field goes down more than once. In monsoon around 50% areas it goes down more than once and in the rest it goes down at least once. Hence emission level of monsoon is being estimated by averaging the emission levels of irrigated intermittently flooded multiple aeration zone and the intermittently flooded single aeration zone. Thus the evaluated emission level for the monsoon is 4.32±1.69 g/m2. Finally methane emission level derived to be 43200±16900 g/ha or 43.2±16.9 kg/ha in monsoon and 20100±14900 g/ha or
20.1±14.9 kg/ha for winter. Considering the GWP of methane the final emission level will be 907.2±355 kg/ha in monsoon and 422.1±313 kg/ha of CO2 equivalent in winter season.
Emission of N2 O from Soil
Excess application of nitrogenous fertilizers is the main
cause of N2 O emission from the soil. Considering the GWP of N2 O the final emission level will be 226.5 kg/ha of CO2 equivalent in both monsoon and winter seasons.
Evaluation of Amount of Carbon Captured
In case of rice grain and husk the amount measured in
terms of their weight can be directly used for the
estimation. In villages the common notion of
measurement of straw is not by weight rather it is measured in terms of volume. Thus an action research is being conducted to measure weight of a standard volume of straw. Weight of straw depends on the amount of water present in a particular sample, hence samples of different dryness have been considered. The weight range is derived to be 350-400 g/Aati11 or 28-32 kg/pon. In general the primary production level of paddy in monsoon is around 3705-4446 kg/ha while it is
4446-5187 kg/ha in winter. Generally during husking
around 67% of rice grain is being produced and the rest is husk. Considering these percentages the level of rice grain production in monsoon and winter seasons will be
2470-2964 kg/ha and 2964-3458 kg/ha respectively. The
same for the husk will be 1235-1482 kg/ha and 1482-1729
kg/ha. Straw production level in monsoon varies

11 Aati is the lowest unit of volume used to measure the amount of straw. The next higher unit of volume is Pon (1 Pon=80 Aati). The highest unit generally used is Kahan(1Kahan= 16 Pon).
between 185-207 pon/ha whereas it is around 200-237 pon/ha in winter season.
The amount of CO2 equivalent captured in per kg of rice grain is being estimated in Table 5 to be 1291 g. The same for the husk is being estimated in Table 6 to be 1558 g. Considering the production level, the amount of CO2 equivalent captured in the rice grain is within 3188.8 –
3826.5 kg/ha in monsoon and 3826.5-4464.3 kg/ha in
winter. Similarly for the husk it is 1924.1-2308.9 kg/ha in monsoon and 2308.9-2693.8 kg/ha in winter. So, total CO2
Table 5: Estimation of CO2 Equivalent Carbon Captured in Rice Grain
Table 6: Estimation of CO2 Equivalent Carbon Captured in Husk
equivalent has been captured in the aggregate primary produce of Paddy (entire Paddy grain) is 5112.9- 6135.4 kg/ha in monsoon season and 6135.4 - 7158.1 kg/ha in winter.
In Table 7 the amount of CO 2 equivalent present in straw has been evaluated to be 50.6-57.9 kg/pon. Considering the amount of straw production in monsoon and winter, the emission levels are 9361-11985 kg/ha and 10120-13722 kg/ha of CO2 equivalent respectively.
Table 7: Estimation of CO2 Equivalent Carbon Captured in Straw and Root Biomass
IJSER © 2014 http://www.ijser.org
International Journal of Scientific & Engineering Research, Volume 5, Issue 2, February-2014 726
ISSN 2229-5518
Total amount of CO2 equivalent stored in paddy cultivation in monsoon and winter are 14473.9-18120.4 kg/ha and 16255.4-20880.1 kg/ha respectively.
Operational Emission Details
In Table 8 all the different operational emissions have
been summarised and total operational emission has
been calculated to be 601.3-951kg/ha and 1102.9-1525.1
Table 8: Summary of Operational Emissions
kg/ha of CO2 equivalent in monsoon and winter respectively. The seasonal variations of emissions level from different operational avenues have been shown in the Fig 2.
Fig 2: seasonal distribution of Average Operational
Emission.
Direct Emission Details
In Table 9 different direct emissions have been
summarised and total direct emission has been evaluated as 772.7-1482.7 kg/ha and 329.6-955.6 kg/ha of CO2 equivalent in monsoon and winter respectively.
Table 9: Summary of Direct Emissions
In Fig 3 the seasonal variation of different direct
emissions have been given and in Fig 4 the distribution
of total yearly average of operational & direct emission has been shown. In Fig 5 seasonal distributions of total average operational and direct emission has been plotted.
Fig 3: Seasonal Distribution of Average Direct Emission
Fig 4: Yearly Average Operational and Direct Emission
Fig 5: Distribution of Seasonal Average Operational and
Direct Emission
Evaluation of Carbon Balance
In Table 10 total operational and direct emission
throughout the seasons has been used to evaluate the
seasonal total emission from paddy cultivation. The total emission is 1374-2433.7 kg/ha in monsoon and 1432.5-
2480.7 kg/ha during winter in terms of CO2 equivalence. Carbon balance also has been evaluated in the Table 10. As the amount of CO2 equivalent emitted is significantly less than the amount being captured so instead of
IJSER © 2014 http://www.ijser.org
International Journal of Scientific & Engineering Research, Volume 5, Issue 2, February-2014 727
ISSN 2229-5518
subtracting the latter from the former, the emissions has been expressed in terms of percentage to the amount that has been captured. With this method, the carbon balance has been evaluated as 9.5-13.5 percent in monsoon and
8.8-11.9 percent in winter. The seasonal distribution of
Table 10: Evaluation of Carbon Balance & Ratio of
Operational and Direct Emissions
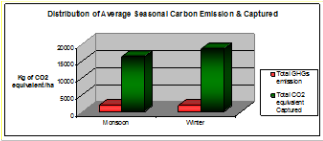
total average emission and total average capture has been shown in the Fig 6.
Fig 6: Distribution of Average Seasonal Carbon Emission and Captured
Discussion
In this paper, it shows that through out the year average operational emission slightly exceeds the average direct emission. Hence in this estimate around 67% of the total emission12 has been included of the emission level estimated considering livestock emissions in overall agricultural emission. Now if the rest 33% can be taken into account to the estimated carbon balance then it will become at par with the emission evaluation framework used for most of the studies as well as MoEF, 2007[2]. In

12Direct emissions (methane emissions and N2O emissions) contribute around 33.5% (approx.) (MoEF, 2007) of the total estimate, evaluated including the livestock emission. Consider operational emission equal to direct emission total contribution by both of the avenues become 67%.
that case the carbon balance will maximum shift up to
20-21 percent.
From another perspective, it can be argued that the amount of carbon captured in agriculture is not really a permanent capture as rice grain will get consumed and husk or straw either will become rural fuel or fodder. Ultimately the captured carbon will get converted into different carbon compounds and eventually will get back to the atmosphere. Yet in each of the usages (i.e. rice grain used as food and the secondary produce used as fuel and fodder) the net emission should not be considered by just converting the amount of carbon captured directly to CO2 equivalent depending on the process of conversion. Rather it should be evaluated by considering the socio-economic value of the usages and the potential emission from the possible substitution of those materials. Like agriculture, there are systems which may emit certain amount of GHG in their natural course of operation but those systems generally provide a huge social and economic benefit. Instead of just evaluating how much CO 2 will be emitted when straw will be burned, the economic and social benefit of the burning (i.e. the benefit and necessity of cooking and also the emission level of the substitution i.e. may be LPG or Kerosene) should be considered to derive the effective or net emission only then it will capture the full spectrum. Hence although the amount of carbon captured in paddy cultivation will not remain in the same state still it is worth to consider for evaluating the carbon balance, as it can’t be directly translated into the equivalent CO2 emission, ignoring the social benefit.
Thus significant carbon balance reveals that though it has been well discussed through out the world that agriculture is one of the main contributors of the GHG emissions yet it demands a thoughtful re-examination. In this context the impact of the inclusion of both soil carbon loss and sequestration into the carbon balance evaluation, presents a serious scope of research. As World Bank, 2012 [16] pointed out various agricultural activities like tillage operation, excessive fertilizers use are causing soil carbon loss of 0.7 to 2.1 Gt of carbon per year at a world scale. Also Lal, 2004 [17] has concluded that cultivated soils have lost one-half to two-thirds of the original SOC13 pool with a cumulative loss of 30–40

13 Soil Organic Carbon
IJSER © 2014 http://www.ijser.org
International Journal of Scientific & Engineering Research, Volume 5, Issue 2, February-2014 728
ISSN 2229-5518
Mg14 C/ha. Considering its current level though this inclusion will definitely shift carbon balance towards being more neutral but still it may remain considerably negative.
From the evaluated relative contribution of different avenues of GHG emissions, it can be concluded that if the amount of water stagnation in the paddy field can be controlled then significant reduction of the total GHG emission is possible due to decline in the methane emission. It will also lower the emissions from irrigation requirements due to less demand of water. In this context a new method of rice cultivation called system of rice intensification mainly focussing on the controlling irrigation requirements in paddy cultivation, can be examined to evaluate the potential reduction of GHG emissions. Among the different methods of rice crop establishment, lowest seasonal CH4 emission (19.93 kg/ha) and GWP (498.25 kg CO2 / ha) coupled with higher water productivity was recorded with SRI method [18]. In these circumstances the other avenues of operational emissions especially the amount of fertilizer used solely depends on the farmer’s choice and on other different social and economic factors. Thus it is difficult to generalize and not well thought through measures to reduce operational emissions may induce significant decrease in the productivity. As Buresh and Witt, 2008 [19] rightly stated that across Asia, yields of irrigated rice in the absence of fertilizer N are consistently insufficient to meet food needs and achieve highest profit for farmers.
Conclusion
At last it can be concluded that this focussed carbon balance evaluation process is the most appropriate to evaluate GHG emission level of those sectors which have a natural capability of capturing carbon during their normal course of operation. In this context sectors without any carbon capture potential i.e. energy and industry sectors can be called as completely GHG dependent sectors where as agricultural sector can be named as the GHG recycling sector.
Acknowledgment: Not required.
References:

14 Mg= mega gram=106g=1 ton
[1] Bockel, L., G. Smith, M. Bromhead, M. Bernoux, M. Tinlot, H. Matieu, and G. Branca, 2010, “Mainstreaming carbon balance appraisal of agriculture projects and policies?,” Policy brief by Food and Agriculture Organization of the United Nations, FAO. Rome, Italy, 19p.
[2] MoEF, 2010, “India: Greenhouse Gas Emissions
2007,” Indian Network for Climate Change Assessment. Ministry of Environment and Forests (MoEF), Government of India, New Delhi, India, 84p.
[3] Beever, D., F. Brentrup, P. Eveillard, P. Fixen, P.
Heffer. B. Herz, R. Larson, et al. 2007. “Sustainable Management of the Nitrogen Cycle in Agriculture and Mitigation of Reactive Nitrogen Side Effects,”Task force on Reactive Nitrogen, International Fertilizer Industry Association. Paris, France, 32p.
[4] Niggli, U., H. Schmid, and A. Fliessbach, 2007
“Organic Farming and Climate Change,” Briefing prepared by the Research Institute of Organic Agriculture FiBL, Frick, Switzerland, for the International Trade Centre ITC, Geneva, Switzerland, 23p.
[5] Gupta, P. K., V. Gupta, C. Sharma, S. N. Das, N.
Purkait, T. K. Adhya, H. Pathak, et al. 2009,
“Development of Methane Emission Factors for
Indian Paddy Fields and Estimation of National
Methane Budget,” Chemosphere 74 (4): 590-598.
[6] Davis, J. and C.,Haglund, 1999, “Life Cycle
Inventory (LCI) of Fertiliser Production.
Fertiliser Products Used in Sweden and Western
Europe,”SIK-Report No. 654. Masters Thesis, Chalmers University of Technology, 166p.
[7] Kongshaug, G, 1998, “Energy Consumption and Greenhouse Gas Emissions in Fertilizer Production,” Presented at IFA Technical Conference, International Fertilizer Industry Association, 19p.
[8] Wood, S., and A. Cowie, 2004, “A Review of Greenhouse Gas Emission Factors for Fertiliser Production,” Prepared for IEA Bioenergy Task
38, 20p.
[9] Mittal, M. L., C. Sharma, and R. Singh, 2012,
”Estimates of Emissions from Coal Fired Thermal Power Plants in India,” Accessed December 12th, 2012. http:
IJSER © 2014 http://www.ijser.org
International Journal of Scientific & Engineering Research, Volume 5, Issue 2, February-2014 729
ISSN 2229-5518
//www.epa.gov/ttnchie1/conference/ei20/session
5/mmittal.pdf. 22p.
[10] Defra, 2011, “2011 Guidelines to Defra / DECC's GHG Conversion Factors for Company Reporting,” Produced by AEA for the Department of Energy and Climate Change (DECC) and the Department for Environment, Food and Rural Affairs (Defra), 50p.
[11] Swamy, M., and S. Bhattacharya, 2006,
“Budgeting Anthropogenic Greenhouse Gas Emission from Indian Livestock Using Country- Specific Emission Coefficients,” Current Science
91 (10): 1340-1353.
[12] Pathak, H, 1999, “Emissions of nitrous oxide from soil,” Current Science 77 (3): 359-369
[13] Stahl,R., E. Henrich, H.J. Gehrmann, S. Vodegel, and M. Koch, 2004, “Definition of a standard biomass,” Report prepared under the framework of project: RENEW – Renewable fuels for advanced power trains, 14p.
[14] Matsuo, N., and T. Mochizuki, 2009, “Genotypic
Differences in Root Traits of Rice (Oryza Sativa
L.) Seedlings Grown Under Different Soil
Environments,” Plant root 3: 17-25.
[15] Rusydi, M., C. W. Noraliza, A. Azrina, and A.
Zulkhairi, 2011, “Nutritional changes in
germinated legumes and rice varieties,”
International Food Research Journal 18: 705-713.
[16] World Bank, 2012, “Carbon Sequestration in Agricultural Soils,” Report No: 67385-GLB, World Bank & Agriculture and Rural Development. Washington DC, USA, 118p.
[17] Lal, R, 2004, “Soil Carbon sequestration to mitigate climate change,” Geoderma 123: 1-22.
[18] Suryavanshi, P., Y. V. Singh, R. Prasanna, A.
Bhatia, and Y. S. Shivay, 2013, “Pattern of
methane emission and water productivity under different methods of rice crop establishment,” Paddy and Water Environment 11: 321-329.
[19] Buresh, R. J., and C. Watt, 2008, “Balancing Fertilizer Use and Profit in Asia’s Irrigated Rice Systems,” Better Crops 92 (8): 18-22.
IJSER © 2014 http://www.ijser.org