Samples were analyzed in the laboratories of the Faculty of Earth Sciences, Saudi Arabia. The accuracy of this ana- lytical technique was controlled using appropriate stan- dards. Statistical summary including the mean, standard
International Journal of Scientific & Engineering Research Volume 2, Issue 9, September-2011 1
ISSN 2229-5518
Assessing of Groundwater Contamination by Toxic Elements through Multivariate Statistics and Spatial Interpolation, Wadi Fatimah, Western Arabian Shield, Saudi Arabia
Mohammed Amin M. Sharaf, Ali M. Subyani
same geological formation. Factor analysis revealed that the first three factors account for 85% of the total variance. Factor 1 revealed high loading of Al, Li, B and Cd, suggested interaction between water and geological formation. The second factor represented high loading of As, Pb and Hg, suggested human and agricultural activities. Factor three represented high loading of Si and Fe, which may be resulted from water/weather rock interactions.
—————————— ——————————
N arid regions, groundwater is the main source of wa- ter uses, and it is subject to contamination due to long time of aridity, human and agricultural activities. The trace element composition of groundwater depends on many natural factors such as the lithology of the aquifer, the quality of recharge waters and the types of interaction between water and aquifer and also on human activities, which can alter these fragile groundwater systems, either by polluting them or by changing the hydrological cycle [1]. In recent years, with the increasing number of chemi- cal and physical variables of water quality, there is a growing need for study and analysis of the groundwater chemistry variables. Multivariate statistical analysis is more rapid and cheap alternative method for assessment
of water quality variables.
Multivariate statistical methods have been devised for proper analysis and interpretation of the water quality data [2], [3]. [4]. [5] used principal component analysis for identifying the chemical processes of groundwater quali- ty in southwest of Saudi Arabia. [6] Characterized the
————————————————
1 Mohammed Amin M. Sharaf Faculty of Earth Sciences, King Abdula- ziz University, Head of Technical Training Department, P.O. BOX 80206, Jeddah, 21589, Saudi Arabia, E-mail: masharaf40@hotmail.com
chemical facies of groundwater of Niger delta using fac- tor analysis. [7] is also using factor analysis for identify the hydrochemical processes of groundwater in Wadi Na’man, western Saudi Arabia.
Groundwater contamination by toxic elements is signifi- cant problem especially in arid regions. Groundwater quality is subject of atmosphere, biosphere and lithos- phere interactions and also by agriculture and human activities. The magnitude of hazards in groundwater de- pends on chemical composition, concentration of toxic elements and the water bearing formation and water pH.
Because of the groundwater is the main source of water in arid regions, the best planning of water resources man- agement is to define water quality from the areal distribu- tion and the generic aspects, in order to establish as far as possible the qualitative effects of the natural and human influence factors on the water quality. Hence, any fall off in groundwater quality may result in a big reduction in the percentage of resources that can be utilized or may create series problems for water users [8], [9].
Wadi Fatimah is shallow alluvial and fracture bedrock aquifer in western part of Saudi Arabia, and considered as one of the major source of water supplies in the area. Because of the rapid growth of population, long time of aridity and intensive exploitation of groundwater re- sources from this wadi has led to concern about potential
IJSER © 2011
International Journal of Scientific & Engineering Research Volume 2, Issue 9, September-2011 2
ISSN 2229-5518
water quality impacts. [10] studied the nitrate concentra- tion in the upper reaches of Wadi Fatimah. His study shows that the nitrate concentration in the groundwater exceeded the maximum contaminant level due to the ef- fects of cesspool system in the upper reach of the basin.
The main objectives of this study are to assess the level of groundwater contamination in respect the toxic elements. To determine the degree of associations between the dif- ferent toxic elements and their areal distribution, and to identify the possible natural and anthropogenic sources of contamination in shallow alluvial aquifer of Wadi Fa- timah, western Saudi Arabia.
The study area is located in the west central part of Saudi Arabia (Fig. 1). It is occupied by Precambrian Arabian Shield igneous and metamorphic rocks with less frequent sedimentary rocks (Fig. 2). The exposed rock units of W. Ash Shumaysi-W. Fatimah area are classified by [11] into metamorphic, igneous and sedimentary rocks. According to the geologic map of [12], the rock units of the study area (Fig. 2) are subdivided into: i) Intrusive complexes as Makkah suite, Hashfate complex, Kamil suite and Ru- mayda Granite; ii) Layered metamorphic rocks of green schist- amphibolite facies of Jeddah/ Zibara group; and iii) The Cenozoic rocks which are represented mainly by the siliciclastic succession of Ash Shumaysi Formation.
The sedimentary rocks overlie nonconformably the crystalline rocks, mostly grano-diorite granite- granodiorite and diorite, granodiorite and red metasedimentary series (Fatimah Series). These rocks are represented by the Oligo-Miocene succession of Ash Shumaysi Formation and the Quaternary wadi sediments. Ash Shumaysi Formation is a clastic sedimentary succession forming brown intermittent hills preserved within faulted-down areas along the flanks of W. Ash Shumaysi and W. Fatimah and resting nonconformably on the crystalline rocks (Fig. 2). Ash Shumaysi Formation consists of conglomerates, sandstone, mudstone and carbonate-bearing succession just overlying the Precambrian Arabian shield rocks and the underlying the Oligo-Miocene volcanics (Harrate). The Quaternary deposits: which are represented by unconsolidated deposits occur widely toward the headwaters of the major tributaries. Terraces of alluvial gravel also cover large areas of the coastal plain. They are consisting of well rounded pebble to boulder size fragments and conglomerate.
Wadi Fatimah basin comprises the most important drai- nage system in the western province of Saudi Arabia (Fig.
3). It considered the major important sources of ground-
water to the cities of Makkah, Jeddah and the surround- ing villages and towns. The Red Sea escarpment (Hijaz Highlands) and Harrat Rahat are considered the recharge areas of these basins. Generally, the main course of the basin follow westerly to southwesterly directions towards the Red Sea coast. The drainage of the basins generally is well developed and the pattern is typically dendritic (Fig.
3). Although the local relief generally less than 400 meters above the wadi floor, the wadi networks have many small and large tributaries. They are deep and narrow and their longitudinal profiles are rather gentle and in some areas become irregular. They almost follow N-S, NW-SE and SE-NW directions, which probably controlled by major structures, and smaller faults that commonly control less- er drainage channels. The upper stream parts of the basin is rather narrow, where the width of the main wadi course vary from less than 100 m to more than 1.5 km further downstream, where the alluvium deposits are widespread and rather thicker.
.
The mountainous region comprises mostly folded and faulted Precambrian rocks (Hijaz Highlands) and Tertiary lave flows (Harrat Rahat). These are present along the northwestern and southeastern flanks of wadi Fatimah. They form a longitudinal block that extends from the northeast to the southwest (Fig. 1). However, this block is interrupted by several wadi courses i.e. wadi Dafin and wadi Al Sheib. The mountainous areas are highly fragmented into a relatively small isolated outcrop. It rises between 400 and 1960 meter above sea level. However, in the vicinity of the Hijaz Highlands, isolated summits over 600 m are observed. Steep-sided wadis in wadi Fatimah dissect the upland region, many of which reflect the faulting that has taken place throughout the area such as Al Yammaniyyah and Al Shamiyah sub- basins.
The pediments bound the mountainous from the west and are marked by their elongated features, which trend in a westerly direction and sometimes appear as small knobs. The pediments are marked by thin layer of alluvial and aeolian sediments resting on highly weathered surface of Precambrian rocks.
The coastal plain is the most westerly morphological unit, and it is quite different from the previous two. It has a width ranging from 5 km to more than 25 km. The predominant features are the recent alluvial plains built from sediments transported and laid down by the waters of the main wadis which run rapidly through mountainous and pediment regions. These deposits are widespread and relatively thicker. The dominant surface forms here are huge, gently sloping alluvial fans, aeolian deposits, and less extensive talus deposits at the base of the ridges. The alluvial deposits consist essentially of fine gravel, sand, silt and in some areas clay is observed.
IJSER © 2011
International Journal of Scientific & Engineering Research Volume 2, Issue 9, September-2011 3
ISSN 2229-5518
The Precambrian layered rocks were intensively folded and faulted, while the plutonic rocks appear less
Samples were analyzed in the laboratories of the Faculty of Earth Sciences, Saudi Arabia. The accuracy of this ana- lytical technique was controlled using appropriate stan- dards. Statistical summary including the mean, standard
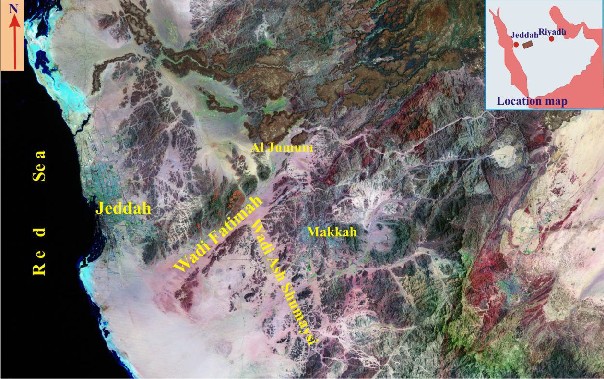
Fig. (1): Satellite image of wadi Fatimah area.
deformed. The Tertiary sedimentary rocks were faulted but not folded. The volcanic rocks of the Harrat Rahat are essentially undeformed. There are three main fracture sets, these are (i) north-northeasterly faults; (ii) east- northwesterly faults; and (iii) southeast trending faults of the Red Sea fracture system.
A total of 80 water samples were obtained from shallow wells (<70 m) that tap the unconfined alluvial/fracture aquifer of Wadi Fatimah. These representative groundwa- ter samples were collected from different tributaries in the Wadi catchments area to preserve the uniform distri- bution of sampling sites over the study area. The sam- pling locations of the study are shown in Fig. 4 [8]. Groundwater samples of the main stream were taken from the alluvial and fracture aquifer in winter, 2004. Trace elements were analyzed in each sample for a total of 17 water quality descriptors (variables), these elements are: As, Zn, P, Pb, Ba, B, Si, Al, Li, Cu, Fe, Hg, Mn, Cd, V, and Rb. Among these, only pH was measured in the field.
deviation, coefficient of variation, and skewness of trace elements are shown in Table 1.
Cluster analysis is the name given to an assortment of techniques designed to perform classification by assign- ing observation to group so each is more or less homoge- neous and distinct from other groups [13]. So there are two types of cluster analysis: R and Q-modes. In this study, R-mode and Q-mode were used such that R-mode depicts relationships between variables, while Q-mode identified relationships between samples [14], [15]. So the hydrochemical results of all samples were statistically analyzed. Generally, prior to cluster analysis data were normalized, the weight per group method was applied in Euclidean distance.
Factor analysis is a multivariate statistical technique that can be utilized to examine the underlying patterns or rela- tionships for a large number of variables and summarize information in a smaller set of factors or components for
IJSER © 2011
International Journal of Scientific & Engineering Research Volume 2, Issue 9, September-2011 4
ISSN 2229-5518
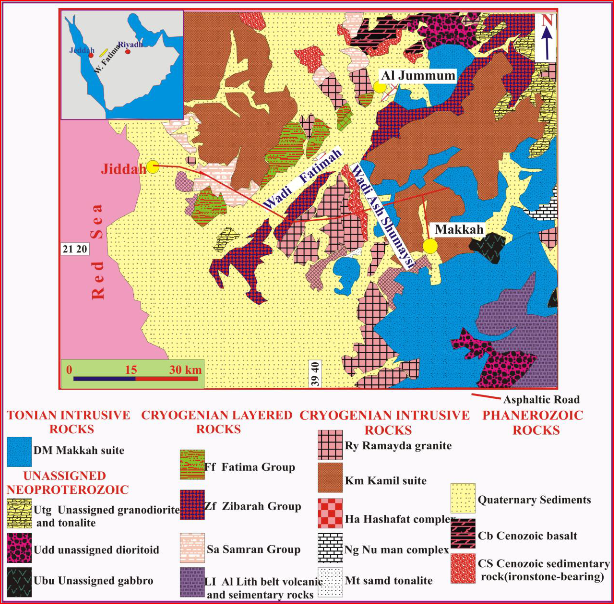
Fig. (2): Geologic map of Makkah district including wadi Fatimah area [12].
IJSER © 2011
International Journal of Scientific & Engineering Research Volume 2, Issue 9, September-2011 5
ISSN 2229-5518
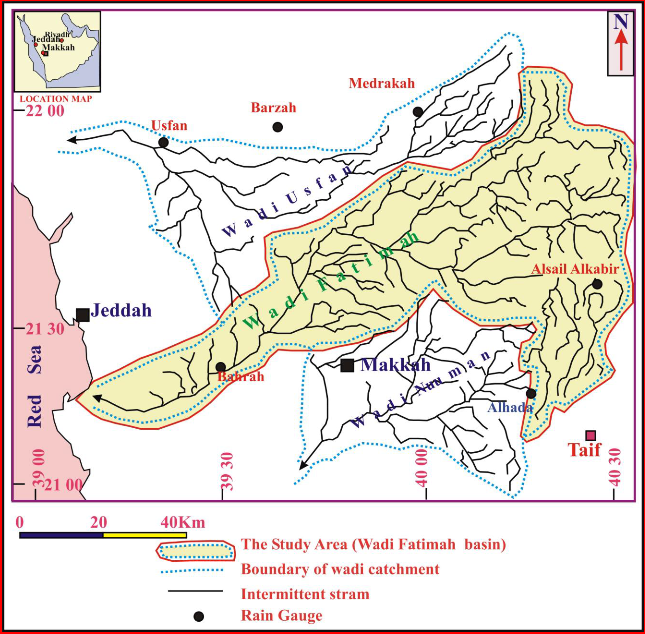
Fig. (3): Drainage basin map of wadi Fatimah
IJSER © 2011
International Journal of Scientific & Engineering Research Volume 2, Issue 9, September-2011 6
ISSN 2229-5518
Max | Min | Mean | St.Dev. | Skew | Co.Var. | |
As | 0.09 | 0.00026 | 0.015 | 0.023 | 1.98 | 1.55 |
Zn | 0.36 | 0.0001 | 0.044 | 0.069 | 3.32 | 1.59 |
P | 4.16 | 0.046 | 0.626 | 0.540 | 3.35 | 0.86 |
Pb | 0.07 | 0.001 | 0.020 | 0.020 | 1.41 | 1.00 |
Ba | 0.56 | 0.037 | 0.208 | 0.088 | 0.64 | 0.42 |
B | 8.54 | 0.372 | 1.612 | 1.390 | 2.45 | 0.86 |
Si | 25.06 | 4.89 | 9.832 | 3.004 | 2.07 | 0.31 |
Al | 0.90 | 0.00256 | 0.062 | 0.152 | 3.25 | 2.46 |
Li | 0.60 | 0.002 | 0.089 | 0.145 | 2.35 | 1.62 |
Cu | 0.06 | 0.0013 | 0.021 | 0.012 | 0.64 | 0.58 |
Fe | 0.32 | 0.005 | 0.032 | 0.054 | 4.42 | 1.68 |
Hg | 0.17 | 0 | 0.018 | 0.038 | 3.05 | 2.10 |
Mn | 0.28 | 0.001 | 0.020 | 0.037 | 5.10 | 1.84 |
Cd | 0.02 | 0.0001 | 0.004 | 0.004 | 1.71 | 1.06 |
V | 0.70 | 0.00213 | 0.213 | 0.196 | 0.19 | 0.92 |
Rb | 0.16 | 0.0046 | 0.097 | 0.055 | -0.42 | 0.57 |
Ph | 7.90 | 7.1 | 7.487 | 0.205 | 0.36 | 0.03 |
Table (1): Statistical summary for trace elements (mg/l).
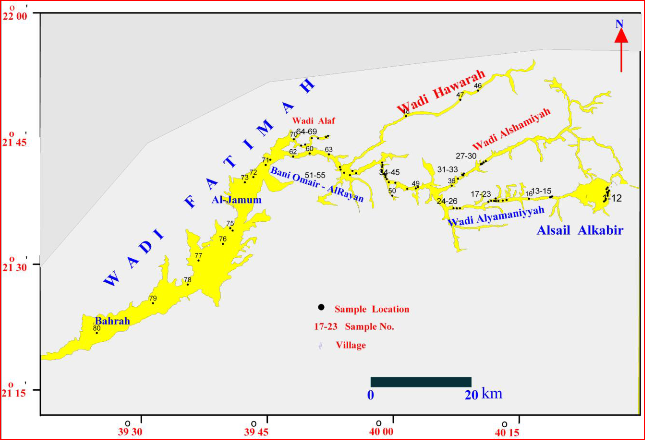
Fig. 4. Location map of groundwater samples.
IJSER © 2011
International Journal of Scientific & Engineering Research Volume 2, Issue 9, September-2011 7
ISSN 2229-5518
As | Zn | P | Pb | Ba | B | Si | Al | Li | Cu | Fe | Hg | Mn | Cd | V | Rb | |
Zn | 0.07 | |||||||||||||||
P | 0.38 | -0.10 | ||||||||||||||
Pb | 0.74 | 0.06 | 0.37 | |||||||||||||
Ba | 0.31 | 0.04 | 0.36 | 0.37 | ||||||||||||
B | 0.28 | -0.05 | 0.68 | 0.19 | 0.37 | |||||||||||
Si | -0.01 | 0.08 | 0.40 | -0.00 | 0.15 | 0.25 | ||||||||||
Al | 0.54 | 0.05 | 0.41 | 0.27 | 0.28 | 0.76 | 0.13 | |||||||||
Li | 0.35 | 0.05 | 0.45 | 0.28 | 0.27 | 0.76 | 0.12 | 0.84 | ||||||||
Cu | 0.18 | -0.05 | 0.73 | 0.16 | 0.35 | 0.57 | 0.24 | 0.36 | 0.46 | |||||||
Fe | 0.18 | 0.11 | 0.45 | 0.14 | 0.15 | 0.40 | 0.38 | 0.38 | 0.42 | 0.27 | ||||||
Hg | 0.66 | 0.02 | 0.27 | 0.56 | 0.11 | -0.05 | -0.04 | 0.00 | -0.06 | 0.11 | -0.07 | |||||
Mn | -0.06 | -0.08 | 0.34 | -0.00 | 0.08 | 0.16 | 0.35 | 0.07 | 0.15 | 0.26 | 0.34 | -0.14 | ||||
Cd | 0.64 | 0.12 | 0.38 | 0.54 | 0.49 | 0.48 | 0.05 | 0.61 | 0.56 | 0.22 | 0.27 | 0.16 | -0.04 | |||
V | 0.10 | -0.15 | 0.56 | 0.16 | 0.24 | 0.55 | 0.04 | 0.39 | 0.56 | 0.60 | 0.32 | -0.25 | 0.38 | 0.29 | ||
Rb | 0.49 | 0.04 | 0.45 | 0.44 | 0.23 | 0.07 | 0.12 | 0.14 | 0.20 | 0.31 | 0.07 | 0.34 | 0.20 | 0.35 | 0.38 | |
Ph | 0.12 | -0.16 | 0.07 | 0.02 | 0.08 | 0.07 | 0.07 | 0.07 | 0.02 | 0.08 | -0.03 | 0.01 | -0.01 | 0.15 | 0.09 | 0.17 |
Table 2. Pearson correlation matrix for trace elements (Bold number significant with 95% confidence level).
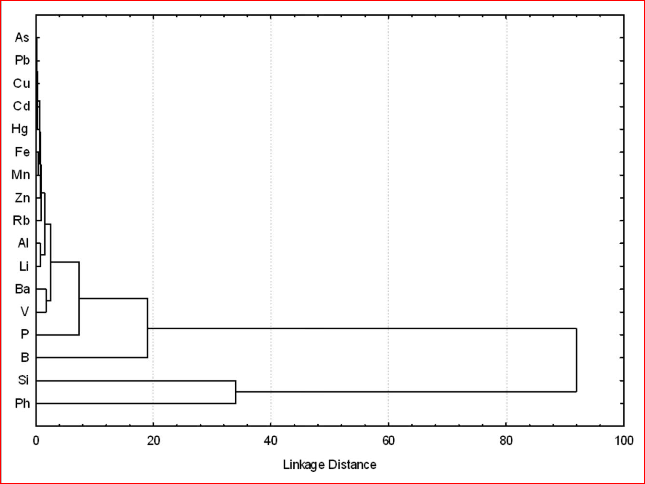
Figure 5. Dendogram for 17 variables from cluster analysis in R-mode
IJSER © 2011
International Journal of Scientific & Engineering Research Volume 2, Issue 9, September-2011 8
ISSN 2229-5518
prediction purposes [14]. Principle component analysis (PCA) is the most frequently employed factor analytic approach. PCA defined as an orthogonal linear transfor- mation that transforms the variables to a new coordinate system such that the greatest variance by any projection of the variables comes to lie on the first coordinate (called the first principal component), the second greatest va- riance on the second coordinate, and so on. PCA is theo- retically the optimum transform for a given data in least square terms [3], [16], [17], [15]. To determine the number of components to extract, data obtained from laboratory and field analysis were used as variable inputs. Prior to the analysis, the data were standardized to produce a normal distribution of all variables [18], [14]. The weights of the original variables in each factor are called loadings; each factor is associated with a particular variable. Com- munality is a measure of how well the variance of the variable is described by a particular set of factors [19].
The Pearson correlation coefficients for 17 pairs of va- riables were computed and presented in Table 2. Some of these elements are medium to high positive correlated to each other, for example, Arsenic (As) is highly correlated with Lead (Pb), Aluminum (Al), Mercury (Hg) and Cad- mium (Cd). On the other hand, Zinc (Zn) is totally uncor- related with other elements.
The analytical results of multivariate analysis were per- formed for the set of 80 samples and 17 variables. Figure 5 shows the R-mode cluster analysis dendogram of the 17 descriptors. The variables cluster into three major groups. From this dendogram one can find the relationship be- tween different variables, the dendogram shows a high correlation between major ions (As, Pb, Cu, Cd, Hg), which indicated surface water recharge and releasing during the dissolution of the plutonic acidic and interme- diate igneous rocks of the study area. Other group of phosphorous (P) and Boron are highly associated with each other indicated anthropogenic origin. The third clus- ter shows the strong association between silica and Ph values.
Figure 6 shows the clustering of the basins in Q-mode according the similarity. Three main groups can be veri- fied in this figure. The first cluster shows a high similarity between the wells in the same geological formation of Wadi Alyamaniyyah and Wadi Alshamiyyah (see Fig. 1). The second cluster belong of Wadi Hawarah which origi- nated from Basaltic formation. Third group belongs the main stream of Wadi Fatimah.
Factor analysis was also performed for this study. Figure
7 shows the scree plot with the successive eigenvalues in
a simple line plot. The first three common factors
represent 85% of the total variance. Table 3 shows the R- mode analysis according to the loading of each variable on each factor and the percentage of the total variance accounted for by each factor in the rotated three factors model. The first rotated factor, representing 37% of the total variance, revealed high loading of Al, Li, B and Cd. These elements are most likely derived from water inte- raction with the acidic and intermediate igneous rocks. It is associated with aluminum forms during mineral wea- thering of an igneous rock composed primarily of alkali feldspar together with other minerals, such as orthoclase, anorthite, albite, and micas and the interaction of groundwater in the gabbroic and synite rocks composi- tion in addition to aluminum silicate minerals weathering from underlying geology.
The second component accounts for about 30% of the to- tal variance with high loading of As, Pb and Hg, suggest- ing the effect of human and agricultural activities. The third factor contribute only 18 % of the total variance with high loading of Si and Fe. Other elements produced very low loading.
The distribution of samples with respect to the relation- ship between factor 1 and factor 2 is shown in Fig. 8. Most of the samples can be categorized into the three group, group A generally yielding positive values for factors 1 and 2. These samples were obtained from mixed waters located in the main stream. Group B contains most of samples around zero values for factors 1 and 2. Group C of six samples (wells 16-21) showed the highest positive scores with factor 2 and negative scores with factor 1. These samples were mainly located in high agricultural activities area. Figure 9 shows a plot of factor 1 versus factor 3, where 2 main groups are present in this figure. Group A represent samples of main stream of Wadi Fati- mah, where group B represent the uperstream tributaries. In this figure, sample 12 has the highest values of concen- tration in all elements, where sample 53 has high value of Mn, These outlier samples were most likely subjected to poor well design and anthropogenic pollution [20].
The analysed trace elements of wadi Fatimah show the following distribution:
Aluminum (Al): In the study area, the average Al content is 0.062mg/l which is very low when compared with WHO guideline of Al (0.2 mg/l, Table 4). The concentra- tion of Al will depend on the availability and extent of weathering of the aluminosilicates such as clays, pyro- phyllites, feldspars, micas and other related minerals. High concentration of Al in soils and groundwater may also be attributed to a number of factors including the availability of dissolved organic matter and fluoride [21].
IJSER © 2011
International Journal of Scientific & Engineering Research Volume 2, Issue 9, September-2011 9
ISSN 2229-5518
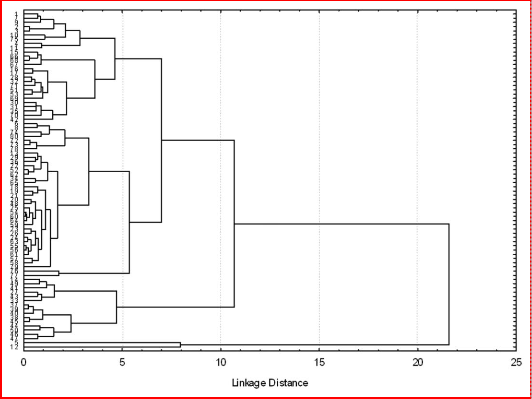
Figure 6. Dendogram for 80 samples from cluster analysis in Q-mode.
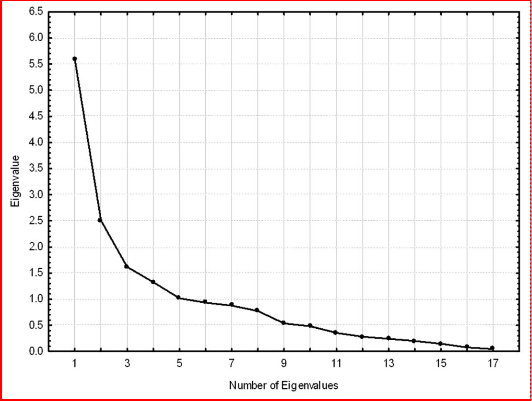
Figure 7. Plot of eigenvalue
IJSER © 2011
International Journal of Scientific & Engineering Research Volume 2, Issue 9, September-2011 10
ISSN 2229-5518
Variable | Factor1 | Factor 2 | Factor 3 | Cummunality |
As | 0.404446 | 0.830360 | -0.036590 | 0.859210 |
Zn | 0.143215 | 0.103864 | 0.339659 | 0.070604 |
P | 0.347238 | 0.382198 | 0.391420 | 0.803943 |
Pb | 0.249316 | 0.818113 | -0.017190 | 0.721089 |
Ba | 0.381428 | 0.332230 | 0.164360 | 0.300041 |
B | 0.798648 | 0.004145 | 0.169554 | 0.802692 |
Si | 0.035957 | 0.004841 | 0.855788 | 0.322952 |
Al | 0.903019 | 0.120607 | 0.056186 | 0.837442 |
Li | 0.867216 | 0.048121 | 0.069275 | 0.825639 |
Cu | 0.325809 | 0.163486 | 0.209751 | 0.596453 |
Fe | 0.415245 | 0.002976 | 0.615893 | 0.373123 |
Hg | -0.152917 | 0.849526 | -0.062784 | 0.726998 |
Mn | -0.070497 | -0.070475 | 0.552626 | 0.536709 |
Cd | 0.709243 | 0.460103 | 0.030187 | 0.710235 |
V | 0.433710 | -0.039227 | 0.044310 | 0.599400 |
Rb | -0.004711 | 0.640180 | 0.130249 | 0.583430 |
Ph | 0.061282 | 0.047950 | 0.037435 | 0.040608 |
Expl.Var % | 37 | 30 | 18 |
Table 3. Vraiamax loading matrix.
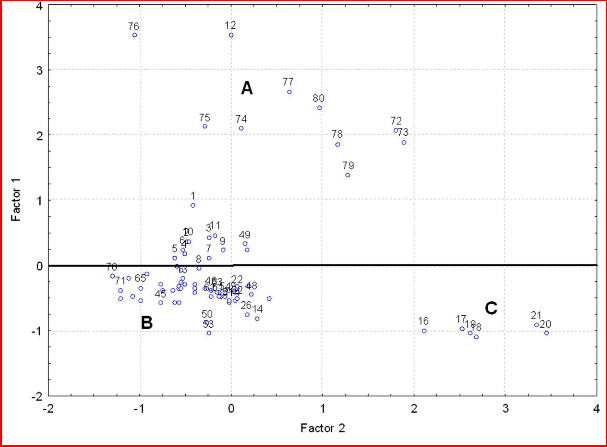
Figure 8. Plot factor 1 versus factor 2
IJSER © 2011
International Journal of Scientific & Engineering Research Volume 2, Issue 9, September-2011 11
ISSN 2229-5518
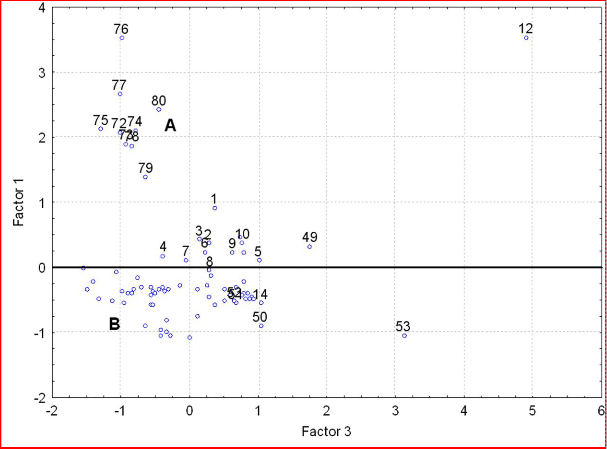
Figure 9. Plot factor 1 versus factor 3 scores
Arsenic (As): which is the most important element affect- ing the groundwater quality. The average value of arsenic is 0.015 mg/l which similar to that recommended by the WHO (Table 4).
Barium (Ba): The average barium content of wadi Fatimah area is 0.208mg/l which is similar to the WHO (0.3 mg/l).
Boron (B): The maximum value of boron is 8.54 mg/l while its minimum value is 0.372 and the average is
1.6126mg/l which is higher than that recorded in the normal groundwater (Table 4) and also higher than the [22] recommended values (0.3 mg/l). The toxic effect for B in humans is found to occur above 20 mg /l-1 [23]. Boron usually occurs as a nonionized form as H3BO3 in soils at pH less than 8.5, but above this pH, it exists as an anion, B(OH)4 -1 [24]. It is very soluble in soils and can be leached especially in sandy soils [25]. It is also dispersed in the environment through fertilizer application. Since the pH was less than 8.5 for all the samples, it is more likely that B would be in the nonionized than the ionized state.
Cadmium (Cd): The cadmium in wadi Fatimah groundwa- ter is higher than that recommended by the WHO guide- line. The average of Cd is 0.004 mg/l. Cadmium is used normally as a coating material, paint pigment, in plastics, fungicide and is a constituent of some fertilizers. Copper, Cd and Zn exist in aqueous form in the predominately + 2 state. Generally, Zn exists as Zn2+ state in pH below 7.7 (Liptrot, 1989). Cadmium (II) oxide occurs in some Zn ores which suggests that the two have identical properties such as that both have the + 2 being the most stable oxida- tion state (Liptrot, 1989).In natural waters, Cu, Cd and Zn occur in the 2+ form.
Cupper (Cu): The average cupper content of wadi Fatimah is 0.021 mg/l which is very low when compared with that of WHO (2 mg/l).
Iron (Fe): The average Fe content is 0.032 mg/l which is lower than the recommended WHO iron level (<
0.3mg/l). Iron dissolved in groundwater is in the reduced ferrous iron form. This form is soluble and normally does not cause any problems by itself. Ferrous iron is oxidized into ferric iron on contact with oxygen in the air or by the action of iron related bacteria. Ferric iron forms insoluble
IJSER © 2011
International Journal of Scientific & Engineering Research Volume 2, Issue 9, September-2011 12
ISSN 2229-5518
Symbol/ formula | Normally found in fresh water/surface water/ground water | Health based guideline by the WHO | Wadi Fatimah Groundwater (Present study) |
Al | 0,2 mg/l | 0.062 | |
As | 0,01 mg/l | 0.015 | |
Ba | 0,3 mg/l | 0.208 | |
B | < 1 mg/l | 0,3 mg/l | 1.612 |
Cd | < 1 μg/l | 0,003 mg/l | 0.004 |
Cu | 2mg/l | 2 mg/l | 0.021 |
Fe | 0,5 - 50 mg/l | 0.3 mg/l | 0.032 |
Pb | 0,01 mg/l | 0.020 | |
Mn | 0,5 mg/l | 0.020 | |
Hg | < 0,5 μg/l | 0,001 mg/l | 0.018 |
Zn | 3 mg/l | 0.044 | |
Li | 0.089 | ||
Rb | 0.097 | ||
V | 0.213 |
Table (4): The average values of the trace elements of wadi Fatimah compared with those of the [22] guideline.
hydroxides in water. These are rusty red and cause stain- ing and blockage of screens, pumps, pipes, reticulation systems etc. If the iron hydroxide deposits are produced by iron bacteria then they are also sticky and the prob- lems of stain and blockage are many times worse.
Lead (Pb): Lead (average 0.001 mg/l, Table 1) and it is rel- atively higher than the WHO (0.01, Table 4). Lead on the other hand is used in automobile industries in form of tetramethyllead.
Manganese (Mn): which is present in wadi Fatimah by very low content (average 0.020 mg/l) and it is relatively lower than the WHO (0.01, Table 4).
Mercury (Hg): Hg which is important for the water quality. The average Hg in wadi Fatimah area is 0.018mg/l (Table
3) which is relatively higher than the WHO values (Table
4).
Zinc (Zn): The average Zn content of wadi Fatimah basin is 0.044 mg/l which is lower than that recommended by WHO guideline (3 mg/l). Zinc is used as an anticorrosion agent where it is coated on iron pipelines to protect them against corrosion. During the construction of the bore- holes galvanised pipelines were used. Corrosion of pump parts could also lead to Zn being released into the groundwater.
Lithium (Li): The average Li content of wadi Fatimah
groundwater is 0.089 mg/l. Li may be derived from gra- nite rocks where minerals rich in Li could be found.
Rabidium (Rb): The average Rb content of wadi Fatimah ground water is 0.097mg/l
Vanadium (V): The average V content of wadi Fatimah ground water is 0.213mg/l.
Oxidation and dissolution rocks of gabbroic composition will contribute trace elements such as, Cu, Zn, Li, Cd, V and Mn. The source of these trace elements will be asso- ciated with the major cations such as Ca2+, Mg2+, Fe, Na+, Al and Si which are considered the major cations in the rocks of gabbroic composition. Whereas, in the weather- ing granitic rocks will contribute trace elements of Cu, Ba, Rb, Pb and As, These elements will be associated with the major ions such as Na+, K+, Al and Si.
The distribution of trace elements in groundwater is mainly controlled by different processes. The groundwa- ter has a large range of chemical composition [27], [28], [29]. The trace element composition of groundwater de- pends not only on natural factors such as the lithology of the aquifer, the quality of recharge waters and the types of interaction between water and aquifer, but also on hu-
IJSER © 2011
International Journal of Scientific & Engineering Research Volume 2, Issue 9, September-2011 13
ISSN 2229-5518
man activities, which can alter these fragile groundwater systems, either by polluting them or by changing the hy- drological cycle [1].
[1] Helena B, Pardo B, Vega M, Barrado E, Fernandez JM, Fernandez L (2000) Temporal evolution of groundwa- ter composition in an alluvial aquifer (Pisuerga River, Spain) by principal component analysis. Water Re- search 34 (3), 807-816.
[2] Ashley RP, Lloyd JW (1978) An example of the uses of factor analysis and cluster analysis in groundwater chemistry interpretation. J Hydrol 39:355–364.
[3] Usunoff EJ, Guzman A (1989) Multivariate analysis in hydrochemistry: an example of the use of factor and correspondence analyses. Ground Water 27:27–34.
[4] Sánchez-Martos F, Jiménez-Espinosa R, Pulido-Bosch A (2001) Mapping groundwater quality variables us- ing PCA and geostatistics: a case study of Bajo Anda- rax, southeastern Spain. Hydrol Sci J 46:227–242.
[5] Alyamani, M. and Atkinson T. (1993) Identification of Chemical Processes Using Principal Component Analysis. J. KAU:FES. 6:135-146.
[6] Olobaniyi SE, Owoyemi FB (2006) Characterization by factor analysis of the chemical facies of groundwater in the Deltaic Plain Sands aquifer of Warri, Western Niger Delta. UNESCO/ African journal of Science and Technology: Science and Engineering Series 7(1):73–
81.
[7] Subyani, A. (2010) Identifying the hydrochemical processes of groundwater in Wadi Na’man, Western Saudi Arabia using factor analysis. Arab. Jour. Geos- ciences. DOI 10.1007/s12517-010-0207.
[8] Sharaf MA, Alyamani MS, Subyani AM (2005) Region- al study of the rare and trace elements in the ground- water of the major wadi basins (An Numan, Usfan, and Fatimahh) in western Saudi Arabia and their sui- tability for various purposes. Project No. (204/423). King Abdulaziz University, Jeddah, Saudi Arabia.
[9] El Alfy M. (2010) Integrated geostatistics and GIS
techniques for assessing groundwater contamination in Al Arish area, Sinai, Eygpt. Arab. Jour. Geosciences. DOI 10.1007/s12517-010-0153-y.
[10] Alyamani, M. (2007) Effects of cesspool system on groundwater quality of shallow bedrock aquifers in the recharge area of Wadi Fatimah, Western Arabian Shield, Saudi Arabia. J. Env. Hydrology, vol. 15, paper
8.
[11] Al Shanti, A. M. (1966): Oolitic iron ore in Wadi Fa- tima, between Jeddah and Mecca. Directorate General of Mineral Resources Bulletin, 2, 51p.
[12] Johnson, P. R. (2006) ―Proterozoic geology of western
Saudi Arabia, west-central sheet‖: Amended May
2005: Saudi Geological Survey Open-File Report SGS- OF-2005-6, 59 p.
[13] Hussain M, Ahmed SM, Abderrahman W (2008) Cluster analysis and quality assessment of logged wa- ter at an irrigation project, eastern Saudi Arabia. J En- viron Manage 86:297–307.
[14] Davis JC (2002) Statistics and data analysis in geolo- gy. Wiley, New York.
[15] Tabachnick, B. and Fidell, L. (2006) Using Multiva- riate Statistics (5th Ed.). Allyn & Bacon, NY.
[16] Brown, C. (1998) Applied Multivariate Statistics in
Geohydrology and Related Sciences. Spinger, Berlin.
[17] Ceron, J.C., Pulido-Bosch, A. and Bakalwicz, M. (1999) Application of principal components analysis to the study of CO2- rich thermo mineral waters in the aquifer system of Alto Guadalentín (Spain). Hy- drological Sciences, 44(6): 929-942.
[18] Jayakumar, R. and Siraz, L. (1997) Factor analysis. in Hydrogeochemistry of Coastal aquifer-a preliminary study. Environmental Geology, 31(3/4): 174-177.
[19] Grande, J.A., Borrego, J., Torre, M.L. and Sainz, A. (2003) Application of cluster analysis to the geoche- mistry zonation of the estuary waters in the tinto and odiel rivers (Huelva, Spain). Environmental Geochemistry and Health, 25: 233-246.
[20] Esteller MV, Andreu JM (2005) Anthropic effects on hydrochemical characteristics of the Valle de Toluca
IJSER © 2011
International Journal of Scientific & Engineering Research Volume 2, Issue 9, September-2011 14
ISSN 2229-5518
aquifer (central Mexico). Hydrogeology J. 13:378–
390.
[21] Edmunds. W. M., Kinniburgh, D. G. and Moss, P. D.:
1992, Trace Metals in Interstitial Waters from Sand- stones Acidic Inputs to Shallow Groundwater, Envi- ronmental Pollution, Elsevier Science Publishers Ltd, England. Edmunds, W. M. and Savage, D.: Geo- chemical Characteristics of Groundwater in Granites and Related Crystalline Rocks. (Unpublished).
[22] WHO (1993) Guidelines for Drinking Water Quality,
Geneva.
[23] Bolt, G. H. and Bruggenwert, M. G. M.: 1978, Soil Chemistry, Basic Elements, 2nd Edition, Elsevier Scientific Publishing Company Amsterdam. The Netherlands.
[24] Miller, R. W. and Donahue, R. L. 1995, Soils in Our
Environment, 7th Edition, PrenticeHall, Englewood
Cliffs, N. J.
[25] Brady, N. C.: 1974, Nature and properties of soils, 8th
EditionMacmillan Publishers Co., INC, NewYork. [26] Liptrot, G. F.: 1989, Modern Inorganic Chemistry 4th
Edit, Scoltprint Musselburgh.
[27] Hem JD (1970) Study and interpretation of the chemi- cal characteristics of natural waters. Geological Sur- vey Water-Supply Paper 1473.
[28] Drever J (1982) The Geochemistry of Natural Wa- ters. Prentice-Hall, Englewood Cliffs, NJ.
[29] Appelo CAJ, Postma D (1993) Geochemistry,
Groundwater and Pollution. Balkema, Rotterdam.
IJSER © 2011