1) Colony size (employed bees + onlooker bees) = 20
2) Foodsources = 10
3) Limit=100
4) Max iterations=200
International Journal of Scientific & Engineering Research, Volume 3, Issue 1, January-2012 1
ISSN 2229-5518
Artificial Bee Colony Optimisation for Economc
Load Dispatch of a Modern Power system
Ganga Reddy Tankasala
Abstract— This paper deals with optimization of fuel cost of coal fired generators of a modern power sytem. The conventional method of solving economic load dispatch (ELD) uses Newton Raphson, Gauss and Gauss Siedel techniques whose time of computation increases exponentially with the size. Inorder to overcome the dreawbacks of conventional methods, Artificial Intelligent (AI) techniques likes like Genetic Algorithm (GA), Nueral Networks (NN), Artificial Immune systems (AIS) and Fuzzy Logics etc… are used. One such AI technique used is Artificial Bee Colony optimization (ABC) inspired from the foraging behaviour of bees. The ABC is applied for ELD and compared with the other AI techniques. The results show that ABC promises global minimum of the solution while others may land in local minimum.
Index Terms— Artificial bee colony, Artificial intelligent techniques, Economic load dispatch, Genetic Algorithm, Power systems
1 INTRODUCTION
—————————— ——————————
rtificial Bee Colony optimization algorithms are formu- lated on the basis of natural foraging behaviour of honey bees. ABC was first developed by Dr.Korba. Some artifi-
cial ideas are added to construct a robust ABC .Very unlike to classical search and optimization methods ABC starts its search with a random set of solutions (Colony size), instead of single solution just like GA. Each population member is then evaluated for the given objective function and is assigned fit- ness.The best fits are entertained for next generation while the others are discarded and compensated by a new set of random solutions in each generation. The only stopping criterion is the completion of maximum no of cycles or generations. At the end of cycles the solutions with best fit is the desired solution.
Economic Load Dispatch (ELD) is one of the important opti- mization problems in modern Energy Management Systems (EMS). ELD determines the optimal real power settings of ge- nerating units in order to minimize total fuel cost of thermal plants. Various mathematical programming methods and op- timization techniques have previously been applied for solu- tion of ELD. These include Lambda iteration method, partici- pation factors method and gradient methods. ELD problems in practice are usually hard for traditional mathematical pro- gramming methodologies because of the equality and inequa- lity constraints.
ABC is applied for solution of ELD.A generating unit based encoding scheme is used, however when applied to large size systems, the number of maximum iterations or generations has to be increased proportinally.The solution time grows ap- proximately linearly with problem size rather than geometri- cally.
The objective of Economic Load Dispatch (ELD) for power system consisting of coal fired thermal generating units is to find the optimal combination of power generations that mini- mizes the total fuel cost for generation while satisfying the specified equality and inequality constraints. The fuel cost
function of the generator is modeled as a quadratic function of generator active powers (P). The minimization function ‘A’ can be obtained as sum of the fuel costs Fi of all the generating units.
Min A = ∑ Fi ∀ i ϵ (1, 2,3…, NG) (1)
Subjected to
∑ PGi = PD + Ploss ∀ i ϵ (1, 2,3…, NG) (2)
PGimin ≤ PGi ≤ PGimax ∀ i ϵ (1, 2, 3…, NG) (3)
The fuel cost of generating unit is given by
Fi = (ai + bi Pi + ciPi2 ) (4)
Where ai, bi, ci are cost coefficients of generating unit i, Pi or PGi is real power generation of unit ‘i’. PD is the total demand and Ploss represents the transmission losses. PGimin and PGimax are
the minimum and maximum generation limits of ith unit.
This is a constrained optimization problem that may be solved using calculus methods that involve Legrange function. The necessary condition for the minimization of fuel cost is that the incremental cost rates of all the units be equal to some undetermined value Lambda (λ). Along with the above condi- tion, the equality constraint, the sum of the power outputs must be equal to the combined power demand and losses. If transmission system losses are neglected, the equality con- straint becomes, the sum of the power outputs must be equal to the total power demand by the load. Also, the power output of each unit must be with in its generation range.
Since always transmission losses are involved with a network, in order to achieve exact ELD, transmission system losses must be taken into account.Using B-coefficients method, the network losses are expressed as a quadratic function of unit generations as
Ploss =ΣΣPi Bij Pj ∀ i,j ∈ *1,2,3, … NG+ (5)
IJSER © 2012
International Journal of Scientific & Engineering Research, Volume 3, Issue 1, January-2012 2
ISSN 2229-5518
In (5) Bij are called as B-coefficients or loss coefficients which are constant under certain assumed conditions. The above loss formula is known as the George’s formula.
3 ARTIFICIAL BEE COLONY FORAGING BEHAVIOUR
To find the optimal decision variables, to optimize an objective function and to satisfy the constraints, the variables are bounded to the limits. Eqn. (6) gives a function defined to [1] take care of variable bounds.
Food sources which are in their proximity are selected by the employed bees when they move to a new location. Each em- ployed bee associated with a food source responsible for nec- tar extraction from it.
Pi = Pimin + rand (0, 1) × (Pimax - Pimin) (6)
∀ i,j ∈ [1,2,3, … NG]
Pimin and Pimax are lower and upper bounds of variable Pi. In (6)
‘rand (0, 1)’ represents a random number between 0 and 1.
∑ PGi = PD + ΣΣPi Bij Pj ∀ i ϵ (1, 2, 3…, NG) (7)
is represented as
X = [P1, P2, P3, P4, P5, …….. Png]
A random variable of all ng variables is chosen and a neighbour of all n-1 neighbours is chosen randomly and a mu- tant solution is produced as shown below.
X1mutant = X1 (i) + (Xj (i)- X1(i))* (2*rand – 1))
Where i,j are randomly chosen parameter and neighbour
respectively.
A greedy selection between the mutant and original solutions takes place resulting in the discard of least fit solution. This process of selection is repeated for each solution. The solution whose mutant is less fit increases its trial and may lead to dis- sertation of the food source if the trial leads a threshold limit.
The onlooker bees in the hive detect a food source by means of the information presented to them by the employed foragers. A food source is chosen with the probability which is proportional to its food quality. Different schemes can be used to calculate the probability values. For example
Probability (i) =Fitness (i)/sum (Fitness)
1) Probability (i) =a*Fitness(i)/max(Fitness)+b where ( a+b=1)
Inorder to satisfy the equality constraint, solve for slack bus
power (PG1) from the above quadrtic equation and replace it with the randomly choosen PG1.The solution is represented in matrix form as below
Xi = [P1 P2 P3 P4 P5 …….. Png] (8) Similarly the Foodsources [X1 X2 X3 X4 ……Xn] is the set of all
the randomly choosen solutions which satisfies all the defined
constraints.
The food sources are ranked bases on the quality and quantity of their nectar. Similarly Fitness is assigned to each solution, which represents the goodness of each solution.
Fitness (i) = 1/ (1+ ∑Fi) ∀ i ϵ (1, 2, 3…, NG) (9)
∑Fi from represents the total fuel cost of generation.
Each solution is handled by an employed bee and the em- ployed bee searches for the food source in their neighbour- hood and if a better food source is found it discards its previ- ous food source and starts exploiting the new food source un- til it explores a better food source.
Similarly a mutant solution is generated for each solu-
tion using its randomly selected neighbour and the parameter
to be changed.
[ X1 X2 X3 X4 …… Xn] is the solution set where each solution X
A random number is chosen which represents the expec- tancy of the onlooker bee is compared with probability of a solution (food) if the solution meets the expectancy of the onlooker then it moves to exploit the food source and becomes an employed bee and corresponding employed bee of food source retires . The new employed bee starts exploring the neighbourhood and repeats the employed bee behaviour.
If the expectancy is not reached then the onlooker chooses other food source (solution) with different expectancy until it becomes employed. The above procedure repeats while all the onlooker bees get employed to food source. The food source with highest probability will be chosen maximum and the one with least probability is discarded more times.
The scout bee is to explore the search area and it is often rep- resented by a randomly generated solution. It will replace an employed bee if its trials of mutation exceed a threshold limit. The scout will encourage the exploration of unexplored area of the search space.
The best solution and fitness values are memorized for every iteration. The above process is repeated for maxi- mum no of iterations and the result at the end will ensure a global minimum or maximum.
IJSER © 2012
International Journal of Scientific & Engineering Research, Volume 3, Issue 1, January-2012 3
ISSN 2229-5518
4) ARTIFICIAL BEE COLONY ALGORITHM
1) Generate n random solutions with in boundaries of the system
P = Pmin + rand*(Pmax – Pmin)
2) Calculate the objective function and fitness of each so-
lution
3) Store the best fit as Pbest solution
4) A mutant solution is formed using a randomly se-
lected neighbour
Pk mutant = Pk (i) + ( Pj(i)- Pk(i))* (2*rand – 1))
Where j is the randomly selected neighbour and i is a
random parameter
5) Replace Pk mutant by Pk, if the mutant has higher fitness
or lower fuel cost of generation.
6) Repeat the above procedure for all the solutions.
7) Probability of each solution is calculated as
Probability (i) =a*fitness (i)/max (fitness) + b
Where { a+b =1 }
8) The solution P is selected if its Probability is greater
than a random number
If (rand<probability (i))
Solution is accepted for mutation
Else
Go for next solution
Counter is Incremented
While (Counter = population/2)
9) Again the best P is determined
10) Replace a P by random P if its trial counter exceeds
threshold
11) Repeat the above for max no of iterations
12) The Pbest and F (Pbest) are the best solution and Global
min of the objective function.
5) RESULTS
The results of ELD after the implementation of proposed ABC algorithm are discussed and compared with the GA and clas- sical method (lambda iteration). The algorithms are coded in MATLAB to solve ELD problem.The performance is evaluated with losses for three sets of generator data.
Note: All the values of power generation and demand are pre- sented in the units of MW. The Fuel cost coefficients and fuel cost are mentioned in same units for relative comparision. Otherwise mentioned the fuel cost is assumed in INR.
The specifications of three generator test system are detailed in table 5.1(a) and 5.1(b). The power demand is considered to be
300MW.Transmission loss coefficients are given in Table 5.1(c). The results corresponding to Lambda Iteration method, GA, FCGA and ABC are detailed in section 5.1(d).
Table 5.1 (a) Cost coefficients of 3 generator system
Limits | PMax | PMin |
P1 | 250 | 50 |
P2 | 150 | 5 |
P3 | 100 | 15 |
Table 5.1(b) Max and Min limits of the generators
0.000136 | 0.0000175 | 0.000184 |
0.0000175 | 0.000154 | 0.000283 |
0.000184 | 0.000283 | 0.000161 |
Table 5.1(c) Loss coefficients (B coefficients)
Simulation parameters
1) Colony size (employed bees + onlooker bees) = 20
2) Foodsources = 10
3) Limit=100
4) Max iterations=100
Algorithm | LIM | GA | FCGA | ABC |
P1 | 202.49 | 202.464 | 202.457 | 202.4705 |
P2 | 81.0267 | 80.9787 | 80.9728 | 80.9742 |
P3 | 27.0149 | 27.0799 | 27.0779 | 27.0817 |
Plosses | 10.5311 | 10.5354 | 10.5344 | 10.5364 |
Error | 0.00065 | 0.012929 | 0.026841 | 0.00000 |
Fuel cost | 3615.11 | 3614.95 | 3614.79 | 3615.100 |
5.2(c) Power generation and fuel costs of 3 gen system.
The IEEE data of 6 generator 30 bus system is given in Table
5.2(a).This data is used to solve economic dispatch using ABC,
[6] GA and AIS algorithm in the MATLAB platform.
Generator | 2*ai | bi | ci | Pmin | Pmax |
G1 | 0.0037 | 2. 0000 | 0 | 50 | 200 |
G2 | 0.0175 | 1.7500 | 0 | 20 | 80 |
G3 | 0.0625 | 1.0000 | 0 | 15 | 50 |
G4 | 0.0083 | 3.2500 | 0 | 10 | 35 |
G5 | 0.0250 | 3.0000 | 0 | 10 | 30 |
G6 | 0.0250 | 3.0000 | 0 | 12 | 40 |
Table 5.2(a)) IEEE 30 Bus 6 Generator system data
Unit no | ai | bi | ci |
IJSER © 2012
International Journal of Scientific & Engineering Research, Volume 3, Issue 1, January-2012 4
ISSN 2229-5518
0.000010 | 0.000004 | 0.000430 | 0.000134 | 0.000160 | 0.000108 |
0.000010 | 0.000015 | 0.000134 | 0.000097 | 0.000097 | 0.000051 |
0.000001 | 0.000003 | 0.000160 | 0.000256 | 0.000256 | 0.000000 |
0.000027 | 0.000031 | 0.000108 | 0.000000 | 0.000000 | 0.000359 |
Table 5.2 (b) Loss Coefficients for IEEE 30 Bus System
Simulation parameters
1) Colony size (employed bees + onlooker bees) = 20
2) Foodsources = 10
3) Limit=100
4) Max iterations=200![]()
Table 5.2(c) Optimized Fuel cost of a 6 generator system with losses. From the table 5.2 (c), it is clear that ABC is more robust and ensures a
global minimum while AIS and GA ends up in a local minima.
The ABC is applied for a 38 generator system test data with out considering the losses.The generator data is shown below in table 5.3 (a). The results compared with [8] FCGA in table
5.3 (b) shows that ABC ensures global minimum compared to
FCGA but at the cost of relatively high compuatational time.
5.3 (a) 38 Generator system test data
Simulation parameters
1) Colony size (employed bees + onlooker bees) = 20
2) Foodsources = 10
3) Limit=100
4) Max iterations=1000
Unit | ai | bi | ci | Pmin | Pmax |
1 | 0.3133 | 796.9 | 64782 | 220 | 550 |
2 | 0.3133 | 796.9 | 64782 | 220 | 550 |
3 | 0.3127 | 795.5 | 64670 | 200 | 500 |
4 | 0.3127 | 795.5 | 64670 | 200 | 500 |
5 | 0.3127 | 795.5 | 64670 | 200 | 500 |
6 | 0.3127 | 795.5 | 64670 | 200 | 500 |
7 | 0.3127 | 795.5 | 64670 | 200 | 500 |
8 | 0.3127 | 795.5 | 64670 | 200 | 500 |
9 | 0.7075 | 915.7 | 172832 | 114 | 500 |
10 | 0.7075 | 915.7 | 172832 | 114 | 500 |
11 | 0.7515 | 884.2 | 176003 | 114 | 500 |
12 | 0.7083 | 884.2 | 173028 | 114 | 500 |
13 | 0.4211 | 1250.1 | 91340 | 110 | 500 |
14 | 0.5145 | 1298.6 | 63440 | 90 | 365 |
15 | 0.5691 | 1298.6 | 65468 | 82 | 365 |
16 | 0.5691 | 12908 | 77288 | 120 | 325 |
17 | 2.5881 | 238.1 | 190928 | 65 | 315 |
18 | 3.8734 | 149.5 | 285372 | 65 | 315 |
19 | 3.6842 | 1269.1 | 271676 | 65 | 315 |
20 | 0.4921 | 696.1 | 39197 | 120 | 272 |
21 | 0.5728 | 660.2 | 45576 | 120 | 272 |
IJSER © 2012
International Journal of Scientific & Engineering Research, Volume 3, Issue 1, January-2012 5
ISSN 2229-5518
Algorithms, ABC is the best method to reach the near Global
optimal solution but at the cost of high computational time.. However good choice of the number of iterations, population size, Employed and unemployed bees results in fast computa- tion. ABC can be modified using operators of fast compua- tional alogrithms to get a hybrid fast computational ABC.
I express our profound sense of gratitude in all its humbleness to my mentor Prof.D.M.Vinod Kumar, Department of Elec- trical Engineering, National Institute of Technology, Waran- gal, for his brilliant and gracious guidance and unstinted co- operation throughout my work.
5.3 (b) Optimum Fuel cost of 38 generator systems for FGA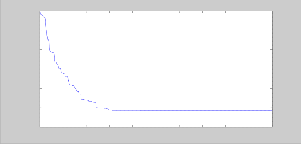
and ABC
x 10 7
1.06
1.04
1.02
1
0.98
0.96
0.94
0 100 200 300 400 500 600 700 800 900 1000
5.3 (c) Plot of Fuel cost Vs number of iterations (Pd= 7500)
I express my profound thanks to Prof D.V.S.S SIVA SHARMA
and Prof M. Sydulu, Department of Electrical Engineering.
[1] D.Karaboga, "An idea Based on Honey Bee Swarm for Numerical Optimization", Technical Repor-Tr06t, Erciyes University, Engineering faculty, Computer Engineering Department, Turkey, 2005.
[2] M. Dorigo and C. Blum, “Ant colony optimization theory: A survey,”
Theoretical Computer Science, vol. 344, no. 2-3, pp. 243–278, 2005.
[3] E. Bonabeau, M. Dorigo, and G. Theraulaz, Swarm Intelligence: From
Natural to Artificial Systems. New York, NY: Oxford Univ. Press,
1999.
[4] M. Cox and M. Myerscough, “A flexible model of foraging by a honey bee colony: the effects of individual behaviour on foraging success,” Journal of Theoretical Biology, vol. 223, pp. 179–197, 2003.
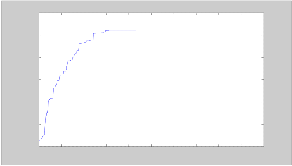
1.06
x 10 -7
1.04
1.02
1
0.98
0.96
0.94
0 100 200 300 400 500 600 700 800 900 1000
5.3 (d) Plot showing Fitness Vs no of iterations (Pd= 7500)
The above plots show the build up of the solution with number of iterations. Once the near global minimum is reached the fitness growth is saturated. The solution for a 38 variable system is ob- tained in less than 400 iterations where the maximum no of itera- tions is 1000.
CONCLUSION
Economic Load dispatch problem being attempted using ABC algorithm for various generator test system evaluates the per- formance of the proposed approach. Among all Evolutionary
[5] R.Behera, B.B.Pati, B.P.Panigrahi, “Economic Power Dispatch using Artificial Immune System”, in 16th NATIONAL POWER SYSTEMS CONFERENCE, pg: 664-668.
[6] Satyendra Pratap Singh, “Economic load dispatch using fuzzy logic controlled genetic algorithm” Masters Degree Thapar University, Punjab.
[7] B.Basturk, Dervis Karaboga, An Artificial Bee Colony (ABC) Algo- rithm for Numeric function Optimization, IEEE Swarm Intelligence Symposium 2006, May 12–14, 2006, Indianapolis, Indiana, USA.
[8] M.Sailaja Kumari, M.Sydulu, “A Fast Computational Genetic Algo- rithm for Economic Load Dispatch”, in International Journal of Re- cent Trends in Engineering Vol. 1, No. 1, May 2009,pg: 349-356.
[9] T. D. Seeley and C. Tovey, “Why search time to find a food-storer bee accurately indicates the relative rates of nectar collecting and nectar processing in honey bee colonies,” Animal Behaviour, vol. 47, pp. 311–
316, 1994.
[10] J. Bartholdi, T. D. Seeley, C. Tovey, and J. VandeVate, “The pattern and effectiveness of forager allocation among flower patches by ho- ney bee colonies,” Journal of Theoretical Biology, vol. 160, pp. 23–40,
IJSER © 2012
International Journal of Scientific & Engineering Research, Volume 3, Issue 1, January-2012 6
ISSN 2229-5518
1993.
[11] F. N. Lee and A. M. Breipohl, "Reserve constrained economic dis- patch with prohibited operating zones," IEEE Trans. Power Syst., vol.
8, pp. 246-254, Feb. 1993.
[12] D.Karaboga, "An idea Based on Honey Bee Swarm for Numerical Optimization", Technical Repor-Tr06t, Erciyes University, Engineering faculty, Computer Engineering Department, Turkey, 2005.
[13] J. Nanda, D. P. Kothari, and K. S. Lingamurthy, "Economic-emission load dispatch through goal programming techniques," IEEE Transac- tions on Energy Conversion, vol. 3, no. 1, pp. 26-32, 1988.
[14] Leandro Nunes de Castro & Fernando J. Von Zuben , The Clonal Selection Algorithm with Engineering Applications.In Workshop Proceedings of GECCO’00, pp. 36-37, Workshop on Artificial Im- mune Systems and Their Applications, Las Vegas, USA, July 2000.
[15] U. N. S. Rahimullah, E.I. Ramlan and T.K.A. Rahman. “Evolutionary Approach for Solving Economic Dispatch in Power System” Proceed- ings of the IEEE/PES National Power Engineering, voI.1, pp. 32 - 36, Dec 2003.
[16] S.Sayah and K. Zeher “ Using Evolutionary Computation to Solve the Economic Load Dispatch” in Leonardo Journal of Sciences, Issue 12, January- June 2008 , p.67-68
IJSER © 2012