International Journal of Scientific & Engineering Research, Volume 4, Issue 7, July-2013 2379
ISSN 2229-5518
*C.O. Anyaeche (1) A. O. Adeodu (2) I. A. Daniyan (3)
(1, 2) Department of Industrial and Production Engineering
University of Ibadan, Ibadan,
Nigeria.
(3) Department of Mechanical and Mechatronics Engineering
Afe Babalola University, Ado Ekiti,
Nigeria.
![]()
![]()
![]()
(1) osita.anyaeche@mail.ui.edu.ng , (1)osyanya@yahoo. com (2) femi2001ng@yahoo.com,
![]()
(2)Corresponding Author
The aim of this research is to study selected cyber cafe workstations to establish the current practices with reference to the use of anthropometry. Also to re-design the work station, if necessary, in order to improve productivity, health safety and comfort of the operators in the work station.
Optimising the anthropometric data for computer work station design can be a complex task because of the number of design parameters that must be put into consideration. This problem has recently been made much easier to solve as a result of the development of some design principles like design for extreme, design for average sizes and design for adjustable range. Because of the nature of the selected workstations, design for adjustable range principle is used. Anthropometric dimensions of the operators were used to design chair and table which can accommodate 5% - 95% of the operators.
The work stations were examined and analysed under the combination of different anthropometric parameters. The analysis of the results indicates some deficiencies in the design of the workstation based on the design parameters and standard values from the literatures. Based on the analysis of these results the operators and their clients may likely be exposed to fatigue, work stress and other related diseases.
For demonstration of the application of the adjustable range design approach, a computer operator work station (Open Plan Cyber café) has been re-designed as a real case. It is hoped that the new design will contribute to improvement in productivity, health safety and comfort of the operators in the workstation. In the proposed adjustable range design approach, I suggest to every organisation operating with the workstation. Before any decision on making or buying equipments and tools, industrial engineers are to be consulted depending on the design factor, for proper guidance.
Anthropometric dimensions of the workers should also be considered for any workstation that requires chair and table design.
Many works that were done on anthropometry as a design factor for computer operator work station were done on simple system, where design for extreme and average are always reasonable. The research work was done on multiple complex systems like cyber cafe, where many people of different sizes and shapes were considered. In view of these, design for adjustable range is most economical and ergonomic appropriate.
IJSER © 2013 http://www.ijser.org
International Journal of Scientific & Engineering Research, Volume 4, Issue 7, July-2013 2380
ISSN 2229-5518
An ergonomic design computer workstation environment should eliminate static or awkward posture, repetitive motion of the worker, poor access or inadequate clearance and excessive reach to work areas. This is achieved, when an organization successfully matches the work processes with the individual who performs the tasks. Computers have almost totally replaced typing machine, and facilitated intensive research activities of various sorts through their screens using key board and mouse [1]. Therefore, continuous and repetitive nature of computer application, normally involving long hours of work for on the job usage or for leisure, engaging mostly one hand (and about three middle fingers of the right hand in the case of using mouse) [12] in most hanging situation, and sewing the eyes to hieroglyphs on the improperly positioned screen are bound to inflict multitude of very complicated injuries, mostly of persisting kind, to the user [[1]. Epidemiological studies have concentrated on identifying the primary risk associated with the wrong design of computer workstation in Nigeria [7]. Researchers have identified three main categories; cardiovascular diseases,
Anthropometry is the science that measures the range of the body sizes in a population [13]. When designing products it is important to remember that people come in many sizes and shapes. Anthropometric data varies considerably between regional populations [13]. For example, Scandinavian population tend to be taller, while Asian and Italian population tend to be shorter [13]. Anthropometric dimensions for each
population are ranked by sizes and described
gastrointestinal illness, and musculoskeletal problems [7]. The most prevalent health problems in Nigeria are musculoskeletal, relating to neck and back pain [7]. Studies have found that frequent user of about 80.5% have experienced some degree of back pain, compared with 50% of non – user. The incidence of reported low back pain is 20% higher for user than non – user as a results of poor design and not putting Anthropometry into consideration.
Optimising the anthropometric data for computer work station design can be a complex task because of the number of design parameters that must be put into consideration. This problem has recently been made much easier to solve as a result of the development of some design principles like design for extreme, design for average sizes and design for adjustable range. Using these designs, one can conveniently predict the safety in term of comfort and thus increasing the performance level of workers in a particular computer work station.
The research aimed at study cyber café selected work station to establish the current practice with reference to the use of Anthropometry. To re- design the work station, if necessary, in order to improve the productivity, health safety and comfort of the operators in the workstation
as percentiles [13]. It is common practices to design for the 5th percentile female to the 95th percentile male. The 5th % female value for a particular dimension e.g. sitting height usually represents the smallest measurement for design in a population. Conversely, the 95th % male value may represent the largest dimension for which one is designing. The 5th
% to 95th % range accommodates
approximately 90% of the population. To design for a larger portion of the population, one might use the range from the 1st % female to the 99th % male.
IJSER © 2013 http://www.ijser.org
International Journal of Scientific & Engineering Research, Volume 4, Issue 7, July-2013 2381
ISSN 2229-5518

Applying practical interview, and remembering the tilt angle that draft person used to provide for themselves of their drawing boards, one can propose a totally different angle for the screen in respect to the desk surface, and a stepped desk, which can include useful components that lack in most present design. Good designs certainly eliminate or, at least alleviate the use- inflicted problems to a great extent. New conceptual look and redesign of certain items, such as the seat, mouse, keyboard, etc. using advantages of developments in the science of
Source: [1]
The height of the desk step provides just enough room for some compartmentalization purposes. These compartments, though limited in size, facilitate design of lockers for the user, space for writing paper, CDs, etc. the best location of the tower for right- hand users, which is an established practice now, is
underneath the desk at the right hand.
mechatronics is a vital necessity before too late [1].
In order to alleviate hand, wrist, arm and back strains, it has been approved by the computer users to locate the mouse and keyboard at a lower height than the desk, main surface. This lower desk surface is considered continuous lengthwise, in the design, to provide enough free space for some of the peripheral to move about. Considering the anthropometric standard, the design also facilitates serial arrangement of desk [3], which are suitable for most of the work environment as generally practiced now.
Some people are casual users of computers. However, at work situations most of the computer users include those who would be busy at it the whole working hours continuously, day in and day out. It can be argued that continuous use of present design computer facilities, which suffer major design errors, would certainly be bound to inflict injuries of persistent degree to the enormous population of users who are on the increase. As we emphasized earlier, unless the whole system of the hardware and the software is revised on the basis of the principles of engineering design backed up by certain law regulations, the problem will insist. Present PC terminals, keyboards, mice, desks and seats are the major components, which, on the opinion of the present authors, require serious design revisions.
IJSER © 2013 http://www.ijser.org
International Journal of Scientific & Engineering Research, Volume 4, Issue 7, July-2013 2382
ISSN 2229-5518
It is now an established fact that, repetitive use of computers constituting of monitor, mouse, keyboard, desk, and seat can fatally ruin the health of user eyes, wrist, and cause various musculoskeletal changes and general fatigue of mind and other organs.
We have also considered a continuous lower level on the desk design to facilitate a free-to- move or positional adjustability of the keyboard and mouse to be located at a lower level than the screen and peripheries. The step on the desk also provides compartmental facilities to cater for the user private belongings and filing purposes.
Computer chair is the most important part of computer work station [11]. The chair has to fit user and suit the tasks that is been done. One style of chair may not suit every worker. For example, the average chair is designed in some instances to fit the average male and may not suit other users.
A chair is only ergonomic if it can be adjusted to fit the user [11]. The following features are part of a good computer chair [11]:
I. 5 – Caster Swivel base
II. Arm rest
III. Height adjustable seat pan
IV. Tilt adjustable back rest
V. Ability to make adjustments easily while sitting in the chair
VI. Firm padding covered with non slip, breathable fabric
The special features include [11]:
Seat Pan: the seat pan should be the type with rounded front edge, wide and deep enough to fit the user Comfortability, and with adjustable in angle.
Back rest: the back rest contains padding for the low back area that is curved to fit the shape of the back of the user. It must be of adjustable height and angle with locking
mechanism, wide and high enough to fit the
back of the user. It should be noted that, when seated, the back tends to lose some of its natural curvature [13]. An effective lumber support of a chair is designed to help maintain the natural curvature of the spine when sitting. It is important to provide appropriate support for the spine so that there is no discomfort or pain.
Figure 3. Chair with Lumber support
Source: [11]
The arm rest should be designed in such a way to eliminate interference with the work surface and will provide height and width adjustability.
The chair height is designed in a way that allows the feet of the user to rest comfortably on the floor and even pressure is felt from the seat pan both on the back of the seat (buttock region) and under the thighs (near the knees). To carter for the chair range of motion, the seat and back rest should allow for varied seated postures. This can be accomplished by allowing a rearward tilt of the back. A
minimum of 100 rearward tilt (between 900
and 1150) is preferable [13]. The only guidelines for seat tilt measurement is to ensure the torso-to thigh angle is not less than
IJSER © 2013 http://www.ijser.org
International Journal of Scientific & Engineering Research, Volume 4, Issue 7, July-2013 2383
ISSN 2229-5518
900, and that the seat angle is between 0- 40 rearward tilt [13].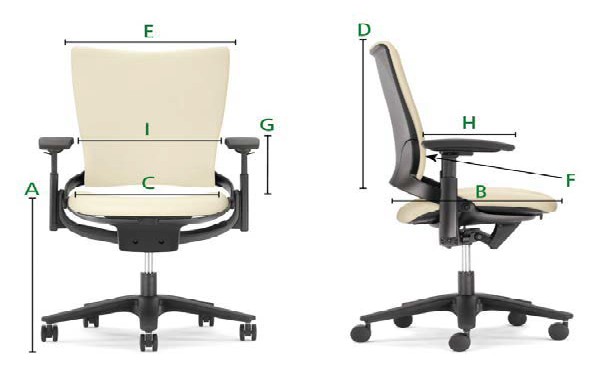
Figure 4. Measurements from BIFMA guidelines used for Ergonomic Chair
Source: [4]
Table 1 Specific BIFMA Chair design guideline Measurements (all dimensions in inch) Source: [4]
measurement | BIFMA Guideline (inch) | All Steel Sum Chair (inch) | ||
Seat Height | A | Popliteal Height + Shoe allowance | 15.0 - 19.9 | 15.0 – 22.25 |
Seat Depth | B | Buttock- Popliteal length- Clearance allowance | No deeper than 16.9 (fixed), 16.9 include (adjustable) | 15.0 – 18.0 |
Seat Width | C | Hip breadth, Sitting + Clothing allowance | No less than 18.0 | 18.0 |
Back rest Height | D | None | At least 12.2 | 24.0 |
Back rest Width | E | Waist breadth | 14.2 | 16.0 |
Back rest Lumber | F | None | Most prominent point 5.9 – 9.8 from seat pan, in and out1 | Infinite through height of back |
Arm rest Height | G | Elbow rest Height | 6.9 – 10.8 7.9 – 9.8 | 7.0 – 11.0 |
Arm rest Length | H | None | None | 10.5 |
Distance between Arm rest | I | Hip breath, Sitting + Clothing allowance | 18 (fixed) 18 (adjustable) | 16.5 – 19.0 |
IJSER © 2013 http://www.ijser.org
International Journal of Scientific & Engineering Research, Volume 4, Issue 7, July-2013 2384
ISSN 2229-5518
A random sample of thirty respondents was
selected from two different cyber cafes in equal proportions. The study was divided into two phases. A survey was conducted using questionnaire and observation method, focusing on the anthropometric dimensions of the respondents. These were done to identify the level of ergonomic awareness and the level of implementation of ergonomic programmes in the design of the computer work station. The second phase of the study was the ergonomic re-design of the computer work station using data from the anthropometric dimensions of the respondents and the standard parameter from the literature. Anthropometric Dimensions for Desk and Chair Design
The data was collected under the
following body dimensions:
1. Sitting Height: with the subject sitting erect, distance from sit to vertex of the hair pressed down.
2. Shoulder Width: the distance from the edge of one shoulder to the next in the sitting position.
3. Hip Width (Seat Width): distance between the outer part of the right and left hips in a seated position.
4. Elbow Rest Height (Arm rest Height): with subject sitting erect, distance from seat to bottom of elbow.
5. Knee Height (Seat Height): distance from the knee to the sole in sitting position.
6. Buttock-Knee Length (Seat Depth): distance from the back of the buttocks to the foremost point of the patellar.
7. Thigh Clearance: with subject sitting, distance between the right and left thigh.
8. Eye Height: with subject sitting erect,
distance from the seat to the eye level.
9. Lower Arm-Hand Length (Arm rest Length): in sitting position, distance from the elbow to the mid finger tip.
10. Back rest Lumber: distance between the lower back rest curvature to the tip of the seat pan.
11. Back rest Height: distance between the
topmost edge and bottom edge of the back rest.
12. Back rest Width: distance between the top most right side to the top most left side of the back rest.
13. Distance between the Arms rests: in sitting position, hip width with clothing allowance.
The primary statistical procedure used was one - way analysis of variance (ANOVA) [2]. The general linear model in SPSS 16.0 was used for analysing data. The SPSS 16.0
Software program includes an additional column labelled sig. for significance [10]. Several assumptions were made for the one - way ANOVA statistical procedures in the study. (a) Samples were randomly collected from the population and randomly assigned to group (b) There was homogeneity of variance (c) the error rate selected was 0.05 type 1 error.
Part | Profile | Category | Frequency | Percentage |
Gender | Male | 16 | 53.33 |
IJSER © 2013 http://www.ijser.org
International Journal of Scientific & Engineering Research, Volume 4, Issue 7, July-2013 2385
ISSN 2229-5518
Female | 14 | 46.67 | ||
Age Limit | 50 year above 40-50yrs 30-40yrs 20-30yrs Below 20 | 4 5 9 10 2 | 13.33 16.67 30.00 33.33 6.67 | |
Weight | 30-45kg 45-70kg Above 70kg | 5 15 10 | 16.67 50.00 33.33 | |
Height | Below 1.5m 1.5-1.7m 1.7m above | 6 17 7 | 20.00 56.67 23.33 | |
Job Responsibility | Computer Operator | 30 | 100.00 | |
Daily Working Hour on the Computer | How Often does the user work on the machine | Always Sometimes Rarely Not at all | 20 9 1 0 | 66.67 30.00 3.33 0.00 |
Daily Working Hour on the Computer | Duration per day | 6-8hrs 3-6hr Below 3hrs | 8 15 7 | 26.67 50.00 23.33 |
Did you experience pain during and after work | Always Sometimes Rarely Not at all | 6 13 6 5 | 20.00 43.33 20.00 16.67 | |
Which of the working position is more comfortable | Sitting Standing Alternating standing and sitting | 30 0 0 | 100.00 0.00 0.00 | |
Did you feel pain in any of these parts | Spinal cord Thigh Legs Hips Fingers Hand muscles Leg muscles Feet Buttocks Shoulders Neck region Elbow forearm wrist | 12 7 2 3 0 7 3 0 14 10 13 3 2 | 15.79 9.21 2.63 3.95 0.00 9.21 3.95 0.00 18.42 13.16 17.11 3.95 2.63 | |
Identification of | How often did | Always | 6 | 20.00 |
IJSER © 2013 http://www.ijser.org
International Journal of Scientific & Engineering Research, Volume 4, Issue 7, July-2013 2386
ISSN 2229-5518
knowledge and Ergonomic Awareness | you experience fatigue at work | Sometimes Rarely Not at all | 11 8 5 | 36.67 26.67 16.67 |
In which of the body part do you feel much pain | Leg muscle Neck region Buttocks Spinal cord Hand muscles Hips fingers | 4 11 5 8 3 0 2 | 12.12 33.33 15.15 24.24 9.10 0 6.10 | |
Level of implementation | Can you evaluate the existing design of the workstation | Strong conformed Slightly conformed Moderately conformed Conformed Not conformed | 5 9 7 7 2 | 16.67 30.00 23.33 23.33 6.67 |
How can you rate your productivity and efficiency with existing design at work | Excellent Average Good Poor | 6 12 10 2 | 20.00 40.00 33.33 6.67 |
specification | SH | SW | HW | ERH | KH | BKL | TC | EH | LAHL |
Mean Value | 32.8 | 19.3 | 19.3 | 7.3 | 17.9 | 23.2 | 6.7 | 29.5 | 12.1 |
Range | 30-36.4 | 16.8- 21.6 | 16.4- 22.8 | 6-9.2 | 17-19 | 19.6- 25.2 | 6.4- 10.8 | 27.6- 31.2 | 11-14.4 |
STD | 3.68 | 3.13 | 3.87 | 2.53 | 2.83 | 3.41 | 3.21 | 2.76 | 2.35 |
specification | SH | SW | HW | ERH | KH | BKL | TC | EH | LAHL |
Mean Value | 30.0 | 19.3 | 19.1 | 7.1 | 17.4 | 23.3 | 6.5 | 29.3 | 12.1 |
Range | 28-34.4 | 17.6- 20.8 | 16.4- 22.8 | 5.2-8.8 | 17 -19 | 20-27.2 | 6-9.2 | 27.6- 31.2 | 10.8- 13.2 |
STD | 3.96 | 2.93 | 3.89 | 2.72 | 2.64 | 3.68 | 2.66 | 2.83 | 3.00 |
The survey exercise was 100% response; all the questionnaires given out were attended to. The majority of the respondents were male, which was 53.33% while the female was
46.67%. The age limit of most of the
respondents fell in between 20 – 30 years
with a percentage of 33.33%, followed by the age limit between 30 – 40years with a percentage of 30%. Age 40 – 50 years limit was 16.67%, 50 years and above was 13.33% and 20% of the respondents were below 20 years. Most of the respondents were 56.67% and 50% in height and weight respectively. The extremely tall respondents of above
1.7meters were 23.33%, followed by those
IJSER © 2013 http://www.ijser.org
International Journal of Scientific & Engineering Research, Volume 4, Issue 7, July-2013 2387
ISSN 2229-5518
respondents below 1.5 meters with 20% quota. All the respondents were frequent computer user, so 100% computer operators were recorded.
In the area of daily working hour of the respondents, the highest number of the respondents uses computer between 3 –
6hours per day with 50% quota, while the
least users were below 3 hours per day. Full working hour respondents fell in between the two, with 26.67%. Almost half of the respondents experiences pain sometimes during and after work with 43.33%. ‘Always’ and “rarely’ pain experience user were both
20%, 16.67% of the respondents neither experience pain during nor after work. All the respondents preferred sitting position while at work on computer. The respondents’ experiences pain mostly o the buttock, neck region, spinal cord and shoulder with 18.42%,
17.11%, 15.79% and 13.16% respectively. The thigh and hand muscles both shared the same level of 9.2%, while hips, leg muscles and elbow/forearm were 3.95%. The
respondents rarely experience pain on the legs
and wrist with 2.63%. None of the respondent experience pain on the finger.
In the ergonomic awareness part of the result from the questionnaire, 36.67% of the respondent sometimes experiences fatigue at work, mostly at the neck region with 33.33%, while 26.67% rarely experience fatigue. 20% always experience, and 16.67% never experience at all. The percentage of respondents that also experienced fatigue causing pain on the spinal cord, buttocks, leg muscles and hand muscles were 24.24%,
15.15%, 12.12% and 9.10% respectively.
The level of implementation of ergonomic in the existing design was evaluated by the respondents using likert scale. 23% of the respondents agreed to moderately conformed,
30% agreed to slightly conformed, 16.67%
consented to strongly conformed, while only
6.67% chose not conformed. The respondents rated their productivity and efficiency on the existing design. 40% consented to be good,
33.33% consented to be average performance,
20% believed to be excellent, and only 6.67%
agreed to not conform.
Chair/Desk Specification | Specification Dimensions of existing design | Dreyfuss Standard Values | Woodson Standard Values |
Seat Height | Popliteal height + Shoe allowance = 12.5 | 14.5 – 19.0 | 15 - 18 |
Seat Depth | Buttock-Popliteal length – Clearance allowance = 14 | 16 | 16 |
Seat width | Buttock-Popliteal length – Clearance allowance = 16 | 16 - 22 | 19 |
Seat Angle | Fixed | 0 – 40 rearward (fix) | 0 - 50 |
Back rest Lumber | None | 7.0 – 11.5 in/out 0.6 – 0.8 | 7.0 – 10.0 |
IJSER © 2013 http://www.ijser.org
International Journal of Scientific & Engineering Research, Volume 4, Issue 7, July-2013 2388
ISSN 2229-5518
Back rest Height | At least 12.5; over 25 For upper body support | At least 13; over 25 for upper body support, 36 for head support | At least 8; 34 for head support |
Movement of seat and Back rest | Fixed | 900 - 1050 | 900 - 1050 |
Arm rest Height | None | 7.5 – 10; 8.5 (fixed) | 12 |
Arm rest Length | None | 10 – 12 forward of seat reference point | 12 |
Shoulder width | 14.5 | 19.3 | 19.9 |
Distance between Arm rest | None | 19 minimum | 19 |
Hip width | 14 | 14.3 | 14 |
Buttock – kneel length | 20.2 | 22.2 | 25.2 |
Thigh clearance | None | 5.4 | 6.9 |
Eye Height | 24.3 | 29.3 | 33.5 |
Sitting Height | 18.0 | 33.4 | 38.0 |
The comparative analysis of the anthropometric dimensions of the respondent, existing design of the computer workstation and standards from the literature shows that the existing computer workstation is poorly designed. The anthropometric dimensions of users in the work station were not considered in the design of computer desk and chair.
To design the workstation to attain Standard ergonomic level of implementation as described in the literatures, the principle of Anthropometry must be considered.
The re- designed workstation is presented in the tables below
The computations of parameters of re- designed
work stations are summarized in Table 6 and 7

Female 5% | Female 95% | Male 5% | Male 95% | Female Mean | Male Mean | |||
Value | Value | |||||||
Seat (KH) | Height | 17.9 | 21.5 | 19.3 | 23.4 | 17.4 | 17.9 | 17.9 – 23.4 |
Seat | Width | 20.4 | 24.6 | 21.3 | 25.2 | 23.3 | 23.2 | 20.4 – 25.2 |
Back Lumber | rest | 7.0 11.0 7.0 10.0 | 9.2 | 8.8 | 7.0 – 11.0 |
Back Height | rest | At least 8, 34 for head support | N/A | N/A | At least 8, 34 for head support |
Seat Wi | dth | 19.0 19.0 19.0 19.0 | 19.1 | 19.3 | 19.0 |
Back res | t Width | 16.0 16.0 16.0 16.0 | N/A | N/A | 16.0 |
IJSER © 2013 http://www.ijser.org
International Journal of Scientific & Engineering Research, Volume 4, Issue 7, July-2013 2389
ISSN 2229-5518
the Seat and Back rest | |||||||
Arm rest Height | 7.1 | 11 | 7.4 | 11.6 | 7.1 | 7.3 | 7.1 – 11.6 |
Arm rest Length | 12.0 | 12.0 | 12.0 | 12.0 | 12.1 | 12.1 | 12.0 |
Distance between the Arm rests | Hip Width plus Sitting Clothing Allowance = 19 Minimum | N/A | N/A | 19 Minimum | |||
Shoulder Width | 12.3 | 19.3 | 13.7 | 19.9 | 19.3 | 19.3 | 12.3 – 19.9 |
Hip Width | 19.0 | 19.0 | 19.0 | 19.0 | 19.1 | 19.3 | 19.0 |
Buttock-Kneel length | 20.4 | 24.6 | 21.3 | 25.2 | 23.3 | 23.2 | 20.4 – 25.2 |
Thigh clearance | 4.1 | 6.9 | 4.3 | 6.9 | 6.5 | 6.7 | 4.1 – 6.9 |
Eye Height | 27.4 | 31.0 | 28.7 | 31.3 | 29.3 | 29.5 | 27.4 – 31.3 |
Sitting Height | 30.9 | 33.4 | 33.2 | 38.0 | 30.0 | 32.8 | 30.9 – 38.0 |
Anthropometric measurement | Area of practical application |
Height | Height of panel wall |
Weight | Weight limit for sitting |
Sitting Height | Over head clearance and sitting panel height |
Sitting eye height | Height of top of monitor and the tilt angle of the monitor |
Thigh clearance | Clearance between the thighs and bottom of work surface |
Sitting hip width | Seat width |
Sitting Popliteal height | Seat height |
Sitting knee height | Knee clearance under work surface |
Waist depth | Clearance between back rest and work surface edge |
Buttock- to - Popliteal | Seat length |
Buttock -to -knee | Knee clearance |
Shoulder width | Seat and arm rest widths |
Elbow rest height/ Arm rest length | Arm rest, keyboard and work surface height |
Back rest height and breath | Back rest and support |
N | Mean | Std. Deviation | Std. Error | 95% Confidence Interval for Mean | Minimum | Maximum | ||
N | Mean | Std. Deviation | Std. Error | Lower Bound | Upper Bound | Minimum | Maximum |
IJSER © 2013 http://www.ijser.org
International Journal of Scientific & Engineering Research, Volume 4, Issue 7, July-2013 2390
ISSN 2229-5518
Male Anthro | 9 | 53.5978 | 17.86191 | 5.95397 | 39.8679 | 67.3277 | 19.31 | 82.10 |
Female Anthro | 9 | 49.1722 | 20.31322 | 6.77107 | 33.5581 | 64.7863 | 17.71 | 75.10 |
Total | 18 | 51.3850 | 18.69497 | 4.40645 | 42.0882 | 60.6818 | 17.71 | 82.10 |
The Maximum and Minimum mean values anthropometric dimensions for male and female
respondents are (82.10, 19.31) and (75.10, 17.71)
respectively. The standard deviations for both male and female anthropometric dimensions are
17.86 and 20.31 respectively.
Sum of Squares | df | Mean Square | F | Sig. | |
Between Groups | 88.135 | 1 | 88.135 | .241 | .630 |
Within Groups | 5853.399 | 16 | 365.837 | ||
Total | 5941.533 | 17 |
Using the one – way ANOVA [2] based on the SPSS 16.0, [10] the test of the between and within samples were run for anthropometric dimension as shown in table 4.6B. The samples are statistically significant at F (1, 16) = 0.241 and level of significance 0.63 respectively. Using a test of significance reference table, the F- critical value
2. The operators suffer work stresses like fatigue and pains during and after prolonged usage of the work station.
3. There is negative impact on the productivity of the operators of the work station
4. The work station is not user friendly.
was 6.3 at 1 degree of freedom and alpha equals
0.05 which was the 95% confidence level. The F- observed value for the anthropometric dimension with degree of freedom of 1 was less than F critical value. Based on analysis F statistical value, the samples were insignificant at the 95% confidence level.
The following recommendations will I suggest to every organisation operating with the workstation:
1. Before any decision on making or buying equipments and tools, industrial engineers are to be consulted depending on the design factor, for proper guidance.
2. Anthropometric dimensions of the workers should also be considered for any workstation that requires chair and table design.
IJSER © 2013 http://www.ijser.org
International Journal of Scientific & Engineering Research, Volume 4, Issue 7, July-2013 2391
ISSN 2229-5518
[1] Ali Amirfazli and Hamid Salmasi. Design of an Ergonomic Computer Desk. Sharif University of Technology. http://www.sherifuniversity.edu, (2005)
[2] ANOVA terms. http://www.texasoft.com/wink-anov.ht ml, Retrieved July 13, 2004
[3] Baxster M. A Practical method for the Systematic development of new product Product
Design: Chapman and Hall, London, pg 47-50, (2007).
[4] BIFMA International. Ergonomics Guidelines for VDT (Video Display Terminal) Furniture used in Office Work spaces. Document G1-2002
[5] Dmpsey, P.G.; McGorry, R.W. and O’Brien, N.V. The Effect of Work Height, Work piece Orientation, Gender, and Srewdriver Type on Productivity and Wrist Deviation. International Journal of Industrial Ergonomics. Vol 33, pp 339-346, (2004).
[6] Henry Dreyfuss Associates and Tilley. The measures of Man and Woman, Revised Edition.
NewYork: John Waley&Sons, Inc, (2002)
[7] Kirsh, B. and Mckee, P. The Needs and Experiences of Injured Workers: A Participatory Research
Study. Vol 21, pp 221-231, (2003).
[8] Kroemer K., Kroemer K.H.E. (ed). Fitting the Task to the Human. London: Taylor and Francis,
(1997)
[9] Kroemer K.H.E., H.B. Kroemer and K.E Kroemer-Elbert. How to Design for Ease and
Efficiency. New Jersey: Prentice Hall, (2001)
[10] Norusis, M. J. SPSS 16.0 Statistical procedures companion. Upper Saddle River, NJ: Prentice
Hall, (2005).
[11] Office Ergonomic Handbook. 5th Edition. Occupational Health Clinics for Ontario Workers
Inc. USA, (May, 2008)
[12] Pedersen H. Soft Keyboard. RSI Network, Issue 34, January 1999
[13] Taylor Erim and Scott Openshaw. Ergonomic and Design. A Reference Guide, (2006). http://www.allsteeloffice.com/ergo
[14] Woodson, Wesley E., Barry Tillman and Peggy Tillman. Human Factor Design Handbook. 2nd
Edition. New York: McGraw-Hill, Inc (1992).
IJSER © 2013 http://www.ijser.org