obtained through the experiments are given in
Table 2 &. 3 and the available data have been analyzed by response surface method using Minitab software (version 14).
.
International Journal of Scientific & Engineering Research Volume 2, Issue 6, June-2011 1
ISSN 2229-5518
Analysis of Surface Roughness of
Machined Surface of Powder Metallurgy
Components
P.K.Bardhan, R.Behera, S.Patra, G.Sutradhar
—————————— • ——————————
1. INTRODUCTION
Powder Metallurgy Steel components often have to be machined after heat treatment
in order to obtain the correct shape as well as the required surface finish. Surface quality influences characteristics such as fatigue strength, wear rate, corrosion resistance, etc. The surface finish of a component may be critical for certain applications, affecting properties such as wear resistance, fatigue strength, and coefficient of friction.
The surface analysis is one of the most important factors of the metal machining process due to the tolerance and geometry
————————————————
• Department of Mechanical Engineering, JIS College of
Engineering, Kalyani, West Bengal, India.
• Department of Mechanical Engineering, Seemanta
Engineering College,Mayurbhanj, Orissa,India
• CWISS IIT Kharagpur, West Bengal, India
• Department of Mechanical Engineering, Jadavpur
University, West Bengal, India.
requirements.[1-2] The characteristic of powder metallurgy (P/M) surface geometry is the main issue, because the porous structure affects the surface quality. The overall smoothness and surface reflectivity depend on density, tool finish, and secondary machining operations. A discontinuous cutting path and some vibration occur when cutting tool passes from the edge of one pore to that of another [3]. Experimental results of surface roughness (Ra) of P/M components at different cutting speed has been analyzed through the various process parameters using response surface model. It has been observed that the compaction pressure, sintering temperature and sintering time strongly influence the response variable, surface roughness. A second order response surface model (RSM) has been used to develop a predicting
IJSER © 2011 http://www.ijser.org
International Journal of Scientific & Engineering Research Volume 2, Issue 6, June-2011 2
ISSN 2229-5518
equation of surface roughness based on the data collected by a statistical design of experiments known as central composite design (CCD). The analysis of variance (ANOVA) shows that the observed data fits well into the assumed second order RSM
model.
2. Experimental procedures
Kawasaki Steel Corporation Chiba Works, Chiba, Japan, supplied the iron Powder The relevant certification of chemical analysis and powder particle size distribution was performed by the same company and is
presented in Table 1.
Chemical Analysis of iron powder
C | Si | Mn | P | S | O | Total Fe |
0.001 | 0.02 | 0.17 - | 0.013 | 0.010 | 0.129 | Balance |
Powder Properties: Apparent Density (gm/cc): 2.94
Flow (s/50gm) : 24.7
Sieve Number Size Cumulative wt%
+ 100# >150 um 8.5
+ 150# >106 um 20.1
+ 200# > 75 um 22.9
+ 250# > 63 um 9.5
+ 325# > 45 um 16.8
- 325# <45 um 22.2
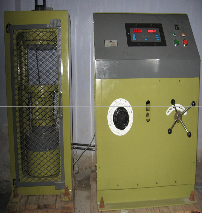
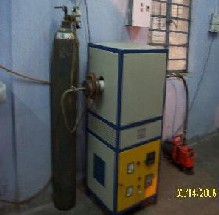
The iron powder was compacted in a closed cylindrical die using 120-Ton hydraulic press (make-Lawrence & Mayo) for green stage product (fig.1). During compaction, the die was lubricated with Zn-stearate. The sintering process was carried out in a tubular vacuum furnace of capacity 1450°C using
argon as an inert atmosphere (fig.2). Since
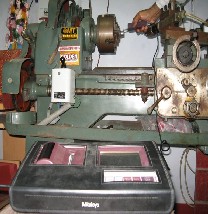
one of the major objectives of present investigations is to shade light on the hardness of the compacted sintered samples, 60 different P/M iron components (dia-25 mm) were produced according to design of experiment (DOE). Related surface roughness value of these samples were studied by
Surftest SJ-301 (Mitutoyo) machine (fig.3)
IJSER © 2011 http://www.ijser.org
International Journal of Scientific & Engineering Research Volume 2, Issue 6, June-2011 3
ISSN 2229-5518
against the variation of controllable process parameters like compaction, sintering time and sintering temperature. The results
obtained through the experiments are given in
Table 2 &. 3 and the available data have been analyzed by response surface method using Minitab software (version 14).
.
Fig.1.120 Ton. Hydraulic press. Fig.2: Tubular Vacuum Furnace Fig.3. Surface Roughness Surf test – SJ-301
3. Results and Discussions
Table 2 and Table 3 depict a variation of surface analysis against the process parameters.
Actual and coded values of process parameters and symbols used.
Process parameters (Independent variables) | Symbols | Levels | ||||||
Process parameters (Independent variables) | Actual | Coded | Actual | Coded | ||||
Compaction load (Ton) | z1 | x1 | 17.66 | 20.075 | 26.4 9 | –1 | 0 | +1 |
Sintering temperature (° C ) | z 2 | x2 | 975 | 1050 | 1125 | –1 | 0 | +1 |
Sintering time ( hrs) | z 3 | x3 | 1 | 1.5 | 2 | –1 | 0 | +1 |
IJSER © 2011 http://www.ijser.org
International Journal of Scientific & Engineering Research Volume 2, Issue 6, June-2011 4
ISSN 2229-5518
Observed Surface roughness (Ra) – values for different settings of process parameters.
Sl. N o. | Coded Value of Parameters | Actual Value of Parameters | Response variables Surface roughness Ra µm | ||||||
Sl. N o. | x1 | x2 | x3 | Compact -ion Ton | Sintering Temp. °c | Sintering Time hour | R2 (@ cutting speed 18.37 m/min. | R2 (@ cutting speed 27.95m/min | R2 (@ cutting speed 4.24 m/min |
1 | -1 | -1 | -1 | 17.66 | 975 | 1 | 7.92 | 7.45 | 8.92 |
2 | 1 | -1 | -1 | 26.49 | 975 | 1 | 3.34 | 4.73 | 4.25 |
3 | -1 | 1 | -1 | 17.66 | 1125 | 1 | 5.71 | 7.16 | 6.86 |
4 | 1 | 1 | -1 | 26.49 | 1125 | 1 | 2.31 | 2.75 | 2.29 |
5 | -1 | -1 | 1 | 17.66 | 975 | 2 | 6.31 | 6.88 | 8.57 |
6 | 1 | -1 | 1 | 26.49 | 975 | 2 | 3.34 | 4.15 | 4.65 |
7 | -1 | 1 | 1 | 17.66 | 1125 | 2 | 5.08 | 5.02 | 6.35 |
8 | 1 | 1 | 1 | 26.49 | 1125 | 2 | 3.25 | 4.40 | 5.65 |
9 | -1.6818 | 0 | 0 | 14.6499 | 1050 | 1.5 | 7.08 | 7.22 | 8.59 |
10 | 1.68179 | 0 | 0 | 29.5001 | 1050 | 1.5 | 2.62 | 2.32 | 3.07 |
11 | 0 | -1.6818 | 0 | 22.075 | 923.87 | 1.5 | 6.06 | 6.44 | 6.77 |
12 | 0 | 1.68179 | 0 | 22.075 | 1176.13 | 1.5 | 4.08 | 4.21 | 4.77 |
13 | 0 | 0 | -1.6818 | 22.075 | 1050 | 0.6591 | 7.26 | 5.00 | 8.30 |
14 | 0 | 0 | 1.68179 | 22.075 | 1050 | 2.3409 | 5.40 | 4.98 | 6.52 |
15 | 0 | 0 | 0 | 22.075 | 1050 | 1.5 | 6.92 | 6.14 | 9.11 |
16 | 0 | 0 | 0 | 22.075 | 1050 | 1.5 | 6.75 | 4.78 | 7.73 |
17 | 0 | 0 | 0 | 22.075 | 1050 | 1.5 | 7.16 | 7.16 | 9.34 |
18 | 0 | 0 | 0 | 22.075 | 1050 | 1.5 | 7.56 | 7.92 | 6..32 |
IJSER © 2011 http://www.ijser.org
International Journal of Scientific & Engineering Research Volume 2, Issue 6, June-2011 5
ISSN 2229-5518
19 | 0 | 0 | 0 | 22.075 | 1050 | 1.5 | 7.25 | 6.88 | 8.72 |
20 | 0 | 0 | 0 | 22.075 | 1050 | 1.5 | 6.88 | 7.02 | 7.24 |
Fig. 4. Surface Plot of Surface roughness Ra µm (R1) vs Compaction load(X1), Sintering time
(X3) Sintering temperature. X2
From the fig. 4. it is quite evident that with gradual increase of compaction load and sintering temperature, surface roughness initially increases up to a maximum value(Ra
7.92)and then decreases, following a non-
linear function up to the experimental limit, sintering time being kept constant at the value of 1.5 hrs. Similar behavior has also observed on the surface roughness value with the variation of sintering time and sinter
temperature, which is depicted in fig. 5.
keeping the compaction load fixed at 22.08
Ton. Surface roughness attains a minimum value at high sintering temperature (11760C) over entire range of sintering time (0.659hr.to
2.34 hrs). The observed variation of surface roughness as manifested in figure 5 is nonlinear in nature. A change in surface roughness of the P/M components against sintering time and compaction load for a fixed
sintering temperature of 10500C has shown in
fig. 6. It is evident from the figure 6, that the
IJSER © 2011 http://www.ijser.org
International Journal of Scientific & Engineering Research Volume 2, Issue 6, June-2011 6
ISSN 2229-5518
surface roughness of the P/M components under study shows an initial increase in surface roughness and then gradual decrease with increase in compaction load. This trend
is observed for almost the entire range of
sintering time. On the contrary at low compaction load (14.65 Ton) surface roughness starts with a high value(Ra µm 7.08) at low sintering time(0.659 hr.) and changes
very little with increase in sintering time.
Fig.5 . Surface Plot of surface roughness Ra µm (R1) vs Sintering time (X3) Sintering temperature( X2).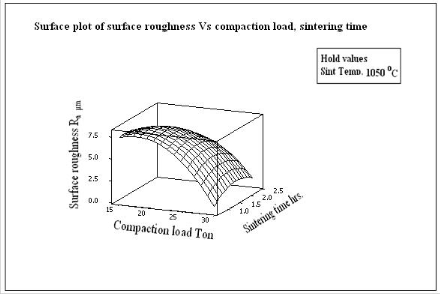
International Journal of Scientific & Engineering Research Volume 2, Issue 6, June-2011 7
ISSN 2229-5518
Fig. 6. Surface Plot of surface roughness Ra µm (R1) vs Compaction load (X1) Sintering time (X3).
From the fig. 5, it is evident that sintering time has very little effect on surface roughness. Variation of surface roughness against sintering temperature and compaction load is presented in fig.4. The figure exhibits an increasing tendency is due to change in sintering temperature from 975°C to 1176°C and compaction load from 14.65 Ton to 29.50
Ton at a fixed sintering time of 1.5 hrs. Identical nature of variation has noted in simultaneous increase of compaction load and sintering time has illustrated in fig. 6. In this fig., Compaction load has altered between
3.1. Statistical analysis
14.65 Ton to 29.50 Ton and sintering time has been changed between 0.6 to 2.3 hrs at invariant sintering temperature of 1050°C. The response variable i.e. surface roughness under consideration shows a non linear nature when it is plotted against sintering temperature and sintering time at a fixed compaction load of 22.08 Ton. (fig. 5). In this case, the range of variation of the parameters is similar to that of previous two cases. It is worth mentioning, in all the cases the hold values are mean value of the range of variation corresponding to each variable.
Analysis of Variance for Surface roughness (Ra)
Source | DF | Seg SS | Adj SS | Adj MS | F | P |
Regression | 9 | 57.3536 | 57.3536 | 6.37262 | 30.01 | 0.000 |
Linear | 3 | 34.3304 | 7.9507 | 2.65023 | 12.48 | 0.001 |
Square | 3 | 20.8885 | 20.8885 | 6.96284 | 32.79 | 0.000 |
Interaction | 3 | 2.1346 | 2.1346 | 0.71155 | 3.35 | 0.064 |
Residual Error | 10 | 2.1235 | 2.1235 | 0.21235 | ||
Lack-of-Fit | 5 | 1.6719 | 1.6719 | 0.33437 | 3.7 | 0.089 |
Pure Error | 5 | 0.4516 | 0.4516 | 0.09032 | ||
Total | 19 | 59.4771 |
IJSER © 2011 http://www.ijser.org
International Journal of Scientific & Engineering Research Volume 2, Issue 6, June-2011 8
ISSN 2229-5518
A significance test was conducted to examine the effect of different process parameters and
their inter-actions terms on the said response.
Table 5 shows the results of the significance test. The different terms used in Table 5 are as
follows.
Coefficients, standard errors, T statistics and p value for the response, Surface roughness
(Ra).
Term | Coef | SE Coef | T | P |
Constant | -129.949 | 27.8842 | -4.660 | 0.001 |
X1 | 0.386 | 0.5963 | 0.648 | 0.532 |
X2 | 0.274 | 0.0471 | 5.821 | 0.000 |
X3 | -4.222 | 5.0644 | -0.834 | 0.424 |
X1*X1 | -0.047 | 0.0062 | -7.524 | 0.000 |
X2*X2 | -0.000 | 0.0000 | -6.884 | 0.000 |
X3*X3 | -1.560 | 0.4855 | -3.214 | 0.009 |
X1*X2 | 0.001 | 0.0005 | 2.187 | 0.054 |
X1*X3 | 0.150 | 0.0738 | 2.033 | 0.069 |
X2*X3 | 0.005 | 0.0043 | 1.066 | 0.311 |
R-Sq = 96.4%
From the results of ANOVA a mathematical model has been proposed for the evaluation of surface roughness of the powder metallurgy components. The proposed model is expressed as
SRccd = -129.949 + 0.386 X1 + 0.274 X2 -
4.222 X3 -0.047 X12 -1.560 X32 + 0.001 X1
X2 + 0.150 X1 X3 + 0.005 X2 X3
Table 4 and Table 5 presents the ANOVA (Analysis of variances) and the significance
test for the second order response surface equations, which quite clearly shows that second order response surface model fit well into the observed data. This is evident from the findings that co-efficient of determination
(R2) value is 96.4 %. Hence, it may be
concluded that the prediction made by this developed model corroborates well with the experimentalobservations.
IJSER © 2011 http://www.ijser.org
International Journal of Scientific & Engineering Research Volume 2, Issue 6, June-2011 9
ISSN 2229-5518
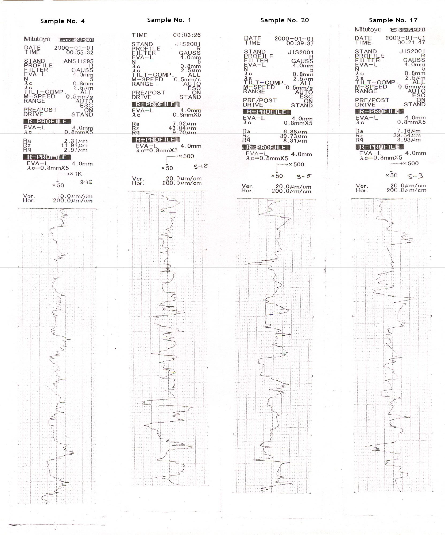
Fig.7. Comparison of surface roughness Ra of P/M samples
4. Conclusions
It is evident that the surface roughness of the P/M components under study shows an initial increase in surface roughness and then gradual decrease with increase in compaction load. This trend is observed for almost the entire range of sintering time. On the contrary at low compaction load (14.65 Ton) surface roughness starts with a high value (Ra µm 7.08)
at low sintering time (0.659 hr.) and changes
very little with increase in sintering time. It is also evident that sintering time has very insignificant effect on surface roughness. The ANOVA (Analysis of variances) for the second order response surface equations, which quite clearly shows that second order response surface model fit well into the observed data. This is evident from the findings that co-efficient of determination
(R2) value is 96.4 %. Hence, it may be
IJSER © 2011 http://www.ijser.org
International Journal of Scientific & Engineering Research Volume 2, Issue 6, June-2011 10
ISSN 2229-5518
concluded that the prediction made by this
developed model corroborates well with the
experimental observations.
References:
[1]..ASTM B946 - 06Standard Test Method for Surface Finish of Powder Metallurgy
(P/M) Products, 2010.
[2] The effect of machining on the surface integrity and fatigue life. A. Javidi, U. Rieger and W. Eichlseder, International Journal of Fatigue, Vol. 30, Issues 10-11, Pages 2050-
2055, Oct. 2008.
[3] Some aspects in the surface integrity associated with turning of powder metallurgy compacts , G.T. Smith and M.J. Allsop, Wear, Vol.150, Issues 1-2, Pages -302, Oct 1991.
[4] K. S. Narasimhan, “Recent Advances in Ferrous Powder Metallurgy,” Advanced Performance Materials, Vol. 3, No. 1, pp. 7-
27, 1996.
[5] K. S. Naransimhan, “Sintering of Powder Mixtures and the Growth of Ferrous Powder Metallurgy,” Materials Chemistry and Physics, Vol. 67, No. 1-3, pp. 56-65, 2001.
[6] H. Rutz, J. Khanuja and S. Kassam, “Single Compaction to Active High Density in Ferrous P/M Materials in Au-tomatic Applications,” PM2TEC’96 World Congress, Washington, D.C.,1996.
[7] D. Chatterjee, B. Oraon, G. Sutradhar and P. K. Bose, “Prediction of Hardness for Sintered HSS Components Using Response Surface Method,” Journal of Materials Processing Technology,Vol. 190, No. 1-3, pp.
123- 129, 2007.
[8] G. E. P. Boxes and N. R. Draper, “Emperical model building and response surfaces,” Wiley, New York, 1987.
[9] D. C. Montgomery, “Design and Analysis of Experiments,” John Wiley & Sons, New York, 1991.
IJSER © 2011 http://www.ijser.org