The algorithm has been implemented using JAVA.
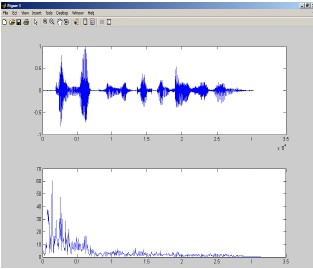
Figure1. Speech signal and its pitch frequency.
International Journal of Scientific & Engineering Research, Volume 5, Issue 2, February-2014 890
ISSN 2229-5518
Analysis and Detection of Emotional states of a person by extracting Pitch and Formants with respect to Assamese Language
-
Gauhati University
Abstract-Pitch and formant frequencies are important features in speech which are used to identify the emotional state of a person. The Pitch and Formants are first extracted from the speech signal and then their analysis is carried out to recognize 3 different emotional states of the person. The emotions considered are Neutral, Happy and Sad. The TTS-GU database has been used for the analysis. The Cepstral analysis method is used for pitch extraction and LPC analysis method is used to extract the formant frequencies.
Key words: : feature extraction, pitch, formant frequencies, emotion, cepstrum, LPC.
Speech is a means of communication and exchange of thoughts between individuals. The spoken word comprises of vowels and consonant which are the speech sound units [1]. The speaker characteristics are identified from speech data and are analyzed using suitable analysis techniques. The analysis technique aims at selecting proper frame size along with some overlap and extracting the relevant features from speech Lots of study has been carried out to investigate acoustic indicators to detect emotions in speech [8]. The characteristics that are mostly commonly considered include Fundamental frequency F0, duration, intensity, spectral variation and wavelet based features. In this paper linear feature extraction techniques and their extraction algorithms are explained. These features are then used to identify if the person is in neutral, happy or sad emotional state. The production of speech signal is considered as a convolution between the vocal track which acts as a filter and the excitation source which is the source of speech production .
In pre-processing the acoustic sound pressure wave is converted into a digital signal, which is suitable for voice
processing. A microphone can be used to convert the acoustic wave into an analog signal. This analog signal is passed through ant aliasing filter to compensate for any channel impairments. The ant aliasing filter limits the bandwidth of the signal to approximately the Nyquist rate before going through the process of sampling. Then the analog signal is passed through an A/D converter .
Today’s A/D converters for speech applications typically
sample with 16 bits of resolution with 8000–16000 samples per second. The speech is further windowed by passing it through a Hamming window and a suitable frame size of
10 to 30 m sec is chosen.
The next part is to represent the speech signal by a sequence of feature vectors. In this section, the selection of appropriate features is discussed. This is known as feature selection. There are a number of feature extraction techniques based on speaker dependent parameters like Pitch, Formants, Energy, Intensity, LPC etc which have been used previously.
Pitch is fundamental frequency of speech signal. The most widely considered areas of stress evaluation consider the characteristics of pitch . These studies consider subjective
IJSER © 2014 http://www.ijser.org
International Journal of Scientific & Engineering Research, Volume 5, Issue 2, February-2014 891
ISSN 2229-5518
assessment of pitch frequency, statistical analysis of pitch mean, variance, and distribution [7]. The pitch signal depends on the tension of the vocal folds and the sub glottal air pressure when speech is generated. There are number of techniques presented in [2] for extraction of pitch. In this paper ‘Cepstral method’ of pitch extraction has been implemented.
The analog signal is converted to digital by sampling with a suitable rate and quantized. The digital signal is then hamming windowed to convert it into a suitable frame size. The signal is converted into frequency domain by using Fast Fourier Transform. The absolute values of the signal are considered and then the logarithm of the signal is obtained. The signal is then transformed into Cepstral domain by taking its IFFT. The very first signal peak represents the pitch frequency. The result has been shown in figure 1. The original speech signal in time domain along with the extracted pitch frequency is shown in figure.
The algorithm has been implemented using JAVA.
Figure1. Speech signal and its pitch frequency.
Formants are defined as the spectral peaks of sound spectrum, of the voice, of a person. In speech science and phonetics, formant frequencies refer to the acoustic
resonance of the human vocal tract [6]. They are often measured as amplitude peaks in the frequency spectrum of the sound wave. We have considered the first 3 formants f1, f2, f3 for analysis of emotions. For different vowels, the range of f1 lies between 270 to 730 Hz while the range of f2 and f3 lie between 840 to 2290 and 1690 to 3010 Hz respectively[1]. Formant frequencies are very much important in the analysis of the emotional state of a person. [10].
The Linear predictive coding technique (LPC) has been used for estimation of the formant frequencies [3]. The analog signal is converted in .wav digital format. The signal is transformed to frequency domain using FFT and the power spectrum is further calculated. Then the signal is passed through a Linear Predictive Filter (LPC) with 11 coefficients and the absolute values are considered. The roots of the polynomial are obtained which contain both real and imaginary parts. The phase spectrum is further displayed which clearly shows the formant frequencies. The first five formant frequencies are displayed in the graph. Figure 2 shows the formant frequency plot along with the original speech signal. The five formant frequencies obtained are
230 Hz, 800 Hz, 1684 Hz, 2552 Hz, 3159 Hz respectively.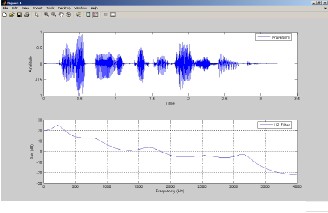
![]()
Figure2. Speech signal and its formants.
The TTS-GU database has been used in the analysis part. Speech Technology Development Lab (Gauhati University)
was to analyze Phonetic Reductions and Elaborations in
IJSER © 2014 http://www.ijser.org
International Journal of Scientific & Engineering Research, Volume 5, Issue 2, February-2014 892
ISSN 2229-5518
Emotional Speech and to detect acoustic correlates in the emotional speech which was funded by the MIT (Govt, of India) An emotional database was created which comprises of 6 basic emotions (anger, joy, sadness, fear, disgust and boredom) as well as neutral speech. Ten professional native speakers (5 females and 5 males) simulated these emotions.
10 utterances (5 short and 5 longer sentences), which are
used in every-day communication were uttered in all emotions . The recordings were made using a Zoom H4n in an anechoic chamber. The database contains about 1000 sentences with 7 emotions of 10 speakers to test the recognisability and naturalness of the emotions. The utterances for which the emotion was recognized by at least
80 % of the listeners is present in the database which is used
for further analysis.
Number of Speakers | Pitch Frequency for Neutral Emotion in Hz | Pitch Frequency for Anger Emotion in Hz |
Speaker 1 | 143.8631 | 368.2 |
Speaker 2 | 198.7420 | 252.4 |
Speaker 3 | 102.9377 | 277.4 |
Speaker 4 | 168.5327 | 344.1 |
Speaker 5 | 106.4718 | 218.4 |
Speaker 6 | 118.7 | 374.8 |
Speaker 7 | 112.5963 | 359.2 |
Speaker 8 | 100.5 | 496.5 |
Mean | 130.947 | 336.068 |
Table 1. Pitch frequencies of eight speakers for Neutral
And angry conditions
speakers is quite different and lies in a particular range. The pitch frequency is much lesser for Neutral speech than Angry speech. The mean of Pitch frequency for Neutral emotion is 130 Hz where as it is 336 Hz for Angry emotion. Thus pitch can be considered as a clear indicator to identify the emotions Neutral and Angry from the speech of a person.
The emotion Happy is recognized satisfactorily using the Formant Frequency estimation method. Table2.Given below shows the range of formant frequencies f1, f2 and f3 for the emotion Happy for five different speakers. It is clearly seen that they lie in a particular range. The mean for formant frequency f1 is 338, for f2 is 802 Hz and for f3 is
1628 Hz respectively. Thus the emotion Happy can be
easily identified from the formant frequency analysis. Such a trend is not indicated by the emotions Neutral and Angry with respect to the formant frequencies.
Emotion Happiness | Formant frequency f1 in Hz | Formant frequency f2 in Hz | Formant frequency f3 in Hz |
Speaker 1 | 258.2 | 772.4 | 1735.9 |
Speaker 2 | 548.7 | 881.5 | 1796.7 |
Speaker 3 | 269.1 | 740.7 | 1617.0 |
Speaker 4 | 321.7 | 728.7 | 1504.4 |
Speaker 5 | 293.1 | 891.0 | 1490.1 |
Mean | 338.16 | 802.86 | 1628.82 |
Table 2. Formant frequencies for 5 speakers for the emotion Happy
Analysis of speech signal to identify the 3 emotional states Neutral, Angry and Happy from the speech signal has been carried out using Pitch and Formant Frequencies as the basic features. From the results obtained it can be clearly seen that Pitch is the best feature to identify the two emotions Neutral state and Angry. This is shown in table 1 below. The results indicate that the range of pitch frequency for Neutral and Angry emotion for eight
It is seen that different emotional states spreads over different frequency bands. The three emotions Happy, Sad and Neutral have been recognized using Pitch and Formant Frequencies. Pitch estimation using Cepstral analysis is carried out for Neutral and Anger emotions for eight speakers using Assamese language database. It is seen that
pitch has higher frequency range for Anger emotion than
IJSER © 2014 http://www.ijser.org
International Journal of Scientific & Engineering Research, Volume 5, Issue 2, February-2014 893
ISSN 2229-5518
speech produced under Neutral condition. Formant frequency estimation is done using LPC analysis which extracts the first three formant frequencies. The format frequencies for Happy emotion are centered around 338
Hz, 802 Hz and 1628 Hz respectively. Thus it is seen that Pitch calculation for speech signal gives better results for Neutral and Angry emotions than the formant frequency estimation method. Happy emotion is recognized satisfactorily using LPC based formant frequency estimation method.
[1] “Digital processing of speech signals.” L.R. Rabiner,
R.W.Schafer, Pearson education.
[2]“A Comparative Performance Study of Several Pitch Detection
Algorithms”, IEEE Transactions on acoustics, speech, and signal
processing, VOL. ASSP-24, NO. 5, October 1976.
[3] “A Comparative Study of Formant Frequencies Estimation
Techniques” Dorra Gargouri, Med Ali Kammoun and Ahmed
Ben Hamida, ENIS, University of Sfax TUNISIA, Proceedings of the
5th WSEAS. International Conference on Signal Processing, Istanbul, Turkey, May 27-29, 2006 (pp15-19).
[4]“Speech Under Stress: Analysis, Modeling and Recognition”. John
H.L. Hansen and Sanjay Patil, M¨uller (Ed.): Speaker
Classification I, LNAI 4343, pp. 108–137, 2007.
[5] Karl swail, J.H.L. Hansen, “The impact of speech under ‘stress’ on
military speech technology”, NATOAC /232/ IST/TG-
01(Formerly RSG.10) Research study group on speech,2000
[6] “Speech Under Stress Conditions: Overview Of The Effect
On Speech Production And On System Performance” Herman J.M.
Steeneken TNO Human Factors Research Institute,
Soesterberg,.
[7]”A Framework for Automatic Human Emotion Classification using
Emotion Profiles” Emily Mower, IEEE Transactions on
Audio, Speech and Languare Processing, Vol 19, July 2011.
[8] T.L. Nwe, Analysis and Detection of Human Stress and Emotion
from Speech Signals, Ph. D. Thesis, National University of Singapore,
2003.
[9]Emotion recognition from Assamese speeches using MFCC features
and GMM Classifierby Aditya Kandali | Papers by
Aditya "Co-authored with A. Routray and T. K. Basu" "published in
Proceedings of IEEE Region 10 Conference 2008,
Hyderabad, India"
[10]”Adaptation of pitch and spectrum for HMM-based speech
synthesis using MLLR,” by M. Tamura, T. Masuko, K. Tokuda,
and T. Kobayashi, Proc of IEEE International Conference on Acoustics,
Speech and Signal Processing, vol. 1, pp. 805–808, May 2010.
[11] “Emotions and Voice Quality: Experiments with Sinusoidal
Modeling” by Carlo Drioli, Graziano Tisato, Laboratory of Phonetics
and Dialectology ISTC-CNR, Institute of Cognitive Sciences and
Technology, ITALY.
[12] “Recognition of emotions in speech by a hierarchical approach”,
Affective Computing and Intelligent Interaction and Workshops,. ACII
2009. 3rd International Conference on 10-12 Sept. 2009 page(s): 1 - 8
Amsterdam 2009.
![]()
[13] M.Kotti, F.Patterno and C.Kotropoulos, “Speaker- independent negative emotion recognition” in Proc. 2nd Int. Workshop Cognitive Information Processing, Elba Island, Italy,pp. 417-422, June, 2010.
IJSER © 2014 http://www.ijser.org