International Journal of Scientific & Engineering Research, Volume 4, Issue 8, August-2013 1006
ISSN 2229-5518
An Approach for Determining Angle of Rotation of a Gray Image Using Weighted Statistical
Regression
Joydev Hazra, Aditi Roy Chowdhury, Paramartha Dutta
Abstract— This article presents a computationally efficient method to estimate two dimensional in place rotation. This method is based on the estimation of weighted linear regression lines of the reference and the sense image pair. Angle between these two regression lines can identify the rotational angle between the reference and sense images. This fully unsupervised technique offers convincing result for wide range of images, without any need for setting control points. Another important contribution is that in composite rotation this method can effectively identify cumulative angle of rotation. The experiments show that the proposed method is robust and can be applied on various kind of image applications. Comparison with existing methods suggests the supremacy of the present one over its existing competitors.
Index Terms— Axis of symmetry, Composite Rotation, Hessian Matrix, Image Rotation , Index of symmetry, Weighted Centroid, Weighted Linear Regression Line.
1 INTRODUCTION
—————————— ——————————
MAGE processing has a huge research spectrum. Since several years, a lot of studies figure for image understanding and image analysis. Some research areas in
$2$D image analysis are multi-modality fusion [1], image coding, enhancement, compression, segmentation [2], [3], texture analysis, visual inspection, recognition and registration [4],[5],[6] etc. Image matching and image registration take an important role in computer vision, image sensing, image/video processing, etc. Transformation estimation is an important step of image matching.
1.1 Review
Over the years, research on image registration has offered a lot of methods. Typical examples include methods like image correlation functions, principal axis method, Fourier transform based methods, image feature based methods [7] and so on. Rotation detection is an important part in image matching.
Fourier-Mellin Invariant property is widely used in transformation detection. The Fourier transform has certain properties under rotation,scale,translation transformations that make it useful for rotation estimation. Rotating an image in the spatial domain by angle θ is equivalent to rotating the magnitude of its Fourier transform by -θ [8]. Scale and translation-invariant domain are used to recover rotation.
Log-polar method is one of the technique to estimate rotation [9]. Rotation invariance property of log- polar mapping is used to compute rotational angle. Different projection techniques are used on sense and reference images and estimation of rotation becomes the problem of estimating
————————————————
• Author Joydev Hazra,Heritage Institute of Technology India. E-mail:
joydevhazra@gmail.com
• Co-Author Aditi Roy Chowdhury, Netaji Subhash Engg. College,India. E-
mail: aditihi2007@gmail.com
• Co-Author Dr. Paramartha Dutta Visva-Bharati University,
Santiniketan,,India. E-mail: paramartha.dutta@gmail.com
the shift between two one-dimensional signals.
In [10] the authors use the pseudo-polar transform to
achieve some level of improved approximations of the polar
and log-polar Fourier transforms of an image. Here rotations
are reduced to translations which are estimated using phase
correlation. 1D FFT operations are used to make it much faster
than 2D FFT.
PCA (Principal Component Analysis) [11] can be used to detect rotation. Thresholding, edge detection or other image segmentation methods are used at first on the image. The mean vector and the covariance matrix are computed along
with its eigenvector e. Two elements of eigenvector e1 and e2
helps to evaluate object rotation around the center.
In Phase-Only Correlation (POC) [12] et al. (or simply a
“phase correlation”) the rotation angle between two images is
also estimated. First convert the image rotation into the image
shift by polar mappings of the amplitude spectra of images,
and then estimate the translational displacement between the
polar mappings to obtain the rotation angle. Computational
cost of 2D POC can be reduced using 1D. Here 1D POC functions for every pair of row lines in two polar mappings of two images are calculated, and then summarize all 1D POC functions to obtain rotational angle.
In [6], symmetry measure is used to detect the registration angle. Angle between symmetry axes of reference and sense images provide the actual value of angle of rotation. For symmetric images, this method takes a lot of computation time. This is because here symmetry axis SMθ is calculated for each possible value of θ on the pair of reference and sense images. The angle of the symmetry axis in image f is defined as θm =Maxθ (SMθ (f)). From this point of view it is quite time hungry.
IJSER © 2013 http://www.ijser.org
International Journal of Scientific & Engineering Research, Volume 4, Issue 8, August-2013 1007
ISSN 2229-5518
In [13] different images symmetric or non-symmetric are registered using correlation with Nelder-mead simplex (NM) method [14] for function minimization. But the computational overhead of this method is very much dependent on the information inherent in the image. For images having narrow spectrum of gray level representation, this method takes more time to find the value at which the maximum correlation can be observed, as NM simplex method algorithm goes to
Consecutive rotation means to rotate the image by an angle θ1 and to rotate that rotated image further by an angle θ2 and so on upto θn . These consecutive rotations on the image is same as composite rotation of the image at an angle (θ1 + θ2 +
...+ θn ). This is because mathematicalty,
2.2 Line of regression
expansion. In order to achieve high levels of accuracy, different reference samples are required. Moreover, it is
cos(θ1
+ θ 2 )
− sin(θ1
+ θ 2 ) 0
devoid of independent functionality due to its inherent
sin(θ1 + θ 2 )
cos(θ1 + θ 2 ) 0
requirement of external intervention for the purpose of choosing threshold parameter.
cosθ
− sin θ
0
0 cosθ
− sin θ 0
In the present article, we use weighted linear regression
1 1 2 2
technique to identify the rotational angle between the
= sin θ1
cosθ1
0 • sin θ 2
cosθ 2 0
reference image and the sense image. Statistically line of regression offers the line of symmetry of an image. In our experiments, index of symmetry is chosen to provide more
accurate result than symmetry measure [6]. Our method performs registration comparison at global level and is fully unsupervised being applicable on any type of image encompassing medical and non-medical. We apply our methodology to compare the performance with rotational registration [6], [13] algorithms based on symmetry measure.
The statistical linear regression model is
Y = α + βx + ε
(2)
The paper is organized as follows. Section 2 revisits concepts relevant to the area of rotation registration. The proposed procedure is described in details in Section 3. Section
4 presents registration results. Section 5 reports comparison with the other algorithm. Section 6 contains conclusion along with the discussion on the results.
2 METHODOLOGY
This section is devoted for quick recapitulation of the relevant concepts like rigid geometric transformation and line of
where Y is the known dependent variable, α and β are
unknown parameters subjected to statistical estimation, X is
the known independent variable and ε is the error
representing the component left unexplained by the above
model [15].
The Sum of Square Error (SSE) in the quantitative measure
of the error induced by a specific choice of α and β. The SSE is
given by
Incidentally the estimated α and β obtained by minimizing
regression.

SSE = (Y − α + βx) 2
(3)
2.1 Rigid Geometric Transformation
Rigid geometric transformation means mapping the pixel coordinates of the reference image into another coordinate system to form the sense image. Rigid transformation deals with transformation where shapes and angles are preserved under transformations like rotation, scaling and translation. Rotational transformation mainly preserves lengths (distance between two points), angles (angle between two lines) and area of the image. Mathematically, rotation by an angle θ is represented by
the SSE indicates the best linear regression fit of dependent variable Y on independent variable X in respect of the statistically minimum variance estimates of α and β.
3 PROPOSED METHOD
We now explain the procedure for the computation of axis of symmetry of both fixed(reference) and rotated(sense) images.
3.1 Foundation
Rotation is computed considering the centroid of an image as the origin. Let f(i,j) be the gray intensity value of an image of size M×N. The intensity weighted centroid (Cx ,Cy ) of the
x'
cosθ
− sin θ
0 x
image is calculated.
To find the regression line of the object passing through
y' = sin θ
cosθ
0 • y
(1)
the centroid, we calculate (i) the line passing through the
1 0
0 1
1
centroid as well as (ii) find minimum weighted sum from all
the image pixels suspended perpendicularly upon the line. Here weights are the corresponding pixel intensities. Thus we find
where, (x,y) is a typical pixel coordinate in the original image, (x’,y’) is the coordinate in the rotated image.
IJSER © 2013
Let,
http://www.ijser.org
International Journal of Scientific & Engineering Research, Volume 4, Issue 8, August-2013 1008

ISSN 2229-5518
min
∑ ∑ f ( x, y) ( y − mx + c)
(4)
This minimum value is called index of symmetry. Index of symmetry attaining value zero means perfect symmetry. For
m,c
x =0 y =0
(1 +
m 2 )
regular shaped object with uniform intensity distribution this
value is zero.
Equation (5) is minimum at (mˆ , cˆ) if
∂φ ∂m = 0 and
M −1 N −1
φ = ∑ ∑ f ( x, y)
( y − mx + c) 2
2
(5)
x =0 y =0
(1 + m )
∂φ ∂c = 0 and the hessian matrix

is positive definite at (mˆ , cˆ).
∂ 2φ
∂ 2φ
∂m 2
∂ 2φ
∂m∂c
∂ 2φ
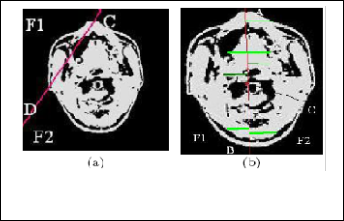
Fig. 1. (a) Brain image and any line CD that is not axis of symmetry of that image. (b) Brain image and axis of symmetry AB passing through centroid C.
∂c∂m
∂c 2
In Fig. 1(b) C is the centroid. AB is the line of
From ∂φ
Or,
∂m = 0 and ∂φ
∂c = 0 at (mˆ , cˆ) we have
regression passing through C. It divides the image into two regions F1 and F2 . For any pixel (x, y) Є F1 or (x, y) Є F2 we can draw perpendicular line on the line segment of regression AB. The difference between the sum of perpendicular distance
M −1 N −1
∑ ∑ f ( x, y) xy
on AB from each pixel (x, y) in the region F1 and sum of perpendicular distance on AB from each pixel (x, y) in the
x =0 y =0
M −1 N −1
mˆ
= B
cˆ
(7)
region F2 must be minimum. But in case of other arbitrary lines like CD in Fig. 1(a) the difference between weighted sum
∑ ∑ f ( x, y) y
of two regions F1 and F2 may not be minimum.
Where,
x =0 y =0
M −1 N −1
The above idea can be presented in another way. Any arbitrary line $AX + BY + C = 0$ can be the axis of symmetry of any image if for any pair of image pixels (x,y) and (x',y'), (i) the difference between the image intensities at those coordinates is minimum and (ii) the difference between the
∑ ∑ f ( x, y) xy
perpendicular distance from those coordinates is minimum.
mˆ
= B
cˆ
−1 x =0 y =0
M −1 N −1
(8)
Mathematically,
(i) f(x,y) - f(x',y') is minimum as well as
∑ ∑ f ( x, y) y
x =0 y =0
Basically, the axis of symmetry decomposes the image into
(ii) d(Ax + By + C) - d(Ax' + By' +C) is minimum,
where, (x,y), (x',y') are the coordinates of an image, f() is the
intensity of the image at any given coordinate and d() is the
perpendicular distance of any image pixel upon the line. Then
the line AX + BY + C = 0 can be the axis of symmetry of that
image. For any perfect symmetric object with uniform
M −1 N −1
∑ ∑ f ( x, y) x 2
B = x =0 y =0
M −1 N −1
∑ ∑ f ( x, y) x
x =0 y =0
M −1 N −1
∑ ∑ f ( x, y) x
x =0 y =0
M −1 N −1
∑ ∑ f ( x, y)
x =0 y =0
intensity distribution this difference ideally boils down to zero. Line of regression passing through centroid can be treated as the axis of symmetry of the image content.
It may be noted that there are regular geometric representations which may be perfect in the sense that they may have multiple axes of symmetry. For example, perfect circle, perfect squares etc. with uniform intensity distribution have infinitely many axis of symmetry. However, in real life
two nonoverlapping regions F1 and F2 such that difference
between the weighted sums of the two regions is minimum. i.e.,
situations the scope of encountering such perfect geometric structures is limited. In case of such an eventuality, our proposed method may be applied with respect to any choice of axis of symmetry out of various choices of axes of symmetry inherent in such structures. Accordingly, in such situations our proposed method will offer various alternative solutions.

∑
( x , y )∈F1
f ( x, y) −

∑ f ( x, y)
( x , y )∈F2
is minimum.
IJSER © 2013 http://www.ijser.org
International Journal of Scientific & Engineering Research, Volume 4, Issue 8, August-2013 1009
ISSN 2229-5518
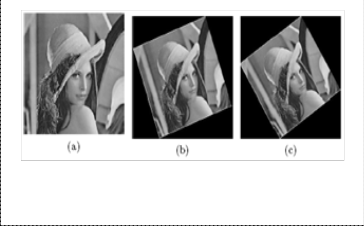
Fig. 3. (a) Lena image. (b) After 200 anticlockwise rotation of (a). (c) After 330 anticlockwise rotation of (a).
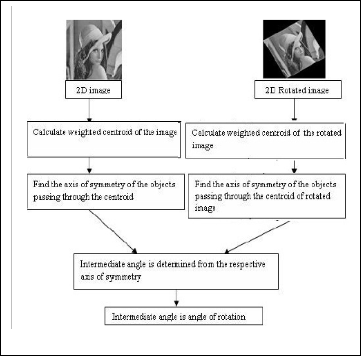
Fig. 2. Flowchart of the proposed method.
3.2 Our Algorithm
To solve the problem of rotational transformation, we compute the index of symmetry of the reference and sense images. So, the angular difference between the respective indices of symmetry of the reference image vis-a-vis the sense image, indicates the angle of rotation of the sense image with respect to the reference image. Using our method the indices of symmetry of the original image and the rotated versions of the image can be represented in table 1.
In case of consecutive rotation, this method can be
TABLE 1
EFFECT OF ANGULAR CHANGE ON AXIS OF SYMMETRY
adopted for the cumulative amount of combined rotation
with respect to the reference image. For example, if the sense image is produced using two consecutive rotation θ1 and θ2 respectively on the reference image (first θ1 rotation followed by θ2 rotation) then this method can easily identify the combined rotation (θ1 + θ2 ) to produce the sense image from the reference image. Figure 5(a) is the original image. This image is rotated at an angle of 400 as represented in fig. 5(b). Again this rotated version is re-rotated at an angle 300 further as shown in fig. 5(c). So, the reference image is rotated through an angle (400+300) i.e, 700 and the sense image is produced. Our proposed algorithm can easily identify this combined rotation as shown in the experiment section. For different types of rotation either single or consecutive our proposed method offers better result in terms of accuracy and time complexity than what reported in symmetry based method [6].
3.3 Limitation
The method proposed in this paper has the limitation that it can only be used to compute the rotational angle if the rotated version preserves information of original image.
4 EXPERIMENT
We carry out extensive experiments on our algorithm with different types of image inputs to confirm its performance. Some of them are reported here.
4.1 Experimental setup
The algorithm is implemented by using MATLAB
7.5.0 on a Core 2 Duo processor, 1.8 GHz, 2 GB RAM
computer. Let the rotation angle is positive along
anticlockwise direction.
4.2 Result
We applied our method on different types of images encompassing medical as well as non-medical applications such as remote sensor data, photography etc. Our method was applied on original image. Then the original has been rotated by a given angle using the bilinear interpolation method and our method of axis of symmetry has been identified. It appears from the observations that the axis of symmetry also undergoes a rotation by the similar amount in the figure. In other words, any rotation either simple or composite, induces
IJSER © 2013 http://www.ijser.org
International Journal of Scientific & Engineering Research, Volume 4, Issue 8, August-2013 1010
ISSN 2229-5518
rotation of similar amount on the unique axis of symmetry of the image. This feature is being explored by our proposed algorithm. We take anticlockwise rotation as positive rotation. Figure 6 shows lena image being experimented with.
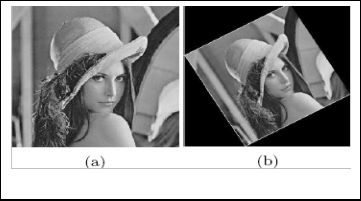
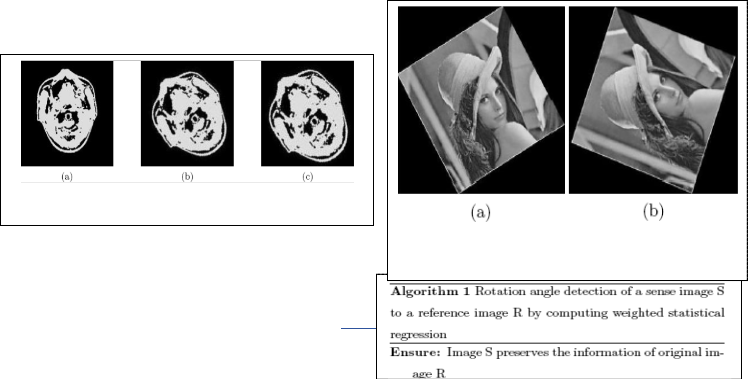
through new centroid. Thus, the angle between these two lines is 300. So, it is observed that our method offers accurate result in this situation. Again fig. 7(a), 7(b) show consecutive rotations of the original image of lena (fig. 6(a)) by an angle 300 first (fig. 7(a)) followed by further by an angle 400 (fig. 7(b)).
Fig. 4. (a) After 750 anticlockwise rotation of 3(a). (b) After 100
clockwise rotation of 3(a).
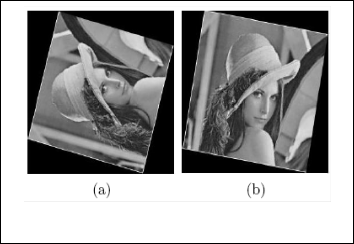
TABLE 2
PERFORMANCE OF OUR METHOD FOR DIFFERENT IMAGES W ITH
DIFFERENT ANGLE OF ROTATION
Fig. 6. (a) Lena image. (b) After 300 anticlockwise rotation of (a).
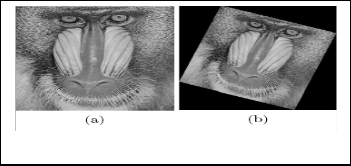
Using our method, we find the angle as 700 (1100 of rotated image - 400 of original image). Figure 8(a) shows baboon images of size 350×350. We rotate this image -200 (i.e., clockwise direction) which is represented in fig. 8(b). Using our method, we can find that the difference between two lines of regression is -200 indicating accurate result offered by our method. Next fig. 9(a) shows brain image with size 167×166 and rotated by 30 as available in fig. 9(b). This rotation is similarly captured by our method. The result of experiments are reported in table 2.
4.2 Complexity
Given an image of size MxN, the centroid of the image can be computed within O(MN) operations. Image rotation algorithm uses O(MN) operations to detect axis of symmetry of both reference and sense images.
Therefore overall complexity of the proposed algorithm is O(MN).
Fig. 5. (a)Brain image (b) After 400 anticlockwise Rotation of (a).(c) After
300 anticlockwise rotation of (b).
The size of the image is 217×218. Figures 6(a), 6(b) show original lena image and rotation after 300 respectively. In original image, line of regression makes an angle 400 with the vertical line passing through the centroid. In fig. 6(b) this line of regression makes an angle 700 with the vertical line passing
IJSER
http://ww
Fig. 7. (a) After 300 anticlockwise rotation of fig. 6(a). (b) After 400
anticlockwise Rotation of (a).
International Journal of Scientific & Engineering Research, Volume 4, Issue 8, August-2013 1011
ISSN 2229-5518
TABLE 3
COMPARISON W ITH OTHER EXISTING METHODS
5 COMPARISON WITH OTHER EXISTING METHODS
The SM method [6] used symmetry measure for rotation registration. Here main idea is that the symmetry measure is at its maximum when the possible symmetry axis is the real symmetry axis. But this method takes O(N3) comparison to find the symmetry axis of any image of size NxN. In paper [13], NM simplex method is used for function minimization. But for images having narrow spectrum of gray level representation this method takes O(N3) computation.
Examples of observations in various images like fig.
10, 11, 12 are displayed. Table 3 indicates a comparison among
NM simplex, SM(Symmetry Measure) and our proposed
method under same experimental setup.
Fig. 8. (a) Baboon image. (b) After 200 clockwise rotation of (a).
From table 3, it is clear that our proposed algorithm performs qualitatively better in comparison to other two methods namely SM, NM correlation for both symmetric and non-symmetric images. Here we append the histogram of the data obtained by respective methods and our method in fig.
13.
Nature of histograms indicate that the statistical dispersion of our method is convincingly smaller in comparison to other counterparts. Histograms of other two existing methods indicate multimodal tendency. It is difficult
to use any known commonly used statistical distribution to represent the results generated by these algorithms. As a result, we have opted for non parametric statistical test for comparing these two techniques vis-a-vis ours.
We have three sets of data, obtained in the form of results by using the normalized distance measure of our algorithm, NM correlation and symmetry measure. Each data set contains 100 elements. Now, we apply Kolmogorov- Smirnov (K - S) two sample non-parametric test on two data sets X and Y for testing the equality of two unknown distributions yielding the respective data sets. This is because these two sets of data are coming from possibly two distinct unknown distribution functions FX and FY respectively. Here we resort to nonparametric statistical test in order to avoid any specific bias that might crop up due to an assumption regarding the nature of underlying distribution, the respective
IJSER © 2013 http://www.ijser.org
International Journal of Scientific & Engineering Research, Volume 4, Issue 8, August-2013 1012
ISSN 2229-5518
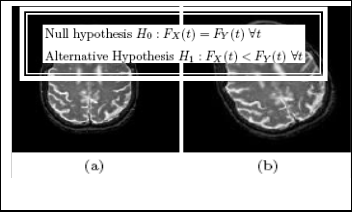
data sets are coming from. Depending on the nature of the alternative hypothesis, the test will offer, whether there is any stochastic ordering, among the random variables X and Y and, if there be any such ordering, which of the two is stochastically smaller than the other. X1 , X2 , ... , Xm and Y1 , Y2 , ... , Ym are independent random samples from populations having distributions FX and FY .
TABLE 4
COMPARATIVE PERFORMANCE OF OUR ALGORITHM, NM CORRELATION AND SM METHOD
test on data set 1 and data set 3. Maximum difference between the cumulative distributions D is 0.6238 i.e. D - = max (F3 -F1 )
= 0.6238 > 0.1920 (tabulated critical value). The test rejects the
null hypothesis at the 5% significance level. In other words,
this test accepts the alternative hypothesis with 95%
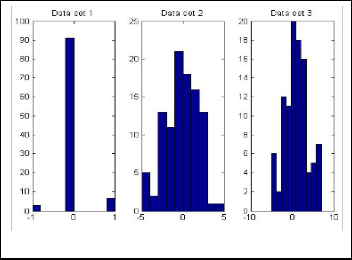
Fig. 10. (a) MR image. (b) After 250 anticlockwise Rotation of (a).
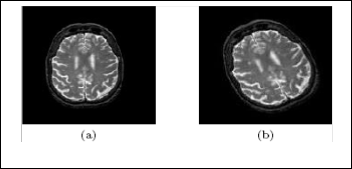
Fig. 13. Histogram of data sets
confidence that the first algorithm or data set 1 is stochastically smaller than data set 3 generated by SM method.
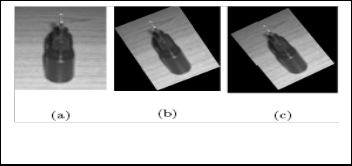
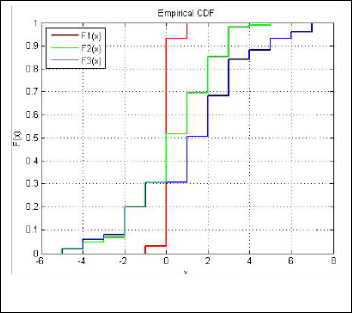
Fig. 11. (a) MR image. (b) After 380 anticlockwise Rotation of (a).
Fig. 12. (a) MR Original image. (b) After 270 anticlockwise Rotation of
(a). (c) After 500 anticlockwise Rotation of (b).
We apply K-S test on data set 1 and data set 2. Maximum difference between the cumulative distributions D is 0.4158 i.e. D- = max (F2 -F1 ) = 0.4158 > 0.1920 (tabulated critical value). The test rejects the null hypothesis at the 5% significance level i.e, this test accepts the alternative hypothesis that the data set
1 is stochastically smaller than data set 2. Again, we apply K-S
Fig. 14. Empirical cumulative distribution function of data set 1, 2 and
3.
IJSER © 2013 http://www.ijser.org
International Journal of Scientific & Engineering Research, Volume 4, Issue 8, August-2013 1013
ISSN 2229-5518
6 CONCLUSION
This paper presents a novel technique to estimate two dimensional rotation in registering two different images of same object. The reference and sense images differing due to rotation or combination of rotations can be registered. The technique presented here can be applied on wide variety of image applications including medical or non-medical. This method is comparatively efficient as it only calculates the weighted linear regression line of both reference and sense images. This algorithm performs well for those images taken from same sensor, having same information. But for regulating images taken from different viewpoint or from different sensors or having different information content is beyond the scope of the proposed technique. However, the authors are presently engaged in that problem.
REFERENCES.
[1] P. Burt, R. Lolczynski “Enhanced Image Captured Through Fusion,” 4th
International Conf. on Computer Vision , pp. 173-182, 1993.
[2] P. Dutta, S. Bhattacharyya, U. Maulik, “A Pruning Algorithm for Efficient Image Segmentation with Neighborhood Neural Network”, IAENG International Journal of Computer Science, vol. 35 no. 2,pp. 191-
200, 2008.
[3] P. Dutta, S. Bhattacharyya, U. Maulik, “Multilevel Image Segmentation with Adaptive Image Context Based Thresholding,” Applied Soft Computing,vol. 11, no. 1,pp. 946-962, 2011.
[4] D.H. Hristov and B.G. Fallone, “A Grey-level Image Alignment Algorithm for Registration of Portal Images and Digitally Reconstructed Radiographs”, Med. Phys.,vol. 23, pp. 75-84, 1996.
[5] Z. Yang and F. S. Cohen, " Cross-Weighted Moments and Affine Invariants for Image Registration and Matching," IEEE Transactions On Pattern Analysis and Machine Intelligence,vol. 21,no. 8, Aug. 1999.
[6] X. Yang, J. Pei, W. Xie, ” Rotation Registration of Medical Images
Based on Image Symmetry”, ICIC 2005, Part I, LNCS 3644,pp. 68-76,
2005.
[7] L.G. Brown, "A Survey of Image Registration Techniques", ACM Comput Sur, vol. 24, no. 4, pp. 325-376, 1992.
[8] M. McGuire, “An Image Registration Technique for Recovering
Rotation, Scale and Translation Parameters,” NEC Tech Report, 1998. [9] V.J. Traver and F.P. Goto, “Estimation of Translation, Rotation and
Scaling in Log-polar images Using Projections,” NEC Tech Report,
1998.
[10] Y. Keller, A. Averbuch, M. Israeli, “Pseudo-polar Based Estimation of Large Translations, Rotations and Scalings in Images,” IEEE transaction on image processing, pp. 12-22,2005
[11] M. Mudrov´a, A. Proch´azka, “Principal Component Analysis in Image Processing,” In Proceeding of Automatic Face and Gesture Recognition, 1998.
[12] S. Nagashima, K. Ito, T. Aoki, H. Ishii, K. Kobayashi, “A High-
Accuracy Rotation Estimation Algorithm Based on 1D Phase-Only
Correlation,” Springer-Verlag Berlin Heidelberg, pp. 210-221, 2007. (Journal or magazine citation)
[13] M. Holia and V. K. Thakar “Image Registration for Recovering Affine
Transformation using Nelder Mead Simplex Method for Optimization,”
International Journal of Image Processing (IJIP), vol. 3, pp.218-221, 2009
[14] J. A. Nelder and R. Mead, “A Simplex Method for Function Minimization,”
Computer Journal 7, pp. 308-313, 1965.
[15] A.M. Goon, M.K. Gupta, B. Dasgupta, An Outline of Statistical Theory.
Volume 1, The World Press Private Limited. ISBN: 81-87567-34-1.
IJSER © 2013 http://www.ijser.org