
International Journal of Scientific & Engineering Research, Volume 5, Issue 12, December-2014 154
ISSN 2229-5518
Alternative Management Plan for Flash Floods/ Flows of Mithawan Hill Torrents in Pakistan Zeshan Yasin1, Ghulam Nabi2
Abstract— Water is a back bone not only for Agriculture but for every industry. One of the major sources of water is the Hill Torrents which emerges from the mountains and diverted towards Agriculture fields for irrigation. Due to steep gradient, flood flows with high velocity which results in damaging to standing crops, irrigation system, houses, roads and sometime human lives also. The flood of hill torrents having a lot of potential for agriculture to meet the shortage of food if manage wisely. Dera Ghazi Khan (D.G. Khan) hill torrent zone is one of the largest zone in Punjab province of Pakistan which emerge from mountains of Suleiman range. Mithawan Hill Torrent is one of the largest hill torrents of D.G. Khan Zone. Different options have been studied during this research to know that how the barren land will convert into lush green fields to meet the food requirements of the country. Peak discharge of Mithawan at Darraha was estimated
79,045 cusecs 1 at 25 year return period by interpolating rainfall data. The study includes detail analysis and investigations of four options
for Mithawan Hill Torrent management. The 6000 cusecs discharge of Kachhi Canal is beneficial for the agriculture of Baluchistan province of Pakistan only if safe cross drainage structures will propose at the crossing of Mithawan Hill Torrent. Result of the study revealed that flow of Mithawan hill torrent can be managed through a number of ways. It is concluded that flow of Mithawan can be managed by a combination of reservoir and utilization in pachad 2 area (Option-4). Present study will be helpful in developing the Agro based community in the Hill torrents affected areas and for the design of cross-drainage structures & storage reservoir at different locations.
Key Words— Agriculture, Pachad Area, HEC Geo-RAS, HEC-RAS, Alternative management plan, Arc-GIS, EAC 3, Cross Section.
—————————— ——————————
1-Research Associate, Centre of Excellence in Water Resources Engineering, University of Engineering and Technology, Lahore, Pakistan, zeeshi862@gmail.com, 92 300 4018638
2-Assistant Professor, Centre of Excellence in Water Resources
Engineering, University of Engineering and Technology, Lahore, Pakistan, gnabi60@yahoo.com, 92 42 99250256-57
![]()
1 It’s a unit of volume i.e. cubic feet per second
2 Area Irrigated with hill torrent water.
3 Elevation Area Capacity Curve
IJSER © 2014 http://www.ijser.org
International Journal of Scientific & Engineering Research, Volume 5, Issue 12, December-2014 155
ISSN 2229-5518
Hill Torrents contributes about 65% (517,461 Sq. Km) area of Pakistan and almost entire area of Baluchistan (347,190 Sq. Km) [9]. The pattern of rain fall in D.G. Khan hill torrent areas is very un-realistic as a year with heavy rain fall in catchment generating intense run-off may followed a drought year with low or no rainfall. This zone falls in arid to semi arid zone as average annual rain fall is of the order of
400 mm.
Mithawan Hill Torrent leaves the mountains near village
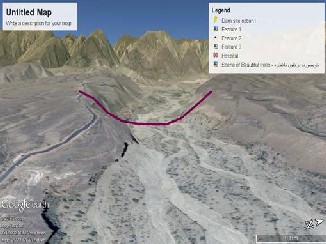
Choti Bala and fans out in pachad area into number of creaks. These are Northern Branch, Southern Branch and Ganahar Branch. After utilization sufficient amount of flood water for irrigation in these branches the remaining flow directly hit Kachhi Canal. Some damages scenarios of Kachhi canal because of Mithawan hill torrent is shown in figure 1, which is taken from Google Earth.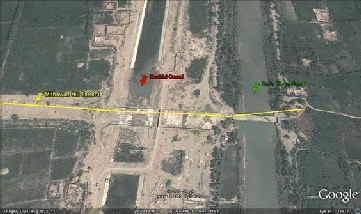
Figure1, Damages of Kachhi Canal due to Mithawan hill torrent flow.
Kachhi Canal is a project of National interest to supply 6,000 cusecs (170 Cumecs) water to Baluchistan province for irrigation purposes. Management of flood during low flows is not an issue as this water easily being consumed in Pachad area. The real problem starts during high flows as these flows are above the bearing capacity of pachad area. Being a contour channel, the Kachhi canal would irrigate on its left side. D.G. Khan Canal will also have its command area on the left side, whereas, no arrangement is available or proposed to irrigate the right bank side. The hill torrents will also emerge from the right side of the canal, passes through canal and fall in the Indus River.
During 1958, Mr. G. E. Meads, an FAO4 expert [8] visited the
area and suggested different options for safe disposal of hill
torrent water. These included storage dams, retarding dams and check dams on various hill torrents. At later stages it was found that geological formation is very poor. Therefore, these proposals were not executed so far.
Various flood management strategies have been reviewed by
NESPAK5 1998 [11] and it has been concluded that the most prudent strategy would be to construct appropriate flood dispersion and diversion structure supported by a surface drain to safely carry the left overflow to the Indus.
Tate et al. 2002 [15] mentioned that the process for
the development of a terrain model by using HEC-RAS hydraulic model can be facilitated with the help of geographic information system (GIS) based approach. The first step in this process is to export channel data from HEC- RAS to GIS, on the basis of this data, the hydraulic model coordinates can be converted to geographic coordinates. The terrain model so formed is much accurate when compared with high-resolution terrain data acquired through aerial photographs.
Alemaw et.al, 2003 [1] mentioned that GIS has the capability of handling large amounts of spatially detailed
information derived from various sources such as remote sensing and ground surveys. With the advent of increasing computing power and GIS techniques, physical-based hydrologic modeling has become important in contemporary hydrology for assessing the impact of human intervention and/or possible climatic change on basin hydrology and water resources.
Nawaz and Han 2006 [9] concluded that if the proper storage
facility and modernized structures are provided in hill
torrent affected areas then not only the flood is controlled but
also the drought conditions can be mitigated and the crops yield can be enhanced.
Recommendation by Mr. Javed et al 2007 [8] is comprised of the following strategies for hill torrent affected areas.![]()
4FAO, Food and Agriculture Organization
5 National Engineering Services of Pakistan
IJSER © 2014 http://www.ijser.org
International Journal of Scientific & Engineering Research, Volume 5, Issue 12, December-2014 156
ISSN 2229-5518
• Different diversion/distribution structures can be used in Pachad Area to utilize flood flows for agriculture purposes;
• Excess flows can be diverted to River Indus through channelization in CRBC6 command area;
Garry W. Brunner 2010 [6] describe that HEC-RAS is an integrated system of software, designed for interactive use in a multi tasking, multi user network environment. The system is comprised of a graphical user interface (GUI), separate hydraulic analysis components, data storage and management capabilities, graphics and reporting facilities.
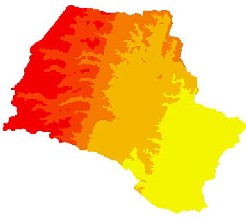
Mithawan hill torrent situated in District Dera Ghazi Khan of Punjab Province of Pakistan between longitudes 69o 10’ E to 70o 49’ E and latitudes 28o 27’ N to
31o 20’ N, having almost polygonal shape, drains an area of
710 square kilometer at an elevation of 2107 meter above
mean sea level (AMSL). The location map and catchment area is shown in figure 2. Kachhi Canal off-takes from Taunsa barrage over the river Indus in Punjab Province and irrigate about 713,000 acres of culturable command area in Kachhi plain of Baluchistan. Highly silted water of Mithawan directly hit Kachhi canal, breach its banks and enter in canal, disturb canal supply, damage infrastructure, roads, crops and effect live stock and humans also. The safe drainage of Mithawan hill torrent flow at Kachhi canal is very necessary for efficient use of canal water. During flood season the existing cross drainage structures are chocked due to heavy sediments and overtopped Kachhi Canal which affects downstream areas. In extreme flood situation it needs to breach the canal and irrigation supplies are affected.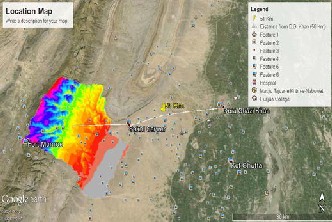
Figure-2. Location map and Catchment area of Mithawan hill torrent
![]()
6 Chashma Right Bank Canal Project
Frequency analysis has been carried out by using Gumbel
Extreme value Type-I distribution. It was estimated that
79,045 cusecs discharge has been reached at Darraha at 25
years return period. This flood has to be managing in the
catchment of Mithawan hill torrent as this flood is above the capacity of Agriculture fields. During this research four alternatives have been proposed for management of Mithawan hill torrent flow;
Management through Pachad Region and through Cross Drainage structures at Kachhi Canal (Flow chart figure 3).
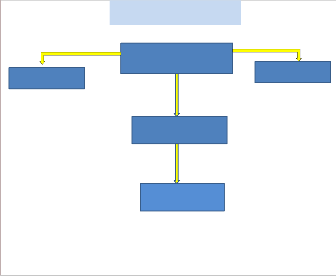
Management through Sub-Mountainous Region, Pachad Region and through Cross Drainage structures at Kachhi Canal (Flow chart figure 4).
Management in Mountainous region through reservoirs (Flow chart figure 5).
Management in Mountainous region through reservoir and Pached Region (Flow chart figure 6).
IJSER © 2014 http://www.ijser.org
International Journal of Scientific & Engineering Research, Volume 5, Issue 12, December-2014 157
![]()
![]()
ISSN 2229-5518
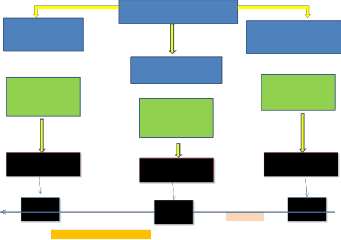
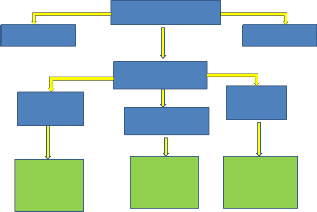
Plan-1
Ganahar Branch 48%
=37941 cfs
CCA= 10161 acres and
20,000 cfs consumed
Peak Discharge at Darraha= 79045 cfs
25 Years Return Period
Southern Branch 25%
= 19761 cfs
CCA= 12751 acres and
15,000 cfs consumed
Northern Branch 27%
=21342 cfs
CCA= 14985 acres and
15,000 cfs consumed
Storage at Dam site-1
18654 cfs= 5890 AF
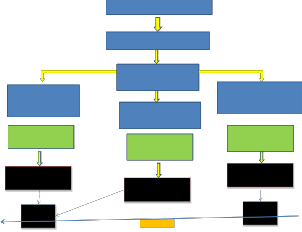
Plan-3
Peak Discharge at Darraha
79045 cfs= 35700 AF
25 Years Return Period
Remaining= 27488cfs= 15516 AF
Storage at Dam site-2
32903 cfs= 14294 AF
17941 cfs cross Kachhi
Canal at RD 377+500 4761 cfs cross Kachhi
Canal at RD 365+000
6342cfs cross Kachhi
Canal at RD 316+430
Cross Drainage Structure
Management of Hill Torrent by NESPAK (1984)
Cross Drainage Structure
Kachhi Canal
Cross Drainage Structure
Find out one or more storage above Darraha
Figure 3 Schematic view of paln-1
![]()
![]()
Figure 5 Schematic view of paln-3
Plan-4
![]()
Plan-2
![]()
Peak Discharge at Darraha= 79045 cfs
17,000 cfs disposed off in CCA 22755 acres above Darraha
Storage at Dam site-1
18654 cfs= 5890 AF
Ganahar Branch 48%
Peak Discharge at Darraha= 79045 cfs
25 Years Return Period
Remaining= 27488cfs= 15516 AF
Storage at Dam site-2
32903 cfs= 14294 AF
Northern Branch
27%
Ganahar Branch 48%
=29782 cfs
CCA= 10161 acres and
Remaining= 62045 cfs
Southern Branch 25%
= 15511 cfs
Northern Branch 27%
=16752 cfs
CCA= 14985 acres and
13194= cfs Southern Branch 25%
= 6872 cfs
=7421 cfs
20,000 cfs consumed CCA= 12751 acres and
15,000 cfs consumed
15,000 cfs consumed
Easily disposed off in
CCA= 10161 acres
Easily disposed off in
CCA= 12751acres
Easily disposed off in
CCA= 14985acres
9782 cfs cross Kachhi
Canal at RD 377+500 511 cfs cross Kachhi
Canal at RD 365+000
Cross
Drainage
1752 cfs cross Kachhi
Canal at RD 316+430
Cross
Drainage
![]()
Recommended Strategy 50
Figure 6 Schematic view of paln-4
Structure
Kachhi Canal
Structure
Figure 4 Schematic view of paln-2
All the plans mentioned above seem good for management of Mithawan flow. The plan 3 and plan 4 found quite reasonable as the main strategy behind this is to consume/ utilize the water where it generates. The peak discharge to be estimated at 25 year return period is 79,045 cusecs at Darraha. The structural safety of Kachhi Canal is the necessity for the people of Baluchistan province of Pakistan. Ample quantity of water was found wasted with plan 1 and plan 2 as flow crosses Kachhi Canal and finds its way to Indus River after causing damages. I started working on plan-3 as discussed below and suggested plan-4 as perfect to meet the demand of the area for irrigation and then to save
surplus water which could be consumed in drought season or when demand arises. The following steps are used for plan-4.
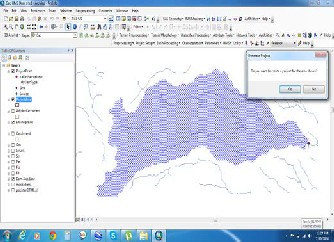
Marked the approximate catchment area of Dam site-1 and the Dam Axes location on Google Earth. Import this file into Arc GIS to draw contours at 10 m interval. Surface areas and Surface volumes were determined by using Arc hydro tools option of GIS. Finally, Elevation Area Capacity Curve (EAC) was finalized.
IJSER © 2014 http://www.ijser.org
International Journal of Scientific & Engineering Research, Volume 5, Issue 12, December-2014 158
ISSN 2229-5518
HEC-Geo RAS is a Geographic river analysis system developed using Desktop and Arc GIS Spatial Analyst and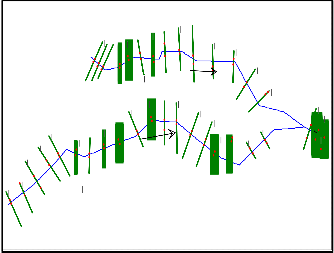
3D Analyst extensions. The geo data base design supports analysis of spatial data for hydraulic modeling and floodplain mapping. HEC-RAS is River Analysis system used to find out water surface profiles, area of the stream, Discharge through stream, Wetted perimeter, velocity and slope of the channel. The geometry of cross section of Dam site option-1 is shown in figure 7.
16630.45 14220.43
12639.05 an
i t
10788.65
8588.984
7276.252
5985.321
Figure-8 (a) Fill Sinks
13954.42
Upper Reach
10644.85 9068.853
11706.01
8010.734
7066.635
4867.034
2667.331
1304.9
770
16963.13
15792.31
17688.1
18778.56
6297.137 3647.345
Lower
19765.95
20682.64
Rakhi reach
Figure 7 Geometry of Dam site-1 in HEC-RAS
Flow data and reach boundary conditions (upstream slope value and downstream slope value) have been inserted in HEC-RAS model. The “2” number of profiles have been added to estimated the water surface profiles at 25 year and
100 year return period.
HEC-RAS model was run after adding all the necessary inputs for hydraulic simulation.
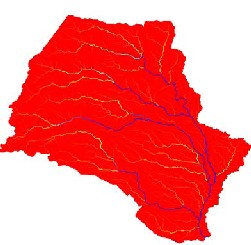
The results of the preprocessing of terrain pre processing are shown in figures 8 (a) and 8 (b). The resultant Raw DEM of Mithawan is shown in Figure 9 (a) and Slope of the study area is shown in Figure 9 (b).
Figure-8 (b) Flow Accumulation
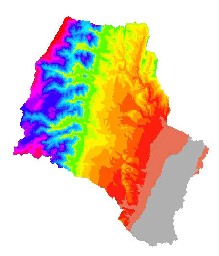
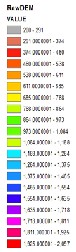
Figure 9 (a) Raw DEM and Elevations
IJSER © 2014 http://www.ijser.org
International Journal of Scientific & Engineering Research, Volume 5, Issue 12, December-2014 159
ISSN 2229-5518
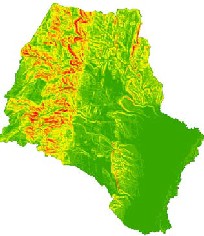
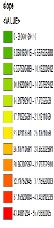
Figure 9 (b) Slope Difference of catchment
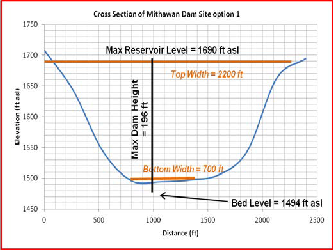
The resultant figures for Dam site option 1 are shown from figure 10 to figure 13. Elevation Area Capacity Curve (EAC) and Cross Section at Dam Site option-1 is shown in Figure 14 and Figure 15 respectively. The cross section in HEC-RAS at outlet is shown in figure 16.
Figure 10 Area of Dam site Option-1
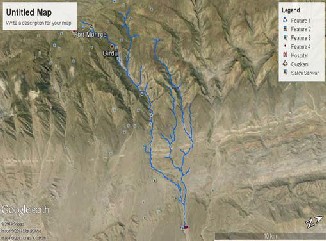
Figure 12 Dam Axes Dam site Option-1

Figure 11 Drainage line extracted from Arc GIS
Figure 13 Cross Section along the centre line
IJSER © 2014 http://www.ijser.org
International Journal of Scientific & Engineering Research, Volume 5, Issue 12, December-2014 160
ISSN 2229-5518
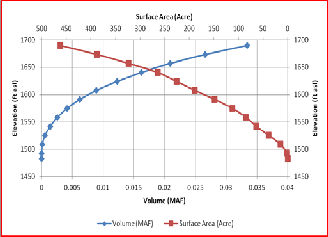
Figure 14 EAC Dam site option-1
Figure 15 Cross section of Dam site Option-1
HE C RA S1fi nal Pl an: P l an 01 7/19/2014
1800
1750
1700
1650
1600
1550
1500
.04 .035 .04
0 500 1000 1500 2000 2500 3000
Station (ft)
EG PF 2
EG PF 1
WS PF 2
Cri t PF 2
WS PF 1
Cri t PF 1
Ground
Bank Sta
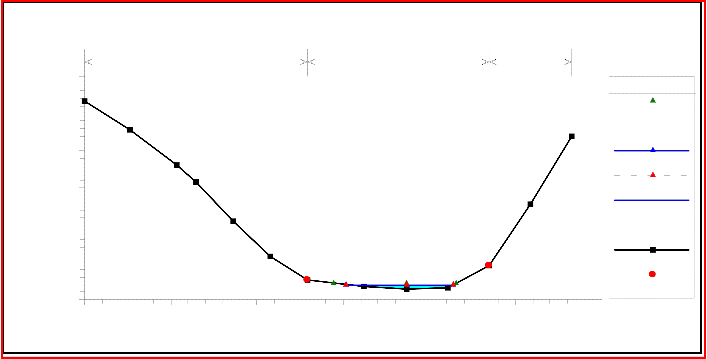
Figure 16 Cross section of Dam site along with water profile at 25 and100 year return period using HEC-RAS.
The Summary of Geometric Parameters of Dam-1 and Dam-2 is shown in table 1. Height of dam-1 and dam-2 were 196 ft and 209 ft. with storage capacity of 0.018
MAF7 and 0.026 MAF respectively. Maximum Reservoir level is 1690 ft and 1417 ft for Dam-1 and Dam-2 respectively.![]()
7 MAF is Million Acre Feet
IJSER © 2014 http://www.ijser.org
International Journal of Scientific & Engineering Research, Volume 5, Issue 12, December-2014 161
ISSN 2229-5518
TABLE 1
SUMMARY OF GEOMETRIC PARAMETERS.
The total capacity of two storages is about 52,000 cusecs (20,000AF). The remaining 27,000 cusecs (15,700 AF) can be easily used in Pachad area i.e 48% (7,536 AF) in Ganahar Branch, 25% (4,000 AF) in Southern Branch and 27% (4,200AF) in Northern Branch. Three cross-drainage structures of 17,941 cusecs, 4,761 cusecs and 6,342 cusecs capacities have been finalized at Kachhi Canal Crossing RD8
377+500, RD 365+00 and RD 316+430 respectively. Various
management plans for Mithawan hill torrent flow have been
studied and found four options suitable for present case study. These management plans will also save Kachhi Canal from siltation and also save entire humanity from damages of floods and in this way the 6,000 cusecs discharge of Kachhi Canal is beneficial for the Kachhi plain of Baluchistan (Pakistan). It is recommended that management plan-4 i.e. management through a combination of storage dam and utilization in Pachad area is the best option for the current scenario, the same is recommended by [8], [9] and [11].
[1] A.L.Pirach, C.G.Yein & S.Ahmad, 2003, “Integrated use of GIS and Remote Sensing in Hydrological Modeling”, Asian Institute of Technology, Bangkok, Thailand.
[2] Chow, V.T. 1964. "Handbook of Applied Hydrology", McGraw-Hill Book Company, New York.
[3] Gary W. Brunner (2010) “Hydrological Modelling System- HEC-RAS-Hydraulic Reference Manual- Version 4.1. Davis, California”.
[4] HEC Geo-HMS, July 2000, “User’s Manual”. US Army Corps of Engineers, Hydrologic Engineering Center.
[5] HEC-HMS, January 2001, “User’s Manual–Version
2.1”. US Army Crops of Engineers, Hydrologic
Engineering Center.
[6] Gary W. Brunner 2010 “Hydrological Modelling System- HEC-RAS-Hydraulic Reference Manual- Version 4.1. Davis, California”.
[7] Khan W.U (1980), Consultant Hydro meteorologist, Hydrometeorology of Baluchistan, Volume I, II & III, UNDP-PAK/73/032.
[8] Management of hill torrent in CRBC area (stage –III) D.G. Khan April 2007, TA – 4719 (Pak): Additional![]()
8 RD is Reduce Distance used for canal miles i.e. 1RD=1000 ft.
IJSER © 2014 http://www.ijser.org
International Journal of Scientific & Engineering Research, Volume 5, Issue 12, December-2014 162
ISSN 2229-5518
works for the preparation of hill torrents management plan by TA Consultants for Asian Development Bank.
[9] Nawaz. M and Mooyoung, H. 2006 “Hill Torrents Management for increasing Agricultural Activity in Pakistan. Department of Civil and Environmental Engineering, Seoul National University Korea”. E- mail: daring511@hotmail.com.
[10] NESPAK, (1992) “Flood Protection Sector Project; Feasibility Studies for Flood Management of Kaha Hill Torrent”.
[11] NESPAK report (1998) “Flood Management of Hill
Torrent of Pakistan”.
[12] NESPAK 2004 “Performance Evaluation of Kaha
Hill torrent by Joint venture of NESPAK, ACE and
NDC, April 2004”.
[13] NESPAK 2013. “Study and Detailed Field Survey for Assessment and Mitigation of Potential Flooding Locations on NHA Network”, Final Completion Report, May 2013.
[14] Scharffenberg, William A. 2000. Hydrological Modeling System- HEC-HMS-User’s Manual- Version 2.0. Davis, California.
[15] Tate E.C., Maidment D.R., Olivera F. and Anderson D.J. 2002. “Creating a Terrain Model for Floodplain Mapping”. Journal of Hydrologic Engineering ,7(2), 100–108.
IJSER © 2014 http://www.ijser.org
International Journal of Scientific & Engineering Research, Volume 5, Issue 12, December-2014 163
ISSN 2229-5518
IJSER © 2014 http://www.ijser.org