International Journal of Scientific & Engineering Research, Volume 6, Issue 3, March-2015 182
ISSN 2229-5518
Allometric Models for Aboveground Biomass of
Benguet Pine (Pinus kesiya)
Jones T. Napaldet
Abstract – Several authors recommend species-specific allometric models for accurate carbon sequestration accounting but mixed- species models are prevalent in the Philippines. Thus, in the study, species-specific models were developed for above-ground biomass of Benguet pine (Pinus kesiya). Diameter at breast height (D) and total tree height (H) were primarily used as the dependent variables. Wood density, with values ranging from 0.34 to 0.59 g/cm3, was also explored as a dependent variable but it yielded low correlation and models with low r2 values. This support other studies claiming that wood density is more apt in mixed-species than in species-specific models. Best-fit models for total above ground biomass (TAGB = 0.067D2.474 and TAGB =0.0000003855 (D2H) 2 + 0.023 (D2H) + 3.496) and for the other tree compartments for a total of 16 models were developed. These models have high r2 and adjusted r2 values of 0.87 to 0.99. Moreover, these models yielded more accurate estimates of Benguet pine biomass than mixed-species models of Brown & Schroeder (1999) and Chave et al. (2005). Thus, the study highly recommends these models for accounting Benguet pine biomass and subsequently, the carbon it sequestered.
Index Terms – Allometric models, Benguet pine, wood density
—————————— ——————————
1. INTRODUCTION
arbon sequestration, the practice of capturing CO2 in a reservoir to keep the gas from being released to the atmosphere, has been identified as one way to
offset or mitigate global warming and climate change
(OECD, 2001). Its implication to the Philippines could be better appreciated in the context of emission trading and carbon credits. This involves giving monetary value to pollutants in the atmosphere and the reduction thereof.Countries that were parties to the treaty could sell carbon credits for US$ 15 to 25 per ton of sequestered carbon (Fletcher & Parker, 2003; Bengwayan, 2010).
Biomass is an important indicator of carbon
sequestration levels since 50% of the forest biomass is supposedly carbon (Montagnini & Porras, 1998; Losi et al.,
2003; Montagu et al., 2005). The Kyoto Protocol requires transparent reporting of forest removal and accumulation (biomass change). This implies the use of precise procedure to quantify forest biomass and its uncertainty.
Majority of the studies conducted on Philippine forest
primarily use generic mixed-species allometric models to estimate biomass. This method is non-destructive and easier to conduct; however, the accuracy of the model is often questionable and limited (Ketterings et al., 2001; Segura & Kanninen, 2005; Tinker et al., 2008; Ebuy et al.,
2011). Thus, to attain an accurate accounting of the carbon stock, there is a need to develop models based on biomass data from the local forest.Hence, this study was conceptualized.
————————————————
• Jones T. Napaldet is a faculty in the Biology Department, Benguet State
University, Philippines E-mail: jones_napaldet@yahoo.com
Pinus kesiya dominates the montane rainforests or pine
forests of the Cordillera Administrative Region in Northern Philippines. Being the dominant species, Pinus kesiya could be inferred to contain the major bulk of carbon in the forest.The study determined the best-fit models for the aboveground biomass of Benguet pine and its compartment (trunk, primary branch, secondary branch, twigs and needles) based on destructively sampled trees.
2. MATERIALS AND METHODS
The study sampled 15 pine trees in the communal secondary pine forest of Batayan, Tadian, Mountain Province – 5trees for each diameter class ranges (5-10, 11-30, and 31-50 cm) were felled. Each tree was compartmentalized into main trunk, primary branch, secondary branch, twigs and needles. These were summarized to get the total above-ground biomass. Samples from these different tree compartments were oven- dried to determine the moisture content and then deducted from the freshweight to derive the dryweight or biomass. Wood densitywas also determinedusing water displacement method (Basuki et al., 2009).
Biomass data were subjected to correlation and
regression analysis using SPSS to develop allometric
models. Correlation analyses were first employed to establish the relationship between the easily measured (independent) variables such as D, H and wood density with the trees’ aboveground biomass (dependent). Also, a graphical exploration of the data was conducted to avoid falling into the traps of ‘blind’ fitting; the impression can be gained that the model accurately fits the data, whereas in fact this result is an artefact (Picard et al., 2012).The coefficient of determination (adjusted r2) for each model was used to assess the accuracy of the model. The higher the adjusted r2 value, the higher the accuracy of the model (Kahane, 2001), thus allometric models with the highest
IJSER © 2015 http://www.ijser.org
International Journal of Scientific & Engineering Research, Volume 6, Issue 3, March-2015 183
ISSN 2229-5518
adjusted r2 value were selected and proposed for biomass estimation.Models developed in the study were compared with the generic allometric models developed by Brown and Schroeder (1999) for pine forest as cited in Pearson et al. (2007) and Chave et al. (2005) for wet forest stand using paired t-test (Tinker et al., 2008).
3. RESULTS
3.1. Developing allometric models for biomass
estimation of Benguet pine
Pearson Correlation showed very high correlation (p=0.00) between D and H with the aboveground biomass and its compartments. This, and the scatter plots (Fig. 1 and
2) established D and H as independent variables in the

study.
1200
1000
800
600
Best-fitted allometric model for total aboveground biomass were TAGB = 0.067D2.474 and TAGB =0.0000003855 (D2H) 2 +
0.023 (D2H) + 3.496. These models have high r2 and adjusted r2 values ranging from 0.87 to 0.99 indicating very good fit, with the 2nd models having slightly higher values. Also, these equations have low p-values and high F-values thus, complying with requirement for goodness of fit for allometric models.

Table 1. Allometric models for the estimation of Benguet pine biomass
400
200
0
0 10 20
D
30 40 50 (cm)
Fig. 1. Scatter-plot showing the relation between the D with total aboveground biomass
1200
1000
800
600
400
200
0
0 5 10 15 20
H (m)
D = diameter at breast height (cm) H = Total tree height (m)
na = not applicable for 5 -10 cm dbh trees since they have
no secondary branch
3.2. Comparison with Other Models

Fig. 2. Scatter-plot showing the relation between the H with
total aboveground biomass
Table 1 presents the allometric models best-fitted for
the aboveground biomass and its different compartments.
Two equations per biomass component were selected: 1)models with D as the only independent variable; and, 2) modelswith the combined effect of D with H (D2H).

Brown and Schroeder model for general pine forest stand (TAGB = 0.887 + (10486 x D2.84)/D2.84 + 376907) yielded significantly different estimates (paired t-test, p=0.026) compared with the actual biomass. It underestimated the biomass of smaller trees while overestimated for larger trees with better agreement at intermediate D trees. Chave
IJSER © 2015 http://www.ijser.org
International Journal of Scientific & Engineering Research, Volume 6, Issue 3, March-2015 184
ISSN 2229-5518
et al. model for wet forest stand (TAGB = 0.0776 x (p*D
2 *H) 0.940) provided consistently lower estimates, though,
not statistically significant (p=0.086).
The two models developed in study (TAGB = 0.067D2.474

and TAGB =0.0000003855 (D2H) 2 + 0.023 (D2H) + 3.496) generated estimates that were not significantly different from the actual biomass (p=0.481 and 0.643, respectively). The 2nd model gave estimates that follow the rise and fall trend of the actual biomass. Refer to Fig. 3 for comparison between the estimates of the models with the actual
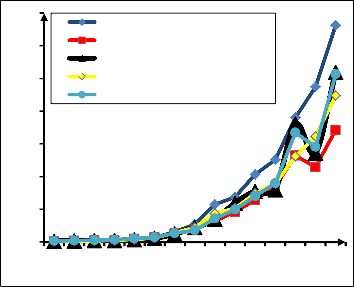
biomass.
1400
1200
1000
800
600
400
200
0
Brown and Schroeder model
Chave et al. model Actual Biomass Model 1
Model 2
5 6 7 8 9 11 15 18 24 26 30 32 37 41 47
D (cm)
Means with the same letter in a row are not statistically
different at α=0.05 DMRT
Means with the same numeral in a column are not
statistically different at α =0.05 DMRT
Table 3 presents the wood density of the main trunk and branches of the sampled trees. Wood density of the main trunk ranged from 0.34 to 0.59 g/cm3 with significantly lower values on 5-10 cm D class (0.46) compared to 11-30 cm D class (0.52) and 31-50 cm D class (0.55). Between trunk sections, generally the base was significantly denser than the middle and apical portion among the diameter classes (0.55>0.48>0.34 in 5-10 cm D class; 0.59>0.54>0.45 in 11-30 cm D class; and, 0.59>0.54>0.52 in 31-50 cm D class). Branch wood density, on the other hand, was significantly higher on large trees ranging from
0.57–0.69 compared to 0.44 of small trees. Interestingly, wood branch (0.60-0.63) of large diameter trees was denser
Fig. 3. Comparison of the predicted biomass with the actual
biomass (Model 1 TAGB = 0.067D2.474; Model 2
TAGB =0.0000003855 (D2H) 2 + 0.023 (D2H) + 3.496)
than the main trunk (0.51-0.55).

Table 3. Wood density of the main trunk and branch
3.3. Moisture content and wood density
The moisture content of the different tree compartments (Table 2) was more or less 50%. Woody compartments (trunks and branches) generally contained

Tree Compone nts
Main
Trunk
Wood density (g/cm3) of the tree diameter classes
5-10 cm 11-30 cm 31-50 cm
less water than herbaceous (twigs and needles) ones –54 &
61% <62&65% in 5-10 cm D trees; 52& 49 to 52% < 58 & 57% in 11-30 cm D trees; and, 49& 43 to 54% < 58& 56% in 31-50 cm D trees. Between diameter classes, larger diameter trees
Base 0.5581a III 0.5870 a II, II 0.5897a I, II
Middle 0.4793 a II, III 0.5402 aII 0.5367a I
Apex 0.3448a I 0.4172 b I 0.5238 c I
Mean 0.4607 a 0.5148 b 0.5501 b
(52%) containedsignificantly lower mean moisture content
than 5-10 cm D trees (60%).
Table 2. Moisture Content (%) of the different tree
Primary Branch Secondary Branch
0.4370 a II 0.5685 b II 0.6875 c III
n/a 0.6812 III 0.5651 I

components

Tree compone nts
Main
Trunk
Moisture Content (%) of the Tree Diameter
Classes
5 – 10 cm 11 – 30 cm 31 – 50 cm

Mean 0. 4370a 0.6044 b 0.6336 b
Means with the same letter in a row are not statistically
different at α= 0.05 DMRT
Means with the same numeral in a column are not
statistically different at α = 0.05 DMRT
Base 54.0184 a I 47.4470a I 52.9184 a III Middle 53.0204 b I 50.2669 a,b I 46.1690 a I, II End 55.0194a,b I 57.5457 b II 48.6650 a II
4. DISCUSSION
4.1. Developing allometric models for biomass
estimation of Benguet pine
IJSER © 2015 http://www.ijser.org
International Journal of Scientific & Engineering Research, Volume 6, Issue 3, March-2015 185
ISSN 2229-5518
For models with D as the only independent variable, power regression models (with a form: Y = aXb) estimated and fitted best all the biomass components except for primary branch. The r2values (0.87 to 0.99) of these models were not much lower than the more complex models. Thus, it could be surmised that the D of Benguet pine is enough to estimate its total above-ground biomass with 87 to 99% accuracy – which is very advantageous since D is easier and more accurately measured in the field than tree height and other variables. According to Montagu et al. (2005) as cited in Litton and Kauffman (2008), the measurement error in getting the D of trees is only 3% while 10-15% for tree height.
Total tree height as sole independent variable was
extensively explored but yielded equations with lower r2 values. This result is consistent with the study of Tinker et al. (2008) on lodgepool pine (Pinus contorta var. latifolia) which found out that D was the primary morphological predictor of all the trees’ biomass compartment and H only as secondary. Also, this could be attributed to the higher correlation between D and biomass than between H and biomass.
For secondary branch, the combined effect of D and H as the independent variables resulted to higher r2 values than with D alone. However, D was squared first before multiplied with H (D2H) signifying D as the primary predictor and H only as secondary. This is consistent with Tinker et al. (2008) that identify tree height only as a secondary predictor for branch biomass. Nonetheless, equation using D was also generated for this biomass component since it is easily measured, albeit, with lesser r2 values (≈ lesser accuracy).
The same result was also observed in the allometric models for the other tree compartments such as twigs and needles. The combined effect of D and H yielded higher r2 values (0.96-0.97) but not much higher than D alone (0.94-
0.95). Nonetheless, these r2 values were very high
indicating fitness and accuracy of the models in predicting the biomass of these compartments.
Wood density was also explored as an independent variable. Several studies suggested the significance and inclusion of wood density in generating more accurate regression equations (Baker et al., 2004; Chave et al., 2005; Basuki et al., 2009; and Ebuy et al., 2011). However, this is not the case in the study. Wood density (both the main trunk and branch) yielded poor correlation with the biomass and models including wood density have low r2 values. Thus, it is not included in the best-fit regression equations. Nonetheless, related studies showed that wood density is more aptly used in mixed species models but not in species-specific models (Tinker et al., 2008 on lodgepool pine; and, Litton and Kaughman, 2008 on Metrosideros sp.).
4.2. Comparison with Other Models
Brown and Schroeder model yielded significantly different estimates from the actual biomass thus, it is deemed not accurate to predict the TAGB of Pinus kesiya. This is consistent with the findings of Litton and Kauffman (2008) where in general models like that of Brown and Schroeder’s tend to greatly underestimate biomass at smaller D and greatly overestimate biomass at larger D, with better agreement at intermediate D trees. Chave et al.’s model, on the other hand, included wood density in their equation and yielded estimates not significantly different. It is observed that the deviation of the estimated values of these two models from the actual biomass is much greater on large diameter trees – overestimate for Brown and Schroeder’s while under estimate for Chave et al.’s.
4.3. Moisture content and wood density
Larger D trees have lower moisture content since they are older and have accumulate more fiber cells over time than smaller D younger trees. Fiber cells are dead cells at maturity, have thicker cell walls and lesser watery cytoplasm while younger trees have more herbaceous parts. Between tree compartments, dead tracheids, vessel elements and fiber cells predominate in woody parts hence yielding lesser moisture content than the herbaceous parts (needles) which consist primarily of living parenchyma cells that are water saturated (Mauseth, 1998; Stern, 2000; and Microsoft Encarta, 2009).
Wood density of Benguet pine derived in the study fall under the normal range for Pinus kesiya: 0.43 to 0.50 g/cm3according to USDA Forest Service; 0.40 to 0.75 according to Prota; and 0.56 to 0.59 according to World Agroforestry Centre (n.d.).
5. CONCLUSIONS AND RECOMMENDATIONS
The study generated 16 allometric models for aboveground biomass of Pinus kesiya and its compartments using D and H as independent variables. These models had high r2 and adjusted r2 values of 0.87 to 0.99, thus, concluded to be accurate for estimation of the above ground biomass and hence could served as a guide in quantifying carbon in the forest, which, in turn, guides its monetization under the carbon sink and emission trading. With these r2 values, the study was confident that the predicted values of these models was less than 20% error set in the emission trading scheme under the Clean Development Mechanism.
The study recommends these models, particularly:
TAGB = 0.067D2.474 and TAGB =0.0000003855 (D2H) 2 + 0.023 (D2H) + 3.496, for biomass estimation of Benguet pine especially those with D that fall within 5 – 50 cm. Also, these models shall be used to account for the biomass and
IJSER © 2015 http://www.ijser.org
International Journal of Scientific & Engineering Research, Volume 6, Issue 3, March-2015 186
ISSN 2229-5518
carbon stored and sequestered by the secondary communal forest in Batayan, Tadian, Mountain Province including other carbon pools. These models can be improved and validated if applicable in Benguet pine forest in other areas. Further studies should be conducted to determine the actual carbon content of the different tree components. Moreover, allometric models for other common or dominant tree species should be developed to help in accurately accounting the carbon stored and sequestered in Philippine forest. This, in turn, will guide its monetization under the carbon trading scheme of the Kyoto Protocol. Lastly, reforestation and afforestation programs of the different agencies should be sustained and strengthened as these forests provide a lot of ecological services including carbon sequestration.
ACKNOWLEDGMENT
The author is very grateful to his advisers Dr. Romeo A. Gomez, Dr. Erlinda C. Bestre and Dr. Denisa L. Domondon for their valuable advices and critiques for the improvement of the study. Also to Biology Laboratory being supervised by Ma’am Eslava and Soils Laboratory for the data analysis.
REFERENCES
[1] Baker T R, Phillips O L, Malhi Y, Almeida S, Arroyo L, Di Fiore A, Erwin T, Higuchi N, Killeen T J, Laurance S G, Laurance W F, Lewis S L, Lloyd J, Monteagudo A, D. Neill A, Patino S, Pitman N C A, Silva J N M, and Vasquez-Martinez R. 2004. Variation in wood density determines spatial patterns in Amazonian forest biomass. Glob Change Biol 10:545–562
[2] Basuki T M, Van Laake P E, Skidmore A K and Hussin Y A. 2009.
Allometric equations for estimating the above-ground biomass in tropical lowland Dipterocarp forests. Forest Ecology and Management 257: 1684–1694.
[3] Bengwayan M. 2010. Carbon Trading: Saving Forest and Communities. http://pinetreephill.blogspot.com/. Accessed on May 2012
[4] Chave J, Andalo C, Brown S, Cairns M A, Chambers J Q, Eamus D, Folster H, Fromard F, Higuchi N, Kira T, Lescure J P, Nelson B W, Ogawa H, Puig H, Riera B and Yamakura T. 2005. Tree allometry and improved estimation of carbon stocks and balance in tropical forests. Ecosystem Ecology 145: 87–99.
[5] Ebuy J, J. Lokombe P, Ponette Q, Sonwa D and Picard N. 2011.
Allometric Equation For Predicting Aboveground Biomass of
Three Tree Species. Journal of Tropical Forest Science 23(2): 125-
132.
[6] Fletcher S R and Parker L. 2003. Climate Change: The Kyoto
Protocol and Intergovernmental Actions. CRS Report RL33826.
[7] Kahane L H. 2001. Regression Basics. California, USA: Sage
Publication, Inc. Pp. 19-36, 37-42, 59-65, 79, 92.
[8] Kaufmann M R and Ryan M G. 1986. Physiographic, stand, and environmental effects on individual tree growth and growth efficiency in subalpine forests. Tree Physiology 2: 47-59.
[9] Ketterings Q M, Richard C, Van Noordwijk M, Ambagau Y and
Palm C A. 2001. Reducing uncertainty in the use of allometric
biomass equations for predicting above-ground tree biomass in mixed secondary forests. Forest Ecology and Management 146:
199-209.
[10] Litton C M and Kauffman JB. 2008. Allometric Models for Predicting Aboveground Biomass in Two Widespread Woody Plants in Hawaii. BIOTROPICA 40(3): 313–320
[11] Losi CJ, Siccama T G, Condit R and Morales J E. 2003. Analysis of alternative methods for estimating carbon stock in young tropical plantations. ForestEcology and Management, 184(1-3): 355-368.
[12] Mauseth J D. 1998. Botany: An Introduction to Plant Biology, Multimedia Enhance Edition. Toronto, Canada: Jones and Barlett Publishers, Inc. Pp. 106-110; 262-280.
[13] Microsoft Encarta. 2009. Xylem. Microsoft® Encarta® 2009 [DVD]. Redmond, WA: Microsoft Corporation, 2008.
[14] Montagnini F and Porras C. 1998. Evaluating the role of plantations as carbon sinks: an example of an integrative approach from the humid tropics. Environmental Management
22: 459-470.
[15] Montagu KD, Duttmer K, Barton C V M and Cowie A L. 2005.
Developing general allometric relationships for regional estimates of carbon sequestration--an example using Eucalyptus pilularis from seven contrasting sites. Forest Ecology and Management
204(1): 115-129.
[16] (OECD) Organization for Economic Cooperation and Development. 2001. Environmental Indicators for Agriculture. Vol. III: Methods and Results. OECD Glossary.
[17] Pearson T R, Brown S L and Birdsey R A. 2007. Measurement Guidelines for the Sequestration of Forest Carbon. http://nrs.fs.fed.us/pubs/gtr/gtr_nrs18.pdf. Accessed on May 2012.
[18] Picard N, Saint-André L, and Henry M. 2012. Manual for building tree volume and biomass allometric equations: from field measurement to prediction. Food and Agricultural Organization of the United Nations, Rome, and Centre de CoopérationInternationale en RechercheAgronomique pour le Développement, Montpellier, 215 pp.
[19] Prota. n.d.. Pinus kesiya Royle ex Gordon.
http://database.prota.org/dbtw- wpd/exec/dbtwpub.dll?ac=qbe_query&bu=http://database.prota.o rg/search.htm&tn=protab~1&qb0=and&qf0=Species+Code&qi0=Pi nus+kesiya&rf=Webdisplay. Accessed on March 2013.
[20] Segura M and Kanninen M. 2005. Allometric Models for Tree Volume and Total Aboveground Biomass in a Tropical Humid Forest in Costa Rica. Biotropica 37(1): 2–8.
[21] Stern K R. 2000. Introduction to Plant Biology, 8th ed. US: Mc-
Graw-Hill Companies, Inc. Pp. 51-60, 160-161.
[22] Tinker D B, Arcano R M, Ryan M G, Romme W H and Kashian D M. 2008. Tree Density and Stand Effects on Allometric Equation Development and Biomass Partitioning in Lodgepole Pine Forest near Yellowstone National Park, WY. http://www.learningace.com/doc/401762/7e5687085a6ea6dc5b58cf a3d1fc1032/tinker_et_al_2008. Accessed on March 2013.
[23] USDA Forest Services.1971. Pinus kesiya Wood Technical Fact Sheet. http://www.fpl.fs.fed.us/documnts/TechSheets/Chudnoff/SEAsia n_ Oceanic/htmlDocs_SEAsian/pinus_insularis.html. Accessed on March 2013.
[24] World Agroforestry Centre. n.d.. AgroForestryTree Database. http://www.worldagroforestrycentre.org/sea/products/afdbases/a f/asp/SpeciesInfo.asp?SpID=18165. Accessed on February 2013.
IJSER © 2015 http://www.ijser.org
International Journal of Scientific & Engineering Research, Volume 6, Issue 3, March-2015 187
ISSN 2229-5518
IJSER © 2015 http://www.ijser.org