International Journal of Scientific & Engineering Research, Volume 6, Issue 4, April-2015 26
ISSN 2229-5518
Air Quality Assessment of Jirania Brick Industries
Cluster: A Case Study
Amarendra Jamatia, Sumanta Chakraborti
Abstract— The present study is aimed to estimate the quantum of significant air pollution loads that arising out from the brick industries of a small cluster located at Jirania, Tripura, India. For assessing seasonal variations of concentration of particulate matter and other gaseous pollutants, air quality monitoring was carried out using Respirable Dust Sampler at 6 locations in Jirania Brick Industries Cluster before starting brick manufacturing and also during brick production seasons. The concentration of PM10 , SO 2 and NO 2 in the ambient air during bricks production was compared with the baseline ambient air quality data that were generated before starting the brick production. The level of deterioration of air quality in terms of low, moderate, high and critical is evaluated by calculating an exceedence factor (EF). Excedence factor (EF) ranges 0.736 implies that the Jirania Brick Industries Cluster is moderately air polluted area. The emission induced particulate matter and other gaseous pollutants increase the ground level concentration and degrading the quality of ambient air around the brick kilns during the brick production season. Human health as well the health of other living entities, manmade heritage and vegetation around the brick kilns are the serious concerned.
Index Terms— Brick, cluster, excedance, kilns, pollutant, Settlement, season.
—————————— ——————————
1 INTRODUCTION
NCREASING rate of brick production for meeting the large demand of bricks for construction sectors has rise up serious environmental degradation in Jirania area. Production of burnt bricks requires consumption of coal leading to particu- late matter and other gaseous pollutants emissions. Many au- thors investigated the potential impact that arising out from the emissions of brick kilns on ambient air quality and vegeta- tion [1]. Environment and health impact associated due to the brick industries were also investigated in terms of prevalence and respiratory symptoms as health exposures around the brick industries [2, 3, 4]. Air pollution is causing severe health and air quality problems in developing countries due to the use of low quality fuel in vehicles, industrial processes and other energy-derived products [5]. For minimising the air pol- lution and its prediction, applicability of effective air pollution modelling in a cluster of Bangladesh was studied using Indus- trial Source Complex (ISC3) modelling [6]. Energy conserva- tion and pollution control was priority in Indian brick indus- try [7]. To implement effective air pollution control strategies in polluted cluster, it is essential to properly identify the local air quality regimes based on the levels and behaviours of air pollutants. Cluster Analysis for Daily Patterns of SO2 and NO2
Measured by the DOAS System in Xiamen [8]. The quality of air depends on key chemicals emitted in to the atmosphere during the emissions and deposition processes. Metrological factors also play a critical role in ambient concentration of air pollutants. In order to arrest the deterioration in air quality and to determine the existing quality of air, assessment is nec- essary to evaluate seasonal variations of particulate matter, ash, SO2 , NO2 , etc. during pre-operation and operational sea-
————————————————
• Amarendra Jamatia, Assistant Environmental Engineer, Tripura State Pollution Control Board is currently pursuing masters degree program in environmental engineering in National Institute of Technology, Agartala, India, E-mail: ajamatia@rediffmail.com
• Sumanta Chakraborti is working as Registrar in National Institute of
Technology, Agartala, India. E-mail: imsumanta@gmail.com
sons of Jirania brick industries cluster.
2 SITE DESCRIPTION
Jirania Brick Industries cluster has been located at the latitude between N 23050.334/ to N 23048.579/ and the longitude be- tween E 91023.708/ to E 910 30.457/. It is the largest brick indus- tries cluster in Tripura, India. Sub-Divisional Head Quarter of Jirania is located at the centre point of the study area. Agartala, the state capital of Tripura and also the District Headquarter of West Tripura District located nearly at an aerial distance of about 16 Km from the site. The national highway NH-44 con- nects Jirania with the Agartala by road. This apart, there is a Railway Station at Jirania within the vicinity of Jirania Brick Industries cluster which connects the State Capital & other neighboring States of NE Region by rail. Other small urban centre namely Jirania Nagar Panchjayet is situated within the study area.
3 METHODOLOGY
Ambient air quality monitoring was conducted using Respira- ble Dust Sampler (Envirotech APM 460 XNL) with gaseous pollutant attachment (Envirotech APM 411 TE) at 6 locations in Jirania Brick Industries Cluster. The scope of this monitor- ing is to capture existing ambient air quality and also to ana- lyse trend of depletion of air quality at the cluster and its adja- cent area. The location of the brick fields and the predominant wind direction is given importance in selection of the ambient air quality sampling stations in the study. The dispersion of gaseous and particulate emissions depends on the predomi- nant wind directions and affects the receptors located at downwind. Monitoring of PM10 , SO2 and NO2 was carried out at a flow rate of 1.0- 1.04 m3/min for 24 hours using pre- weighed cellulose filters, Whatman (EPM-2000) of 20 x 25 cm in size. The filter papers contained with respirable fraction of fine dust re-weighed after sampling, in order to determine the
IJSER © 2015 http://www.ijser.org
International Journal of Scientific & Engineering Research, Volume 6, Issue 4, April-2015 27
ISSN 2229-5518
mass of the particles. The SO2 and NO2 samples are taken for every 8 hours. Freshly prepared the Potassium Tetrachloro- mercurate solution (TCM) was used as absorbing solution to absorb SO2 in the impinger at the time of sampling. On the other hand, nitrogen dioxide (NO2 ) is absorbed in absorbing solution prepared by dissolving sodium hydroxide in distilled water and adding sodium arsenide. The sampling instrument was fixed at the height of 3 m above the ground level. Repre- sentative air samples of SO2 & NO2 were analysed in the Air Laboratory of Tripura State Pollution Control Board, India. Spectrophotometer (model Spectronic 21D) was used for de- termination of absorbance. Determination of calibration curve was done using regression analysis by the method of least squares. Calibration factor of both gaseous pollutants are cal- culated separately by determining the slope of the line of best fit. The Calibration Factors for both pollutants as generated are being used to calculate the concentration of SO2 & NO2 . The analytical values of PM10 , SO2 & NO2 are compared with the CPCB standard to find out deterioration in local air quality if any. The levels of deterioration of air quality are expressed in terms of low, moderate, high and critical by calculating an excedence factor (EF). The excedence factor is the ratio of an- nual mean concentration with that of respective standard. An EF value more than 1.5 indicates critical pollution. Simultane- ously, high pollution means the when EF is between 1-1.5, the EF ranges between 0.5-1 is called moderate pollution and EF values less than 0.5 is expressed as low pollution.
4 RESULTS AND DISCUSSIONS
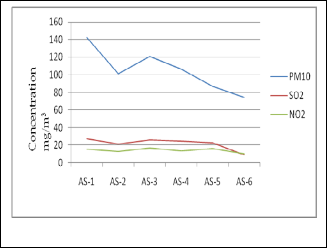
Observed air quality data of Jirania Brick Industries Cluster for pre-manufacturing season (August-October) and manufac- turing seasons (November to March) are presented in table-1. During pre-manufacturing season, PM10 concentration was found in the ranges of 74.54 - 142.31 µg/m3. On the other hand, the PM10 concentration was found between 145.94 -
278.39 µg/m3 during brick manufacturing season. The maxi- mum PM10 concentration reported at Binapani and lowest values PM10 concentration reported at Majlishpur during both seasons. Secondary information and field level survey data revealed that activities associated with green bricks produc- tion, movement of vehicles, loading & unloading of vehicle on approach road, firing of bricks, huge brick industries in a small area, close proximity of National Highway etc. are somewhat responsible to contribute certain amount of PM10 concentration in ambient air in and around the cluster. Analy- sis of recent data reveals that annual average concentration of PM10 of all the monitoring stations was higher than the per- missible limit of 60 µg/m3. Comparing the PM10 concentration between pre-manufacturing season (August-October) and manufacturing seasons (November to March), it is very clear that activities of brick industries greatly influence in PM10 con- centration. The pollutants coming from different sources trav- el and affect the nearest human settlements. Though, their direction of dispersion solely depends on prevailing wind di- rection that changes from season to season.
For assessing gaseous pollutants such as NO2 and SO2 , the hourly mass concentration values have been analyzed and
compared with the prescribed National Ambient Air Quality
Standard. The value of SO2 ranges 8.63 µg/m3 to 26.91 µg/m3 during pre-production season and 25.64 µg/m3 to 82.76 µg/m3 while bricks production. The maximum SO2 value of 82.76
µg/m3 reported at station AS-5 which is beyond the prescribed CPCB standard. However, the SO2 concentrations of all other stations are within the prescribed CPCB Standard. Huge quan- tities of burning of low quality coal for bricks production cause high concentration of sulpher dioxide in and around the Jirania area. Moreover, the continous vehicular movement through the National Highway-44 and other human activities are also causing another factor leading to high concentration of SO2 in the air in Jirania Brick Industries Cluster. Trend of depletion of air quality are presented graphically in fig. 1 and fig. 2.
NO2 is basically produced from burning of fuel including coal, petrol and diesel. NO2 causes smog and acid rain. With a view to understanding the recent trend, NO2 samples were ana-
lysed and compared with the prescribed standard of CPCB.
The analytical value of NO2 ranges 10.31 µg/m3 to 16.65
µg/m3 during pre-production season and 14.27 µg/m3 to 34.11
µg/m3 at the time of production season. The values of NO2
concentration of Jirania exhibits an increasing trend of deple-
tion of air quality though there is no established threshold
health impact from exposure to NO2 .
Exceedence Facor of various pollutants as calculated are
presented in the table 2. From the table 2, it appears that ex-
ceedence factor of PM10 is more than 1.5 and exceedence factor of NO2 and SO2 are 0.232 and 0.436 respectively. Overall ex- ceedence factor of PM10 , SO2 & NO2 is 0.736. It is to be noted that value of exceedence factor more than 1.5 is considered as critical pollution. Similarly, value of exceedence factor be- tween 1- 1.5 and 0.5- 1.0 are treated as High pollution and Moderate polluition. Thus, it is presumed that the Jirania brick industries cluster moderately polluted area.
5 FIGURES AND TABLES
Fig. 1. Pollutant concentration before production of bricks.
IJSER © 2015 http://www.ijser.org
International Journal of Scientific & Engineering Research, Volume 6, Issue 4, April-2015 28
ISSN 2229-5518
Fig. 2. Pollutant concentration during the production of bricks.
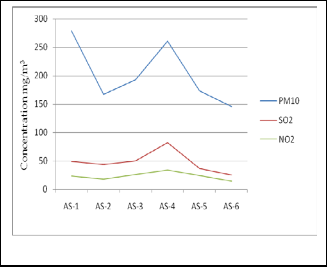
TABLE 1
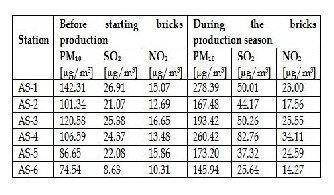
STATUS OF AIR QUALITY IN JIRANIA BRICK INDUSTRIES CLUSTER
TABLE 2
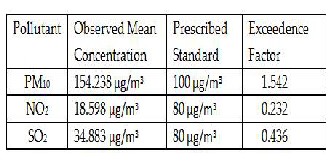
Exceedence Factor of Pollutants
6 CONCLUSION
Finding of present study is that the Jirania Brick Industries Cluster modereately polluted industrial cluster in respect of air quality. Par- ticulate matter emisiosion from the brick industries is mainly respon- sible for deterioration of ambient air quality of Jirania Brick Indus- tries Cluster apart from the other gaseous pollutants. Moreover, un- scientific siting of 64 brick industries in small area is also responsible degradation of ambient air quality. These apart, continous vehicular movement through national highway and traditional Jhum cultiva- tion may also contribute few air pollution loads in the study area. Use of high quality fuel and efficient technology will be a solution for reduction of the Particulate matter and gaseous pollutant emis- sion. Development adequate three tier plantation in and the periphery of brick industry is also suggested as preventive measures for arrest- ing particulate matter emission within the study area.
ACKNOWLEDGMENT
The corresponding Author of this paper extends his sincere gratitude and thanks to the Chairman & Member Secretary of the the Tripura State Pollution Control Board and also HoD, Civil Engineering Department of National Institute of Tech- nology, Agartala for providing their valuable supports and rendering kind cooperation.
REFERENCES
[1] Fatima I, Bhat GA, Kamili A NG (2011). Impact of Brick Kiln Emis- sions on the Ambient Air Quality and Vegetation: A Case Study of
District Budgam, M. Phil. Dissertation, University of Kashmir, India.
[2] Suman Kumar Pariyar, Tapash Das, Tanima Ferdous H., Environ- ment And Health Impact For Brick Kilns In Kathmandu Valley, inter- national journal of scientific & technology research volume 2, issue 5, may 2013
[3] Vikas Monga, L. P. Singh, A Bhardwaj, H Singh paper on “Respira-
tory health in Brick Kiln Workers”,IJPSS, volume-2, issue-4, April
2012.
[4] Khan, R.; and Vyas, H. , Study of Impact of Brick Industries on Envi- ronment & Health in Ujjain City. Journal of Environmental Research and Development, 2(3), (2008).
[5] Mabroor Hassan; Waseem Mumtaz; Ihtisham Raza; Waqar Ahmad Adil Syed, Syed Shahid Ali- Application of Air Dipersion Model for the estimation of Air Pollutants from Coal fired Brick Kilns Sample in Gujarat, Sci.Int.(Lahore),24(4),141-145,2012.
[6] S. Ahmed and I. Hossain, Applicability of air pollution modelling in a cluster of brick fields in Bagladesh, Chemical Engineering Research Bulletin 12 (2008) 28-34, 15 July 2008.
[7] Maithel S. and Uma R., Environmental regulations and the Indian
brick industry, Environ. Practice J. Nat. Asso. Environ. Professionals,
2(3), 230-231, (2000).
[8] Peng Shi et al, Cluster Analysis for Daily Patterns of SO2 and NO2
Measured by the DOAS System in Xiamen, Aerosol and Air Quality
Research, 14: 1455–1465, 2014.
IJSER © 2015 http://www.ijser.org