Figure 1.1 Overlapping clustering
International Journal of Scientific & Engineering Research Volume 2, Issue 9, September-2011 1
ISSN 2229-5518
A Fuzzy Based Evolutionary Multi-objective
Clustering For Overlapping Clusters Detection
K.P.Malarkodi, S.Punithavathy
—————————— ——————————
N this thesis we enhance the existing multi objective evolutionary clustering approach with ga using fixed length chromosome as ga with variable length chromosome and local search. Also with fuzzy ga with variable length chromosome and local search. The experimental results based on several artificial and real-world data show that the proposed fuzzy genetic based emcoc can successfully identify overlapping clusters. it also succeeds obtaining non-dominated and near-optimal clustering solutions in terms of different cluster quality measures and classification performance. The superiority of the fuzzy based emcoc over some other multi-objective evolutionary clustering
algorithms is also confirmed by the experimental results.
1.1DATA MINING OVERVIEW
Data mining, ―the extraction of hidden predictive information from large databases‖, is a powerful new technology with great potential to help companies focus on the most important information in their data warehouses. Data mining tools predict future trends and behaviors, allowing businesses to make proactive, knowledge-driven decisions. The automated, prospective analyses offered by data mining move beyond the analyses of past events provided by retrospective tools typical of decision support systems.
1.2 CLASSES OF DATA MINING DATA MINING COMMONLY INVOLVE FOUR CLASSES OF TASKS:
Clustering – is the task of discovering groups and structures in the data that are in some way or another "similar", without using known structures in the data.
Classification – is the task of generalizing known structure to apply to new data. For example, an email program might attempt to classify an email as legitimate or spam. common algorithms include decision tree learning, nearest neighbor, naive bayesian classification, neural networks and support vector machines.
Regression – attempts to find a function which models the data with the least error. Association rule learning – Searches for relationships between variables. For example a supermarket might gather data on customer purchasing habits. Using association rule learning, the supermarket can determine which products are frequently bought together and use this information for marketing purposes.
1.3 CLUSTERING
Clustering can be considered the most important unsupervised learning problem; so, as every other problem of this kind, it deals with finding a structure in a collection of unlabeled data. A loose definition of clustering could be ―the process of organizing objects into groups whose members are similar in some way‖.
IJSER © 2011 http://www.ijser.org
International Journal of Scientific & Engineering Research Volume 2, Issue 9, September-2011 2
ISSN 2229-5518
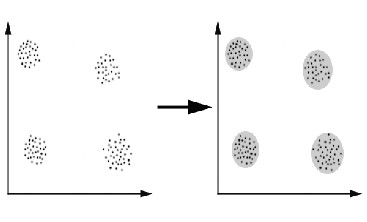
Figure 1.1 Overlapping clustering
FIGURE1 Process of organizing objects into groups
1.4 CLUSTERING ALGORITHMS
Clustering algorithms may be classified as listed below:
Exclusive Clustering
Overlapping Clustering
Hierarchical Clustering
Probabilistic Clustering
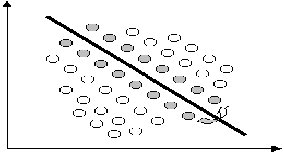
In the first case data are grouped in an exclusive way, so that if a certain datum belongs to a definite cluster then it could not be included in another cluster. A simple example of that is shown in the figure below, where the separation of points is achieved by a straight line on a bi-dimensional plane. On the contrary the second type, the overlapping clustering, uses fuzzy sets to cluster data, so that each point may belong to two or more clusters with different degrees of membership. In this case, data will be associated to an appropriate membership value.
Instead, a hierarchical clustering algorithm is based on the union between the two nearest clusters. The beginning condition is realized by setting every datum as a cluster.
Four of the most used clustering algorithms:
K-means
Fuzzy C-means
Hierarchical clustering
Mixture of Gaussians
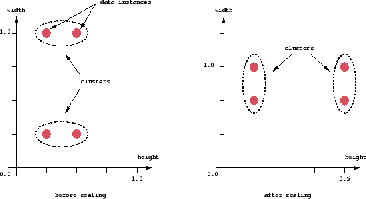
1.5 DISTANCE MEASURE
An important component of a clustering algorithm is the distance measure between data points. If the components of the data instance vectors are all in the same physical units then it is possible that the simple Euclidean distance metric is sufficient to successfully group similar data instances. However, even in this case the Euclidean distance can sometimes be misleading. Figure shown below illustrates this with an example of the width and height measurements of an object. Despite both measurements being taken in the same physical units, an informed decision has to be made as to the relative scaling. As the figure shows, different scaling can lead to
different clustering.
IJSER © 2011 http://www.ijser.org
International Journal of Scientific & Engineering Research Volume 2, Issue 9, September-2011 3
ISSN 2229-5518
most common methods.
Elitist selection: The most fit members of each generation are guaranteed to be selected.
Fitness-proportionate selection: More fit individuals are more likely, but not certain, to be selected.
Figure 1.2 Different scaling can lead to different clustering
1.6 GENETIC ALGORITHM
A genetic algorithm is a programming technique that mimics biological evolution as a problem-solving strategy. Given a specific problem to solve, the input to the GA is a set of potential solutions to that problem, encoded in some fashion, and a metric called a fitness function that allows each candidate to be quantitatively evaluated. These candidates may be solutions already known to work, with the aim of the GA being to improve them, but more often they are generated at random.
The GA then evaluates each candidate according to the fitness function. In a pool of randomly generated candidates, of course, most will not work at all, and these will be deleted. However, purely by chance, a few may hold promise - they may show activity, even if only weak and imperfect activity, toward solving the problem. These promising candidates are kept and allowed to reproduce. Multiple copies are made of them, but the copies are not perfect; random changes are introduced during the copying process. These digital offspring then go on to the next generation, forming a new pool of candidate solutions, and are subjected to a second round of fitness evaluation.
2. METHODS OF SELECTION
There are many different techniques which a genetic algorithm can use to select the individuals to be copied over into the next generation, but listed below are some of the
Roulette-wheel selection: A form of fitness-proportionate selection in which the chance of an individual's being selected is proportional to the amount by which its fitness is greater or less than its competitors' fitness.
Scaling selection: As the average fitness of the population increases, the strength of the selective pressure also increases and the fitness function becomes more discriminating. This method can be helpful in making the best selection later on when all individuals have relatively high fitness and only small differences in fitness distinguish one from another.
Tournament selection: Subgroups of individuals are chosen from the larger population, and members of each subgroup compete against each other. Only one individual from each subgroup is chosen to reproduce.
Rank selection: Each individual in the population is assigned a numerical rank based on fitness, and selection is based on this ranking rather than absolute difference in fitness.
The advantage of this method is that it can prevent very fit individuals from gaining dominance early at the expense of less fit ones, which would reduce the population's genetic diversity and might hinder attempts to find an acceptable solution.
Generational selection: The offspring of the individuals selected from each generation become the entire next generation. No individuals are retained between generations.
SSteady-state selection: The offspring of the individuals selected from each generation go back into the pre- existing gene pool, replacing some of the less fit members of the previous generation. Some individuals
are retained between generations.
IJSER © 2011 http://www.ijser.org
International Journal of Scientific & Engineering Research Volume 2, Issue 9, September-2011 4
ISSN 2229-5518
2.1 METHODS OF CHANGE
Once selection has chosen fit individuals, they must be randomly altered in hopes of improving their fitness for the next generation. There are two basic strategies to accomplish this. The first and simplest is called mutation. Just as mutation in living things changes one gene to another, so mutation in a genetic algorithm causes small alterations at single points in an individual's code.
The second method is called crossover, and entails choosing two individuals to swap segments of their code, producing artificial "offspring" that are combinations of their parents. This process is intended to simulate the analogous process of recombination that occurs to chromosomes during sexual reproduction. Common forms of crossover include single- point crossover, in which a point of exchange is set at a random location in the two individuals' genomes, and one individual contributes all its code from before that point and the other contributes all its code from after that point to produce an offspring, and uniform crossover, in which the value at any given location in the offspring's genome is either the value of one parent's genome at that location or the value of the other parent's genome at that location, chosen with
50/50 probability.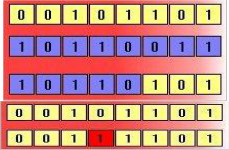
Figure 2: Crossover and mutation
The above diagrams illustrate the effect of each of these genetic operators on individuals in a population of 8-bit strings. The upper diagram shows two individuals undergoing single-point crossover; the point of exchange is set between the fifth and sixth positions in the genome, producing a new individual that is a hybrid of its
progenitors. The second diagram shows an individual
undergoing mutation at position 4, changing the 0 at that position in its genome to a 1.
2.2 EVOLUTIONARY MULTI OBJECTIVE OPTIMIZATION
Even though some real world problems can be reduced to a matter of single objective very often it is hard to define all the aspects in terms of a single objective. Defining multiple objectives often gives a better idea of the task. Multi objective optimization has been available for about two decades, and recently its application in real world problems is continuously increasing. In contrast to the plethora of techniques available for single-objective optimization, relatively few techniques have been developed for multi objective optimization. In single objective optimization, the search space is often well defined.
2.3 MULTI OBJECTIVE MODEL SELECTION
After dealing with the generation of clustering solutions in the previous section, turn our interest to model selection, that is the identification of one or several promising solutions from a large set of given clustering solutions. Model selection is particularly relevant for multi objective clustering, as the algorithm does not return a single solution, but a set of solutions representing an approximation to the Pareto front.
The individual partitioning in this approximation set correspond to different trade-offs between the two objectives but also consist of different numbers of clusters. While this may be a very useful feature under certain circumstances other applications may require the automatic selection of just one `best' solution. In this section, a method for identifying the most promising clustering solutions in the candidate set.
We will also show how this methodology, originally developed for MOCK, can also be applied to analyze the output of other clustering algorithms.
2.4 MOTIVATION OF THE RESEARCH
IJSER © 2011 http://www.ijser.org
International Journal of Scientific & Engineering Research Volume 2, Issue 9, September-2011 5
ISSN 2229-5518
Identification of overlapping clusters in complex data has been remaining as the problem to tackle. To the best knowledge, no evolutionary and unsupervised clustering approach is able to detect it successfully. Most of the existing evolutionary clustering techniques fail to detect complex/spiral shaped clusters. In the proposed research, to resolve the overlapping problems in complex shape data, Genetic Algorithm with variable length chromosome and local search, and a Fuzzy GA with variable length chromosome and local search are coupled with the existing Evolutionary Multi objective Clustering approach. The Experimental results based on several artificial and real- world data show that the proposed fuzzy based EMCOC can successfully identify overlapping clusters. It also succeeds obtaining non-dominated and near-optimal clustering solutions in terms of different cluster quality measures and classification performance.
2.5 THE PROBLEM DEFINITION AND THE PROPOSED SOLUTION
STRATEGY
A single objective clustering algorithm cannot find all the clusters if different regions of the feature space contain clusters of diverse shapes, because its intrinsic criterion may not fit well with the data distribution in the entire feature space. A related problem is that virtually all existing clustering algorithms assume a homogeneous criterion over the entire feature space. As a result, all the clusters detected tend to be similar in shape and often have similar data density. Most of the existing evolutionary clustering techniques fail to detect complex/spiral shaped clusters. They suffer from the usual problem exhibited by evolutionary and unsupervised clustering approaches.
In this, two different evolutionary multi objective clustering approaches are suggested to resolve the overlapping problems in complex shape data. A fuzzy GA based evolutionary multi objective method is proposed to detect the overlapping clusters.
2.6 INITIALIZATION BASED ON RANDOM VORONOI CELLS
In preliminary work not reported here, we investigated an
alternative representation for our EA to use, based on optimizing Voronoi cells. This representation was inspired by , where an EA was used to optimize the location of k cluster `centers', to minimize overall variance when the data points were assigned to the nearest center. This GA achieves results similar to the k- means algorithm. Our idea was to extend this representation by allowing the EA to use j > k cluster
`centers' to enable it to cope better with non-hyper spherical, and especially elongated and intertwined, clusters. In our representation, in addition to the location of the j centers, each center's label is also evolved on the genotype. However, we found that the Voronoi coding is very effective at generating diverse and high quality clustering solutions that can be used to `seed' our direct- coded EA. The initialization that we have found effective, and which we use in all our experiments, is to set j = 2k, and to place the cluster centers uniformly at random in a rectangular polytypic centered on the data, and of side-length twice the range of the data, in each objective.
IJSER © 2011 http://www.ijser.org
International Journal of Scientific & Engineering Research Volume 2, Issue 9, September-2011 6
ISSN 2229-5518
2.7 DIRECTED MUTATION BASED ON NEAREST NEIGHBORS
Numerous recombination and mutation operators in preliminary investigations not reported here, including Grouping GA-based methods, as well as multi-parent recombination based on expectation maximization of an ensemble.
The integer g itself is chosen, independently at each mutation event, uniformly at random in 0::N=k. This operator enables very large changes to result from a single mutation, yet constrains them to be `reasonable' moves which respect local distance relations. On the other hand, very small changes in the clustering solution are also possible. The operator works in linear time since the nearest neighbors of every data item can be pre-computed once at the beginning of the EA's run.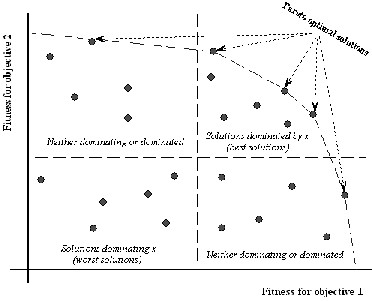
Figure 3 Numerous recombination and mutation operators
3. EVOLUTIONARY ALGORITHMS FOR MULTI OBJECTIVE
OPTIMIZATION
A number of stochastic optimization techniques like simulated annealing; tabu search, ant colony optimization etc. could be used to generate the Pareto set. Just because of the working procedure of these algorithms, the solutions obtained very often tend to be stuck at a good approximation and they do not guarantee to identify optimal trade-offs. Evolutionary algorithm is characterized by a population of solution candidates and the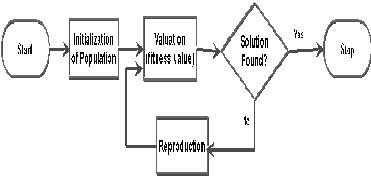
reproduction process enables to combine existing solutions to generate new solutions. Finally, natural selection determines which individuals of the current population participate in the new population
The iterative computation process is illustrated in Figure
2. Multiobjective evolutionary algorithms can yield a whole set of potential solutions, which are all optimal in some sense. After the first pioneering work on multiobjective evolutionary optimization in the eighties several different algorithms have been proposed and successfully applied to various problems.
This is the focus of research on clustering ensembles, seeking a combination of multiple partitions that provides improved overall clustering of the given data.
Robustness. Better average performance across the domains and datasets. Novelty. Finding a combined solution unattainable by any single clustering algorithm. Stability and confidence estimation. Clustering solutions with lower sensitivity to noise, outliers or sampling variations. Clustering uncertainty can be accessed from ensemble distributions. Parallelization and Scalability. Parallel clustering of data subsets with subsequent combination of results. Ability to integrate solutions from multiple distributed sources of data or attributes.
3.1MULTIOBJECTIVE OPTIMIZATION USING GENETIC ALGORITHMS
In general, these problems admit multiple solutions, each
IJSER © 2011 http://www.ijser.org
International Journal of Scientific & Engineering Research Volume 2, Issue 9, September-2011 7
ISSN 2229-5518
of which is considered acceptable and equivalent when the relative importance of the objectives is unknown. The best solution is subjective and depends on the need of the designer or the decision maker. As evolutionary algorithms are population-based methods, it is straightforward to extend them to handle multiple objectives.
Find the vector . x∗ = [x∗ 1 , x∗ 2 , . . . , x∗ n ]T of the decision variables that will satisfy the m inequality
constraints
gi ( . x) ≥ 0, i = 1, 2, . . . ,m (8) and the p equality constraints
hi ( . x) = 0, i = 1, 2, . . . , p (9) and optimizes the vector function f ( . x) = [ f1( . x), f2( . x), . . . , fk ( . x)]T . (10)
The constraints given define the feasible region F which contains all the admissible solutions. Any solution outside this region is inadmissible since it violates one or more
constraints. The vector . x∗ denotes an optimal solution in F.
The concept of Pareto optimality comes handy in the domain
of multiobjective optimization. A formal definition of Pareto optimality from the viewpoint of minimization problem may
be given as follows. A decision vector x∗ is called Pareto optimal if and only if there is no . x that dominates . x∗ , i.e.,
there is no . x such that
∀ i ∈ {1, 2, . . . , k}, fi ( . x) ≤ fi ( . x∗ ) and ∃ i ∈ {1, 2, . . . , k}, fi ( . x)
< fi ( . x∗ ).
In words, . x∗ is Pareto optimal if there exists no feasible
vector . x that causes a reduction of some criterion without a
simultaneous increase in at least another. In general, Pareto optimum usually admits a set of solutions called non- dominated solutions. There are different approaches to solving multiobjective optimization problems [13], [18], e.g., aggregating, population based non-Pareto, and Pareto-based techniques. In aggregating techniques, the different objectives are generally combined into one using weighting or goal- based method.
3.2 GENETIC ALGORITHM
A genetic algorithm is a search heuristic that mimics the process of natural evolution. This heuristic is routinely used to generate useful solutions to optimization and search problems. Genetic algorithms belong to the larger class of evolutionary algorithms , which generate solutions to optimization problems using techniques inspired by natural evolution, such as inheritance, mutation, selection, and crossover.
3.3 METHODOLOGY
In a genetic algorithm, a population of strings, which encode candidate solutions to an optimization problem, evolves toward better solutions. Traditionally, solutions are represented in binary as strings of 0s and 1s, but other encodings are also possible. The evolution usually starts from a population of randomly generated individuals and happens in generations. In each generation, the fitness of every individual in the population is evaluated; multiple individuals are stochastically selected from the current population and modified to form a new population. The new population is then used in the next iteration of the algorithm. Genetic algorithms find application in bioinformatics, phylogenetics, computational science, engineering, economics, chemistry, manufacturing, mathematics, physics and other fields.
A typical genetic algorithm requires:
A genetic representation of the solution domain, a fitness function to evaluate the solution domain. A standard representation of the solution is as an array of bits. Arrays of other types and structures can be used in essentially the same way. The main property that makes these genetic representations convenient is that their parts are easily aligned due to their fixed size, which facilitates simple crossover operations.
3.4 INITIALIZATION
Initially many individual solutions are randomly generated to form an initial population. The population
IJSER © 2011 http://www.ijser.org
International Journal of Scientific & Engineering Research Volume 2, Issue 9, September-2011 8
ISSN 2229-5518
size depends on the nature of the problem, but typically contains several hundreds or thousands of possible solutions. Traditionally, the population is generated randomly, covering the entire range of possible solutions. Occasionally, the solutions may be "seeded" in areas where optimal solutions are likely to be found.
3.5 SELECTION
During each successive generation, a proportion of the existing population is selected to breed a new generation. Individual solutions are selected through a fitness-based process, where fitter solutions are typically more likely to be selected. Certain selection methods rate the fitness of each solution and preferentially select the best solutions. Other methods rate only a random sample of the population, as this process may be very time-consuming.
3.6 REPRODUCTION
CROSSOVER AND MUTATION
The next step is to generate a second generation population of solutions from those selected through genetic operators: crossover and/or mutation. For each new solution to be produced, a pair of "parent" solutions is selected for breeding from the pool selected previously.
By producing a "child" solution using the above methods of crossover and mutation, a new solution is created which typically shares many of the characteristics of its "parents". New parents are selected for each new child, and the process continues until a new population of solutions of appropriate size is generated. Although reproduction methods that are based on the use of two parents are more "biology inspired", some research suggests more than two "parents" are better to be used to reproduce a good quality chromosome.
e.g. Given two chromosomes
10001001110010010
01010001001000011
Choose a random bit along the length, say at position 9, and swap all the bits after that point so the above become:
10001001101000011
01010001010010010
MUTATION RATE
This is the chance that a bit within a chromosome will be flipped This is usually a very low value for binary encoded genes, say 0.001. So whenever chromosomes are chosen from the population the algorithm first checks to see if crossover should be applied and then the algorithm iterates down the length of each chromosome mutating the bits if applicable.
4. TERMINATION
This generational process is repeated until a termination condition has been reached. Common terminating conditions are:
A solution is found that satisfies minimum criteria
Fixed number of generations reached
Allocated budget reached
The highest ranking solution's fitness is reaching or has reached a plateau such that successive iterations no longer produce better results
Manual inspection
Combinations of the above
5 EVALUATION OF CLUSTERING
Typical objective functions in clustering formalize the goal of attaining high intra-cluster similarity and low inter- cluster similarity. This is an internal criterion for the quality of a clustering. But good scores on an internal criterion do not necessarily translate into good
effectiveness in an application. An alternative to internal
IJSER © 2011 http://www.ijser.org
International Journal of Scientific & Engineering Research Volume 2, Issue 9, September-2011 9
ISSN 2229-5518
criteria is direct evaluation in the application of interest. For search result clustering, we may want to measure the time it takes users to find an answer with different clustering algorithms. This is the most direct evaluation, but it is expensive, especially if large user studies are necessary.
This section introduces four external criteria of clustering quality. Purity is a simple and transparent evaluation measure.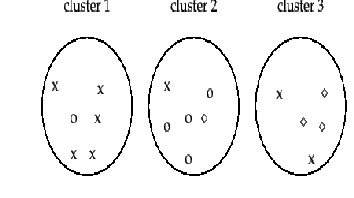
Normalized mutual information can be information- theoretically interpreted. The Rand index penalizes both false positive and false negative decisions during clustering. The F measure in addition supports differential weighting of these two types of errors.
Figure 3.2 Purity as an external evaluation criterion for cluster quality
![]()
To compute purity , each cluster is assigned to the class which is most frequent in the cluster, and then the accuracy of this assignment is measured by counting the number of correctly assigned documents and dividing by . Formally:![]()
![]()
![]()
where is the set of clusters and is the set of classes. We interpret
as the set of documents in ![]() and
and ![]() as the set of documents in in Equation 182.
as the set of documents in in Equation 182.
We present an example of how to compute purity. Bad clustering have purity values close to 0, a perfect clustering has a purity of 1. Purity is compared with the other three measures![]()
Table 1: The four external evaluation measures applied to the clustering.
purity | NMI | RI |
| |
lower bound | 0.0 | 0.0 | 0.0 | 0.0 |
Maximum | 1 | 1 | 1 | 1 |
value for Figure 16.4 | 0.71 | 0.36 | 0.68 | 0.46 |
High purity is easy to achieve when the number of clusters is large - in particular, purity is 1 if each document gets its own cluster. Thus, we cannot use purity to trade off the quality of the clustering against the number of clusters.
A measure that allows us to make this tradeoff is normalized mutual information or NMI :
IJSER © 2011 http://www.ijser.org
International Journal of Scientific & Engineering Research Volume 2, Issue 9, September-2011 10
ISSN 2229-5518
![]()
![]() is mutual information (cf. Chapter 13 , page 13.5.1 ):
is mutual information (cf. Chapter 13 , page 13.5.1 ):
(183)
thus does not formalize our bias that, other things being equal, fewer clusters are better.
The normalization by the denominator![]()
![]()
(184)
![]() (185)
(185)
![]()

![]()
where ![]() , , and are the probabilities of a document being in cluster , class , and in the intersection of and , respectively. Equation 185 is equivalent to Equation 184 for maximum likelihood estimates of the probabilities (i.e., the estimate of each probability is the corresponding relative frequency).
, , and are the probabilities of a document being in cluster , class , and in the intersection of and , respectively. Equation 185 is equivalent to Equation 184 for maximum likelihood estimates of the probabilities (i.e., the estimate of each probability is the corresponding relative frequency).![]() is entropy
is entropy
![]()
![]()
![]() (186)
(186) ![]()
![]() (187)
(187)
Where, again, the second equation is based on maximum likelihood estimates of the probabilities.![]()
![]() in Equation 184 measures the amount of information by which our knowledge about the classes increases when we are told what the clusters are. The minimum of is 0 if the clustering is random with respect to class membership. In that case, knowing that a document is in a particular cluster does not give us any new information about what its class might be. Maximum mutual information is reached for a clustering that perfectly recreates the classes - but also if clusters in are further subdivided into smaller clusters. In particular, a clustering with one- document clusters has maximum MI. So MI has the same
in Equation 184 measures the amount of information by which our knowledge about the classes increases when we are told what the clusters are. The minimum of is 0 if the clustering is random with respect to class membership. In that case, knowing that a document is in a particular cluster does not give us any new information about what its class might be. Maximum mutual information is reached for a clustering that perfectly recreates the classes - but also if clusters in are further subdivided into smaller clusters. In particular, a clustering with one- document clusters has maximum MI. So MI has the same
problem as purity: it does not penalize large cardinalities and![]()
in Equation 183 fixes this problem since entropy tends to increase with the number of clusters. For example, reaches its maximum for, which ensures that NMI is low for. Because NMI is normalized, we can use it to compare clustering’s with different numbers of clusters. The particular form of the denominator is chosen because![]()
is a tight upper bound on (Exercise 16.7 ). Thus, NMI is always a number between 0 and 1.
An alternative to this information-theoretic interpretation of clustering is to view it as a series of decisions, one for each
IJSER © 2011 http://www.ijser.org
International Journal of Scientific & Engineering Research Volume 2, Issue 9, September-2011 11
ISSN 2229-5518
![]() FN TN
FN TN
of the pairs of documents in the collection. We want to assign two documents to the same cluster if and only if they are similar. A true positive (TP) decision assigns two similar documents to the same cluster; a true negative (TN) decision assigns two dissimilar documents to different clusters. There are two types of errors we can commit. A (FP) decision assigns two dissimilar documents to the same cluster. A (FN) decision assigns two similar documents to different clusters. The Rand index ( ) measures the percentage of decisions that are correct. That is, it is simply accuracy![]()
As an example, we compute RI for Figure 16.4 . We first compute![]() . The three clusters contain 6, 6, and 5 points,
. The three clusters contain 6, 6, and 5 points,
respectively, so the total number of ``positives'' or pairs of documents that are in the same cluster is:
![]() (188)
(188)
Of these, the x pairs in cluster 1, the o pairs in cluster 2, the ![]() pairs in cluster 3, and the x pair in cluster 3 are true positives:
pairs in cluster 3, and the x pair in cluster 3 are true positives:
![]() (189
(189
)
Thus, ![]() .
.
are computed similarly, resulting in the following contingency table:
Same cluster | Different clusters | |
Same class |
|
|
Different classes |
|
|
RI is![]() .
.
The Rand index gives equal weight to false positives and false negatives. Separating similar documents is sometimes worse than putting pairs of dissimilar documents in the same cluster. We can use the F measure measuresperf to penalize false negatives more strongly than false positives by selecting a value, thus giving more weight to recall.![]()
In this paper the fuzzy and hard c-means (FCM/HCM respectively) functionals, Jm and J1, are used as fitness functions. This allows us to compare performance of the GGA with the conventional FCM/HCM algorithms and
examine GGA optimization performance with similar
IJSER © 2011 http://www.ijser.org
International Journal of Scientific & Engineering Research Volume 2, Issue 9, September-2011 12
ISSN 2229-5518
but different objective functions. It allows comparison with other GA work on clustering. Clustering algorithms such as FCM which use calculus-based optimization methods can be trapped by local extrema in the process of optimizing the clustering criterion.
The no dominated sorting genetic algorithm (NSGA) proposed was one of the first such EAs. Over the years, the main criticisms of the NSGA approach have been as follows.
High computational complexity of no dominated sorting: The currently-used no dominated sorting algorithm has a computational complexity of O (MN 3) (where M is the number of objectives and N is the population size).
This makes NSGA computationally expensive for large population sizes. This large complexity arises because of the complexity involved in the no dominated sorting procedure in every generation.
3) Lack of elitism: the elitism can speed up the performance of the GA significantly, which also can help preventing the loss of good solutions once they are found.
4) Need for specifying the sharing parameter : Traditional mechanisms of ensuring diversity in a population so as to get a wide variety of equivalent solutions have relied mostly on the concept of sharing. The main problem with sharing is that it requires the specification of a sharing parameter ( ). Though there has been some work on dynamic sizing of the sharing parameter, a parameter-less diversity-preservation mechanism is desirable.
In this paper, we address all of these issues and propose an improved version of NSGA, which we call NSGA-II. From the simulation results on a number of difficult test problems, we find that NSGA-II outperforms two other contemporary MOEAs: Pareto-archived evolution strategy (PAES)] and strength-Pareto EA (SPEA) in terms of finding a diverse set of solutions and in converging near the true Pareto-optimal set. Constrained multi objective optimization is important from the point of view of practical problem solving, but
notmuchattention has been paid so far in this respect among
the EA researchers. In this paper, we suggest a simple constraint-handling strategy with NSGA-II that suits well for any EA.
6. MEMETIC ALGORITHMS
A GA is a computational model that mimics the biological evolution, whereas a MA, in contrast mimics culture evolution. It can be thought of as units of information that are replicated while people exchange ideas. In a MA, a population consists solely of local optimum solutions.Y. S. Ong, M. H. Lim, N. Zhu, and K. W. Wong gives a comparative study in Classification of Adaptive Memetic Algorithms. One unique feature of the adaptive MAs we consider here is the use of multiple memes in the memetic search and the decision on which meme to apply on an individual is made dynamically.
This form of adaptive MAs promotes both cooperation and competition among various problem-specific memes and favors neighborhood structures containing high quality solutions that may be arrived at low computational efforts. In the first step, the GA population may be initialized either randomly or using design of experiments technique such as Latin hypercube sampling.
3. METHODOLOGY
6.1 EVOLUTIONARY MULTI OBJECTIVE CLUSTERING USING GA WITH FIXED LENGTH CHROMOSOME
Evolutionary clustering is one of the emergent and effective unsupervised clustering approaches in searching the near-optimal clustering solutions. At present, several GA based clustering technique exists. However, most of them are limited to a single objective and suffer from a number of problems. First, they usually ask the user to provide the number of clusters in advance, which is, in general, unknown to the users. Also, many existing genetic clustering approaches, such
as evolve fixed-length chromosomes that encode cluster
IJSER © 2011 http://www.ijser.org
International Journal of Scientific & Engineering Research Volume 2, Issue 9, September-2011 13
ISSN 2229-5518
centers as genes. Since the actual number of clusters is initially unknown, the fixed-length of chromosomes limits the GA to search for the near-optimal clustering solutions. Moreover, in complex data, the clustering may have different size, mixture of various data distribution, outlier, and linearly inseparable clusters. The traditional clustering methods utilizing single criterion fail to solve these issues simultaneously.
7 IMPLEMENTATION
7.1 BASIC STEPS
The approaches where data points are assigned according to their distances from cluster centers, it is very usual for any data point that its distance from two or more clusters centers are the same or equal as shown in Fig. 2(a). In that case, it is very difficult to select the cluster center into which that data pattern will be assigned. In this thesis, we proposed a new idea for solving this overlapping problem as shown in Fig.
2(b). Let θ 1 and θ2 are two angles between two cluster centers and reference point (red point) respectively. If θ 1 is less than θ 2, red point is assigned for blue cluster; otherwise it will be assigned for orange cluster. Reference point may vary for each chromosome. This method can apply not only for two clusters but also for more clusters centers when distance or similarity is equal.
Figure 3.3 (a) Overlapping problem. Fig.3.3 (b). Removing problem.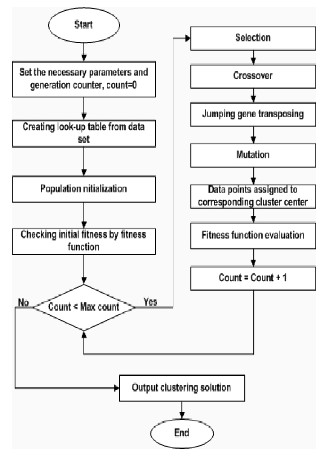
Fig. 3.4 Evolutionary cycle of EMCOC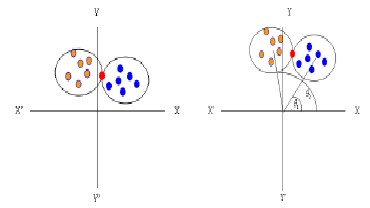
IJSER © 2011 http://www.ijser.org
International Journal of Scientific & Engineering Research Volume 2, Issue 9, September-2011 14
ISSN 2229-5518
C2= 0 1 0 0 1 0
7.2 JUMPING GENES OPERATIONS AND CROSSOVER
Jumping genes move around genome in two ways: copy and paste, and cut and paste. In copy and paste operation, one or more gene replicates itself, and is inserted into a new site, while the original one remains unchanged at same site.Example of copy and paste operation in case of a single and within two chromosomes respectively.
C1= 0 1 0 0 0 1
C1= 0 0 1 0 0 1
Copy and paste operation in the same chromosome C1. C1= 1 0 1 0 0 1
C1= 1 0 1 0 0 1
C2= 0 1 0 1 1 0
C2= 0 1 0 0 1 0
Copy and paste operation with two different chromosomes
C1 & C2
In cut and paste operation, one or more gene is cut from the original site and pasted to a new site. example of cut and paste operation in case of a single and within two chromosomes respectively.
C1= 0 1 0 0 0 1
C1= 0 0 1 1 0 0
Cut and paste operation in the same chromosome C1. C1= 1 1 0 0 0 1
C1= 1 1 1 0 0 1
C2= 0 1 0 0 1 1
Cut and paste operation with two different chromosomes C1 & C2
In some other existing algorithms, crossover operation is performed each time on a single gene position. This might yield a total number of clusters (or 1’s) smaller than Kmin. In that case, unreasonable offspring may often occur, and need to be repaired for many generations. To eliminate this problem, a modified version of crossover operator is introduced here. The number of clusters in each of a parent pair is counted, say, NC1 and NC2 respectively, and a random integer NC is generated from the range [1,M], where M = Min(NC1, NC2), and then NC gene positions having allele 1’s in each of the parents are randomly selected for crossover. The parent pair undergo crossover by exchanging alleles at the selected gene positions to introduce a pair of their offspring. The modified version of crossover operation is illustrated as follows:
Algorithm 1: Modified Crossover
1. For each pair of chromosomes Cha and Chb
Evaluate
NC1 = number of 1’s in Cha. NC2 = number of 1’s in Chb. M = Min{NC1, NC2}
2. Generate a random integer NC from the range [1, M].
3. Randomly select NC gene positions among the genes with
allele ―1‖ from Cha and form a set
Sa of indices of such selected positions. Randomly select
NC gene positions among the genes
swith allele ―1‖ from Chb and form a set Sb of indices of such selected positions.
4. S = Sa ∪ Sb
IJSER © 2011 http://www.ijser.org
International Journal of Scientific & Engineering Research Volume 2, Issue 9, September-2011 15
ISSN 2229-5518
5. for each index i in S Exchange the alleles of chromosomes Cha and Chb at gene position i.
7.3 EMCOC USING GENETIC ALGORITHM WITH VARIABLE LENGTH CHROMOSOME AND LOCAL SEARCH (MEMETIC) CROSSOVER AND MUTATION
Crossover: The purpose of the crossover operation is to create two new individual chromosomes from two existing chromosomes selected randomly from the current population. Typical crossover operations are one point crossover, two-point crossover, cycle crossover and uniform crossover. In this research, only the simplest one, the one- point crossover was adopted; the following example illustrates this operation (the point for crossover is after the
4th position):
Parent1 : Nan ( 88) ( 226) Nan (104) (50) Nan ( 192) Parent2 : (127) (88) Nan Nan ( 45) Nan (174) (101) Child1 : Nan ( 88) ( 226) Nan ( 45) Nan (174) (101) Child2 : (127) (88) Nan Nan ( 104) (50) Nan (192)
8. MUTATION
The non-uniform mutation operator is applied to the mutation operation. It selects one of the parent chromosome genes gi and adds to it a random displacement. The operator uses two uniform random numbers r1 and r2 drawn from the interval [0,1]. The first (r1) is used to determine the direction of the displacement while the other (r2) is used to generate the magnitude of the displacement. Assuming that gi € [ai, bi], where ai and bi are the gene lower and upper bounds, respectively, the new variable becomes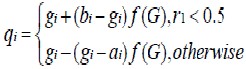
Where f(G) = [r2(1 − (G/Gmax))]p, G is the current generation, Gmax is the maximum number of generations, and p is a shape parameter.
8.1 FITNESS FUNCTION
Based on crossover and mutation the chromosomes, once initialized, iteratively evolve from one generation to the next. In order to be able to stop this iterative process, a fitness function needs to be defined to measure the fitness or adaptability of each chromosome in the population. The population then evolves over generations in the attempt to minimize the value of fitness, also called index.
8.2 APPLY VARIABLE LENGTH
We have used the same chromosome representation and crossover operation but for doing. Mathematical operations between a integer centroid value and NaN we used the following logic. We generated a random number σ between [0 1] and if the value of σ is greater than 0.5 then we take the integer centroid as resultant gene in the child chromosome., and when the value of σ is less than 0.5 NaN is taken as the resultant gene in the child chromosome. preserved.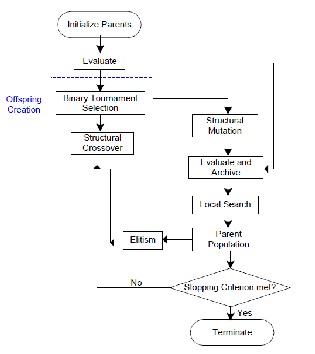
Fig 4: Flowchart genetic algorithm with variable length chromosome and local search (memetic)
IJSER © 2011 http://www.ijser.org
International Journal of Scientific & Engineering Research Volume 2, Issue 9, September-2011 16
ISSN 2229-5518
8.3 LOCAL SEARCH OPERATOR
While evolutionary algorithms (EAs) are capable of exploring and identifying promising regions of the search space, they do not exploit the search space well. Hence, local search are often used as a complement to intensify optimization results of the EAs that concentrated mainly on global exploration. With this in mind, many researchers have sought to complement the global exploration ability of EAs by incorporating dedicated learning or local search (LS) heuristics.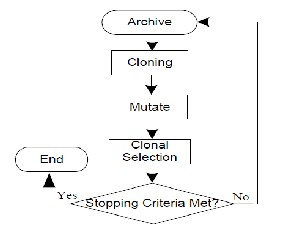
Fig 5: Flowchart for Local Search Algorithm
8.4 FUZZY GA BASED EMCOC WITH VARIABLE LENGTH CHROMOSOME AND LOCAL SEARCH (MEMETIC)
The use of variable string length genetic algorithm using newly developed point symmetry based distance is proposed for automatically evolving the near-optimal K X n non- degenerate fuzzy partition matrix U*. The set U of all possible nondegenerate partition matrices is represented as U = {U ε R KXn | uij = 1; j = 1; : : : n; 0 < uij < n; and uij ε [0; 1] }. Here we have considered the best partition to be the one that corresponds to the maximum value of the proposed FSym index which is defined later. Here both the number of clusters as well as the appropriate fuzzy clustering of the data is evolved simultaneously using the search capability of genetic algorithms.
The process of selection, crossover, and mutation continues for a fixed number of generations or till a termination condition is satisfied. For the purpose of clustering, each chromosome encodes a possible partitioning of the data, the goodness of which is computed as a function of an appropriate cluster validity index. This index must be optimized in order to obtain the best partition. Since the number of clusters is considered to be variable, the string lengths of different chromosomes in the same population are allowed to vary. As a consequence, the crossover and mutation operators are suitably modified in order to tackle the concept of variable length chromosomes.
8.5 FITNESS COMPUTATION
This is composed of two steps. Firstly membership values of n points to different clusters are computed by using the newly developed point symmetry based distance dps. Next, the FSym-index is computed and used as a measure of the fitness of the chromosome.
8.6 SELECTION
Conventional proportional selection is applied on the population of strings. Here, a string receives a number of copies that is proportional to its fitness in the population.
8.7 CROSSOVER
Crossover operator is used to generate new individual and it can retain good features from the current generation. For the purpose of crossover, the cluster centers are considered to be indivisible, i.e., the crossover points can only lie in between two cluster centers. The crossover operation, applied stochastically, must ensure that information exchange takes place in such a way that both the offsprings encode the centers of at least two clusters.
Following symbols in our crossover operator.
PA and PB: parent chromosomes. CA and CB: child
IJSER © 2011 http://www.ijser.org
International Journal of Scientific & Engineering Research Volume 2, Issue 9, September-2011 17
ISSN 2229-5518
chromosomes.
Point and Next point: crossover points.
Black A and Black B: partial chromosomes between PA and PB in each parent.
1) Randomly pick a value from 5 to length-10 as cross black, length is the length of the chromosome.
2) Pick a position in parent PA randomly. The second position will be equal to the first position plus the value of cross black. Then, cross black A is formed with the genes between and including the first and second positions.
3) To form cross black B, repeat step 2 for parent PB.
4) Find out the exceeded genes from children PA and PB by comparing the cross back B and cross black A and set genes to 0.
5) Move all the genes which value is 0 to the front o.
6) Exchange the partial schedules which gene value is 0 with cross black B and cross black A to generate children CA and CB.
8.8 MUTATION
An exchange order mutation operator will be used in this genetic algorithm. That is, partial genes (operations) are chosen randomly and then their positions are exchanged in reverse order.
The mutate operator can be summarized as follows:
1) Randomly pick a value of mutate black from 3 to length-1.
2) Randomly pick a position in parent PA. The second position will be equal to the first position plus mutate black. Then, mutate black is formed with the genes between and including the first and second positions.
3) Make mutate black in reverse order to create new gene black, and replace mutate black make in step 2. The new
chromosome M1 is child chromosome after clustering is over,
we evaluate the clusters by calculating the Purity, Rand Index, Rate of overlapping and the Time taken for clustering using respective calculations.
9. IMPLEMENTATION RESULTS AND ANALYSIS
The Fuzzy based evolutionary multi objective clustering for overlapping cluster detection is tested on six benchmark data sets known as Wine, Pima, Glass, Iris, Cancer and Spiral. Names and characteristics of all data sets available on UCI machine learning repository. These data sets are used to evaluate the performance of the Fuzzy based EMCOC
10. RESULTS AND ANALYSIS
Purity, Rand index and rate of overlapping clusters are the criteria used for cluster evaluation. Therefore, it is necessary to analyse the values of purity, rand index and rate of overlapping clusters obtained by Fuzzy based evolutionary multi objective clustering (FEMCOC), EMCOC and variable-length EMCOC for comparing the performance of FEMCOC.
10.1 COMPARISION TABLE FOR PERFORMANCE ANALYSIS
The comparative results for the Purity, Rand index, Rate of overlapping and time taken for clustering obtained by FEMCOC, EMCOC and Variable-length EMCOC in the cases of Wine, Pima, Glass, Iris, Cancer and Spiral datasets are given in Table 1. Bold characters represent better results than other methods. It is clear in the table that FEMCOC performs better than the other methods in most of the cases.
The Comparison Table is:
*********************************************************************
*****
IJSER © 2011 http://www.ijser.org
International Journal of Scientific & Engineering Research Volume 2, Issue 9, September-2011 18
ISSN 2229-5518
**************************************************************************
Purity Fixed | 6.649200 | 5.952000 | 5.027600 | 4.850100 |
4.648200 | 4.981300 |
Purity Variable 7.081700 6.833900 3.773500 6.783700
5.595000 7.101500
Purity Fuzzy 6.404500 6.165000 7.140900 9.503100
8.710600 7.237600
R.I Fixed 6.853900 3.663600 1.401200 3.727300
1.373700 1.408500
R.I Variable 1.091300 3.810000 2.340300 3.934100
2.313100 1.003900
R.I Fuzzy 1.786500 3.794400 3.293400 4.026000
2.878800 1.521100
Rate Fixed 72 31 6.650000 1.416700
7.962500 5.512500
Rate Variable 6.912500 1.366700 63 3.750000
7.525000 4.725000
remove this problem. The experimental results demonstrate that FEMCOC successfully identify the overlapping clusters in complex data set. At the same time in evaluate the Purity, Rand index, Rate of overlapping clusters and additionally time taken for clustering. Additionally we have extended the existing EMCOC algorithm with variable length chromosomes and local search(memetic) for the comparison analysis.
The significance of method and local search (memetic) operations with the proposed algorithm has been clearly shown in results. The comparison results show that proposed algorithm generally able to detect the overlapping clusters efficiently
11. FUTURE ENHANCEMENT
For the future work, it will be very interesting to apply the proposed procedure for real data sets with an abundance of irrelevant or redundant features. As a general optimization framework, the proposed algorithm can be combined with other evolutionary algorithms. Also, FEMCOC can be extended with various fitness functions and evaluation measures can be added for cluster evaluation.
Rate Fuzzy | 5.291800 | 4.587900 | 1.876200 | 2.213900 |
3.499800 | 5.516900 |
10.2 CONCLUSION AND FUTURE ENHANCEMENT
REFERENCE
Identification of overlapping clusters in complex data has been deemed as a challenging problem in the field of evolutionary clustering. Our proposed work describes fuzzy based Evolutionary Multiobjective clustering algorithm to
1. C. Blake and C. Merz. UCI repository of machine learning databases. Technical report, Department of Information and Computer Sciences, University of California, Irvine,
1998.
IJSER © 2011 http://www.ijser.org
International Journal of Scientific & Engineering Research Volume 2, Issue 9, September-2011 19
ISSN 2229-5518
2. P. Brucker. Optimization and Operations Research, chapter On the complexity of clustering problems, pages 45–54. Springer- Verlag, New York, 1977.
3. R. M. Cole. Clustering with genetic algorithms. Master’s thesis,
University of Western
Australia, Nedlands 6907, Australia, 1998.
4. D. W. Corne, N. R. Jerram, J. D. Knowles, and M. J. Oates.
PESA-II: Region-based Selection in Evolutionary Multiobjective Optimization. In Proceedings of the Genetic and Evolutionary Computation Conference (GECCO’2001), pages 283–290. Morgan Kaufmann Publishers, 2001.
5. D. W. Corne, J. D. Knowles, and M. J. Oates. The Pareto Envelope-based Selection Algorithm for Multiobjective Optimization. In Proceedings of the Parallel Problem Solving
from Nature VI Conference, pages 839–848. Springer, 2000.
IJSER © 2011 http://www.ijser.org