International Journal of Scientific & Engineering Research, Volume 4, Issue 10, October-2013 716
ISSN 2229-5518
A Virtual Instrumentation System with Nonlinear Functional Capabilities for
Studying Expansion Characteristics of Vascular Stents
Ashmi.M 1, Muraleedharan.C.V 2
1PG Scholar, Electrical Engineering Department, St.Xavier’s Catholic College of Engineering,
2Scientist-G, Sree Chitra Tirunal Institute of Medical Sciences & Technology (SCTIMST)
1Chunkankadai, K.K Dist, TamilNadu, India ashmi_mi@yahoo.co.in
![]()
Stents are tubular devices employed for providing structural support for blood vessels that are partially occluded due to atherosclerosis or other diseases. Vascular stents are used to scaffold the artery walls to preserve the vessel lumen and prevent its collapse. These stents need to be characterized to ensure appropriate performance in the patient. Tubular stents are normally crimped onto balloon catheters, which are threaded through the blood vessels to take them to the site of interest and then deployed by expanding the balloons creating a permanent plastic deformation on the metallic stent. Some of the characteristics of stent include stent expansion, radial strength and recoil. Usually the stent system is expanded up to a burst pressure of 15atm. As a part of the design verification, it is essential to characterize the expansion characteristics of the stent by applying suitable pressure of 6atm. A standard pressure / volume controller is used to generate the required pressure and the diameters would be measured using non contact laser micrometers. The instruments along with associated accessories were integrated to a personal computer using LabVIEW 8.0 development system. The system has capabilities for simulating nonlinear driving functions using piece wise linearization approach. The data acquisition and control system designed greatly reduces manual intervention while stent testing and data capturing.
Keywords- Stents, LabVIEW, Coronary Artery, Restenosis
![]()
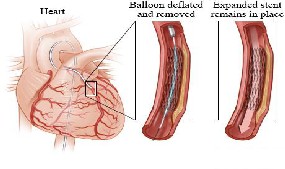
The human heart is a pear-shaped structure which is responsible for supplying the body with oxygenated blood. The coronary arteries supply the heart muscle with blood rich in oxygen. Coronary artery disease (CAD) occurs when cholesterol plaque builds up in the walls of these arteries, leading to narrowing of coronary arteries and eventually leading to myocardial infarction. Angioplasty, which involves the dilation of the artery using balloon catheters, is a common procedure employed to restore the lumen of these blocked coronary arteries. Quite often these arteries get restenosed after angioplasty. Coronary stent placement is one of the newest treatments for occlusion of the coronary arteries. This technique has the potential to minimize restenosis and reduce or eliminate abrupt closure, common complications of percutaneous transluminal coronary angioplasty (PTCA). Coronary stents are tubular metallic structures which are used to support the arteries post angioplasty. An empty and collapsed balloon on a guide wire, known as balloon catheters, is passed into the narrowed locations and then inflated to a fixed
size using water pressures 75 to 500 times normal blood pressure (6 to 20 atmospheres). The balloon crushes the fatty deposits, so opening up the blood vessel to improved flow, and the balloon is then collapsed and withdrawn thereby creating a permanent plastic deformation on the metallic stent. The stent placement is depicted in Fig.1.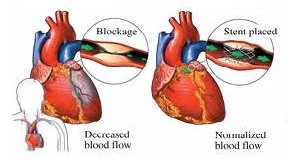
Fig.1: Before and after stent placement
IJSER © 2013 http://www.ijser.org
International Journal of Scientific & Engineering Research, Volume 4, Issue 10, October-2013 717
ISSN 2229-5518
With the usage of stents, restenosis rate was reduced to approximately 12-25 per cent as compared to 50-
65 per cent without it. The life cycle of medical vascular stent, which is composed of three phases of mounting, deployment and long-term in vivo service, is pointed out and the characteristics of stent expansion process are emphasized in [1]. For the balloon expandable stents, the maximum strength and radial stiffness are inversely proportional to the expansion of a stent, as long as geometrical changes of the metal struts caused by different expansion ratios are negligible [2]. The effect of varying stent design parameters is estimated by Finite Element Method (FEM) [3]. Stent flexibility for very short stents increases with increasing stent length [4]. Electrochemical technique is capable of measuring wall shear stress (WSS) in stented vessels during pulsatile flow. The fluid structure interaction in stented area alters the wall shear stress [5].
Micro machined Antenna Stents and Cuffs were used for monitoring intraluminal pressure and flow [6]. Flow sensing is facilitated primarily by an intraluminal cuff that senses EM voltage so that both pressure and flow of insulating and conductive liquids can be monitored. It provides a more direct measurement of flow velocity; however it does not provide pressure information. A neural network model with high nonlinear recognition capability to describe the relationship between the deformation impact factors and the deformation results of vascular stent was analyzed in [7]. The proposed method not only helps to optimize the stent geometric configuration but also provides a new method to find the disciplinarian of stent expansion and deformation.
Many studies and efforts have gone into the
application of stents in medical field. Angioplasty may have to be repeated if the same artery becomes blocked again, a condition called restenosis. If a stent is placed at the time of the angioplasty, the chance of restenosis may be reduced but can still occur. Though many in silico techniques are put forth for the characterization of coronary stents, experimental methods continue to be most reliable. Implementation of nonlinear pressure functions is essential for the proper characterization of the stents. Piece wise linearization is an effective technique for the implementation of nonlinear functions, in systems which are inherently capable of linear functionality.
Tubular stents are normally crimped onto balloon catheters, which are threaded through the blood vessels to take them to the site of interest and then deployed by expanding the balloons creating a permanent plastic deformation on the metallic stent.
As part of the design verification, it is essential to characterize the expansion characteristics of the stent by applying a pressure (6atm). Fig.2. shows the experimental setup for linear characterization of vascular stents.
2(a) Experimental Setup for Linear Characterization of Vascular Stents
Fig.2: Block diagram representation of entire setup
The standard pressure controller is a microprocessor controlled hydraulic actuator for the precise regulation and measurement of liquid pressure and volume change. The values of the fluid pressure and volume are written on the buffer. These values are being passed through RS-232 cable to PC. RS-232 acts as the interface between PC and standard pressure controller (STDDPC).The diameters of the stents are measured using non-contact laser micrometers and those values are also passed through RS-232 and finally reach the end user. A photograph of the GDS pressure controller and CCD Micrometer is shown in Fig.3 and Fig.4 respectively.
The instruments along with associated accessories were integrated to a personal computer using LabVIEW 8.0 development system. Virtual instrumentation software developed on LabVIEW with VISA serial communication feature is used to control the instrument through RS-232 communication port. The VI controls the instrument and also records the pressure, volume and diameter waveforms and a feedback would be used to control the pressure rise in the system.
The GDS digital controller is a microprocessor controlled hydraulic actuator for the precise regulation and measurement of liquid pressure and volume change. De-aerated water in a cylinder is pressurized and displaced by a piston moving in the cylinder. The piston is activated by a ball screw turned in a capacitive ball nut by a stepping motor and gearbox that move rectilinearly on a ball slide.
The pressure is detected by means of an integral solid state pressure transducer. Control algorithms are built in the programmable memory to cause the motor to
IJSER © 2013 http://www.ijser.org
International Journal of Scientific & Engineering Research, Volume 4, Issue 10, October-2013 718
ISSN 2229-5518
seek to a target pressure or step to a target volume change.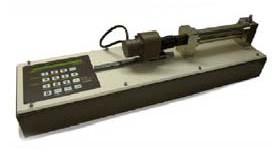
Fig.3: GDS Pressure Controller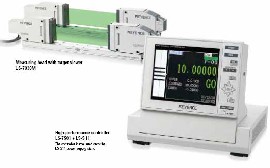
Volume change is detected by counting the steps of the stepping motor. Analogue feedback is used to control the pressure rise in the system. The GDS digital controller generates, measures and logs both liquid pressure and volume change.
Fig.4: CCD/LASER Micrometer
The stent is crimped on a balloon catheter and placed in front of the lens. The target viewer function allows aligning the optical axis exactly to the desired measurement point even if a target has a complicated shape or is very small. The controller can connect two measuring heads. Since the controller allows simultaneous output from two channels, both inspection of an outer diameter and eccentricity of the stent can be performed at the same time. Simultaneous measurement with two heads is also possible. The measuring area for the current measurement mode is displayed in real time.
Some of the recommended measurement methods for the dimensional attributes of vascular stents which are relevant to successful clinical performance are described below and the setup is illustrated in Fig.5 and Fig.6.
The test is carried out by introducing the stent into a thin walled latex tube of the target diameter and loading the assembly by an increasing outer hydraulic pressure. Pressure was applied to the fixture using GDS pressure controller and readings were tabulated both with and without stent. The pressure vs diameter graph is plotted.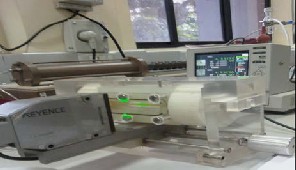
Fig.5: Arrangement for crush resistance test
The stent system selected was
3.2mm(diameter) x 18mm(length) stent crimped on
3mm(diameter) x 17mm(length) balloon catheter
system. The stent system was connected to the pressure controller and the pressure was applied at a rate of 10KPa/sec till the stent diameter of 3.2mm was reached. Then the corresponding pressure and diameter waveforms were plotted with respect to time.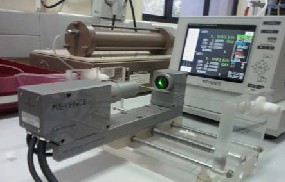
Fig.6: Arrangement for evaluating stent system compliance
IJSER © 2013 http://www.ijser.org
International Journal of Scientific & Engineering Research, Volume 4, Issue 10, October-2013 719
ISSN 2229-5518
2(b) Experimental Setup for Non-Linear
Characterization of Vascular Stents
Fig.7: Block diagram representation of the setup
De-aerated water is filled inside balloon catheter and fed to the GDS Advanced Pressure/Volume Controller which measures the fluid pressure and detects the volume change. The instrument is integrated to a personal computer using LabVIEW
8.0 development system. Virtual instrumentation software developed on LabVIEW with VISA serial communication feature is used to control the instrument through RS-232 communication port. The system designed in LabVIEW has the capabilities for simulating nonlinear driving functions using piece wise linearization approach.
Piecewise linearization is widely used for the approximation of nonlinear systems. The main reason for its wide usage in nonlinear system modeling and analysis lies in the availability of well-established tools in linear systems theory for analysis over each region where the characteristics are approximately linear. In one dimension, a nonlinear function can be approximated by a sequence of piecewise linear functions. Generally, the more linear segments used to approximate a non-linear function, the more accurate results can be expected.
Exponential Growth
Stents are normally crimped onto balloon catheters and then the balloon is expanded by applying a target pressure of 800kPa with different time intervals varying from at 5seconds to 30 seconds. Pressure rise will be very slow at the start and then rises abruptly and so the dimensions of the stent also vary and the changes in diameter are measured using digital laser micrometer. When the pressure reaches 800kPa, in order to achieve the required rearrangement of the stent strut structures, it will hold for few seconds (5sec). The balloon’s mechanical properties vary dramatically during the expansion process. Though it begins as a highly flexible material, the balloon then eventually expands in a nonlinear fashion as it nears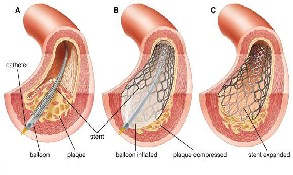
stent’s final diameter. The stages of stent expansion and deflation are depicted in Fig.8 and Fig.9.
Fig.8: Stages of stent expansion
Negative pressure should not be induced on the delivery system because it may cause dislodgement of the stent from the balloon. Inflation pressures routinely used for stenting vary widely between different laboratories and operators, typically ranging from 12 to 18 atm. Many physicians implant stents at
10 to 12 atm, and then terminate the procedure if the angiographic appearance is acceptable.
Exponential Decay
Now the stent is placed in the diseased artery and so the pressure should be reduced in order to remove the balloon catheter and pressure is lowered to 0kPa. The balloon should be removed after confirming complete deflation. Finally stent is being implanted in the blood vessel.
Fig.9: Balloon deflation
2(c) Implementation of the System
The system was implemented as described in the previous sections and the response of the pressure controller was studied. Fig.10. shows the typical pressure waveform consisting of an exponential buildup, a stable pressure region where the stent expansion gets completed, followed by a deflation stage which is also exponential.
IJSER © 2013 http://www.ijser.org
International Journal of Scientific & Engineering Research, Volume 4, Issue 10, October-2013 720
ISSN 2229-5518
700
600
500
400
300
200
100
0
-100 0 10 20 30 40
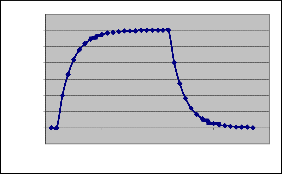
Fig.10: Pressure waveform required to be generated
This input waveform was constructed from the model given below.
P(t) = 600 (1-e-t/τ), 0 < t ≤15
= 600, 15<t ≤ 20
= 600 e-t/τ , t > 20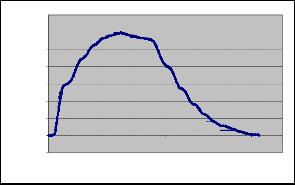
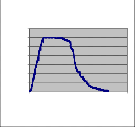
where, P is input in kPa and τ is the pressure controller system time constant for which the manual control was estimated as 2.5 seconds during the installation and operational qualification of the system. On implementation in the nonlinear control system, the output pressure waveform obtained is depicted in Fig.11. The odd outliers seen in the pressure waveform was due to the aliasing effect of the data acquisition system.
700
600
The characterization of the dimensional attributes of vascular stents is determined by carrying out Crush Resistance and Stent System Compliance test and the experimental results are depicted in Fig.12 and Fig.13.
Fig.12: Pressure vs Diameter for crush resistance test
From the graph we have observed that the experimented stent can withstand a pressure pulse of over 200KPa without considerable change in its outer diameter. It could be seen that the physiological artery without implanted stent just crimped near about 100KPa which in turn proves that latex tube [physiological artery] could withstand an additional 100KPa with stent implanted.
500
400
300
200
100
0
-100 0 10 20 30 40
Fig.11: Pressure waveform generated using the controller
The root mean square error associated between the required and observed pressure waveforms was estimated as a marker(2.1) as below for assessing the quality of the control function.
( Pi − Po) 2
![]()
RMSE =
n
where Pi and Po are the corresponding required pressure and observed output pressure respectively and n is the number of data points.
Fig.13: Pressure and Diameter vs Time for stent system compliance
From the graph we can observe that the stent expands to a diameter of 3.213mm at a pressure of
1361kPa also the stent system diameter is constant till 400kPa at 1.3 diameter and then increases abruptly to 2.75mm (diameter). Maximum pressure (1400kPa) is obtained at 3.2mm diameter.
IJSER © 2013 http://www.ijser.org
International Journal of Scientific & Engineering Research, Volume 4, Issue 10, October-2013 721
ISSN 2229-5518
Following studies were carried out on the system to establish its suitability in stent testing.
(a) Effect of the nonlinear control function on the time response characteristics were estimated by studying the effect of time constant on the RMSE values for various time constants ranging from 0.5 seconds to 5 seconds in suitable steps. Time constant which yields minimum RMSE was chosen for all subsequent experiments.
(b) A more realistic pressure waveform incorporating a linear ramp, pressure hold followed by an exponential decay also was simulated using the system. This was carried out for various pressure ramps ranging from 80 kPa
/ second to 400 kPa/second.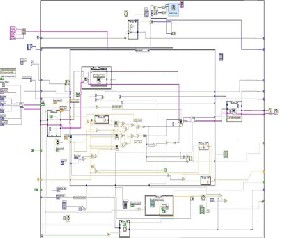
Fig.14: Block diagram- Pressure (Piece-wise
Linearization)
The piece-wise linearization block diagram simulated in LabVIEW is shown in Fig.14. The whole process is divided into 3 steps mainly inflation, hold and deflation.
STEP 1: INFLATION
For the inflation step the upper value (UP1), lower value (LV1), number of steps (N) and ramp time (RT) are fed taken as input parameters. The VI automatically calculates the time per step(Ts) by dividing the ramp time with the number of steps. Time/Kpa is then calculated by dividing UP1with Ts. Later on the input parameters UP1, LV1, Time/Kpa are given as input to the Ramp.vi. The Ramp.vi integrates the values to a string that is sent to the PC for inflating the balloon.
STEP 2: HOLD
The pressure is held by the HOLD function for the prescribed time in sec that is converted into milliseconds by multiplying by 1000.
STEP 3: DEFLATION
After the indicated hold time, the deflated lower value LV2 and UP1 is given to the Dexpon.vi which initializes the lower value (LVx) for each step of deflation. The VI automatically calculates the time per step(Ts) by dividing the deramp time with the number of steps. Time/Kpa is then calculated by dividing LVx with Ts. Later on Time/Kpa is given as input to the Deramp.vi that again integrates the values to a corresponding string which is sent to the PC for deflation.
The results from the study to assess the effect of the nonlinear control function on the time response characteristics are shown in Fig.15. The pressure waveforms for the time constant varying from 0.5 seconds to 5 seconds were obtained and the corresponding RMSE was observed.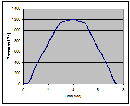
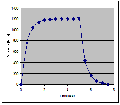
Fig.15: Pressure waveforms required (left) and observed (right) for an assumed time constant of 0.5 seconds.
Table [4.1]: Variation of RMSE with the system time constant
IJSER © 2013 http://www.ijser.org
International Journal of Scientific & Engineering Research, Volume 4, Issue 10, October-2013 722
ISSN 2229-5518
From the table 4.1 it can be seen that the most appropriate time constant for the system is about 3 seconds, which is very close to the time constant observed during the installation qualification of the hardware. It should be noted that the system time constants are influenced by the preparation of the pressure controller, including the de-airing of water used in the controller. The achieved time constant of
3 seconds is found to be adequate for the stent testing as most of the expansion characterization need only to be completed in 20 to 30 seconds. It can be observed that the RMSE value are relatively low and comparable to the previous experiments and hence establishes the suitability of the system for stent expansion characterization.
control. The detailed characterization showed that the system with nonlinear capability retains its transient response characteristics to be effectively used for stent characterization.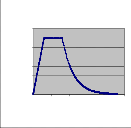
In addition, the nonlinear characterization of the balloon catheter in ranges from 0 to 1200Kpa can be performed and the varying performance graphs can be plotted and a five step piece wise linearization technique was utilized which gave better results. Currently the implementation works on an open loop piece wise linearization which could be the reason for marginal change in the system time constant. Future work includes modification of open loop to closed loop control based on a look up table which is generated based on the required pressure waveform, then the system characteristics could be enhanced
MEASURED PRESSURE
further.
1400.00
1200.00
1000.00
800.00
600.00
400.00
200.00
0.00
0 5 10 15 20 25
Time(sec)
1400
1200
1000
800
600
400
200
0
0 10 20 30
Time(sec)
1. YueXuan Wang, Hong Yi and ZhongHua Ni, “Experimental Research on Balloon-expandable Endovascular Stent Expansion”, IEEE Conference on Engineering in Medicine and Biology, 2005, pp.
2272-2275.
2. Stephan Schrader, Rafael Beyar, “Evaluation of
Fig.16: Pressure waveforms required (left) and
observed (right) for time constant of 3 seconds (Ramp
Time: 3seconds)
The pressure waveforms were obtained by varying the ramp time from 3 seconds to 15 seconds and the corresponding RMSE was estimated.
Table [4.2]: Variation of RMSE with the system time constant (3seconds)
Ramp Time | System Time Constant | RMSE Value Estimated |
3 | 3 sec | 35.45 |
6 | 3 sec | 32.97 |
9 | 3 sec | 30.12 |
12 | 3 sec | 33.87 |
15 | 3 sec | 37.92 |
The expansion characteristics of coronary stents were studied by using piece wise linearization strategy for generating nonlinear pressure waveforms. The system time constant was found to change marginally from
2.5 seconds to 3 seconds when the piece wise linearization approach was employed for pressure
the Compressive Mechanical Properties of Endoluminal Metal Stents”, Journal Of Artificial Organs, 1998, pp.179-187.
3. Xiang Shen, Hong Yi, Zhonghua Ni, “Effects of Stent Design Parameters on Radial Force of Stent”, IEEE Conference on Bioinformatics and Biomedical Engineering, 2008, pp. 1712-1715.
4. John Ormiston, Simon Dixon, Mark Webster, “Stent Longitudinal Flexibility: A Comparison of 13
Stent Designs Before and After Balloon Expansion, Catheterization and Cardiovascular Interventions”, Wiley Publications- Catheterization and Cardiovascular Interventions , Vol.50, 2000,
pp.120–124.
5. Cheng Jie, Ni Zhonghua, “One Dimensional Modeling and Computation of Blood Flow and Pressure of a Stented Artery”, IEEE Conference on Bioinformatics and Biomedical Engineering, 2009, pp.246-250.
6. Kenichi Takahata, Yogesh B. Gianchandani, “Micromachined Antenna Stents and Cuffs for Monitoring Intraluminal Pressure and Flow”, IEEE Journal Of Microelectromechanical Systems, Vol.15,
2006, pp.1289-1297.
7. Ni ZhongHua, Gu XingZhong and Wang
YueXuan, “Rapid prediction method for nonlinear expansion process of medical vascular stent”, International Journal of Cardiology, Vol.52, 2009, pp. 1323-1330.
IJSER © 2013 http://www.ijser.org