Sample templates are shown in the Figures 3 and 4 below:
International Journal of Scientific & Engineering Research, Volume 5, Issue 9, September-2014 656
ISSN 2229-5518
A Review of the Real-time intelligent alarm system of driver fatigue & Driver Drowsiness based on Emotive EPOC
Sumegh Tharewal, Sangramsing Kayte, Mohammed Waseem Ashfaque
Sayyada Sara Banu , Dr.Bharti Gawali
Abstract— Driver safety is of utmost importance in the Indian, a country with approximately 308 million licensed drivers (Our Nation’s Highways, 3010). Driving while distracted or drowsy decreases performance and endangers lives. Yet in today’s bustling society, driving when distracted and/or sleepy is unfortunately more often the norm than the exception. In order to construct appropriate countermeasures to drowsy and distracted driving, it is important to understand how distraction and sleepiness affect driving. Therefore, we examined how objective markers of physiological sleepiness and simulated driving performance were influenced by time awake and cognitive distraction (referred to in this thesis as cognitive engagement) by using a 30-min driving simulation during 24-hrs of continuous wakefulness. In general, increased markers of physiological sleepiness and decreased driving performance were associated with increased time awake. Our results suggest that during extended wakefulness.
Index Terms— Intelligent Transportation System, Driver Fatigue Detection.
—————————— ——————————
river drowsiness is one of the major causes of serious traf- fic accidents. According to the National Highway Traffic Safety Administration (NHTSA) [1], there are about 56,000 crashes caused by drowsy drivers every year in India, which results in about 1,550 fatalities and 40,000 nonfatal injuries an- nually. The actual tolls may be considerably higher than these statistics, since larger numbers of driver inattention accidents caused by drowsiness are not included in above numbers [1]. The National Sleep Foundation also reported that 60% of adult drivers have driven while felling drowsy in the past year, and
37% have ever actually fallen asleep at the wheel [2]. For this reason, a technique that can real-time detect the drivers’ drows- iness is of utmost importance to prevent drowsiness-caused accidents. If drowsiness status can be accurately detected, inci- dents can be prevented by countermeasures, such as the arous- ing of driver and deactivation of cruse control. Sleep cycle is divided into no-rapid-eye-movement (NREM) sleep and rapid- eye-movement (REM) sleep, and the NREM sleep is further divided into stages 1-4. Drowsiness is stage 1 of NREM sleep – the first stage of sleep [3]. A number of efforts have been report- ed in the literature on the developing of drowsiness detection systems for drivers. NHTSA also supported several research
projects on the driver drowsiness detection. These drowsiness
detection methods can be categorized into two major approach- es:
This approach analyses the images captured by cameras to de- tect physical changes of drivers, such as eyelid movement, eye gaze, yawn, and head nodding[4][5]. For example, the PER- CLOS system developed by W. W. Wierwile et. Al. [5][6] used camera and imaging processing techniques to measure the per- centage of eyelid closure over the pupil over time [7][8][9]. The three-in-one vehicle operator sensor developed by Northrop Grumman Co. also used the similar techniques [10]. Although this vision based method is not intrusive and will not cause an- noyance to drivers, the drowsiness detection is not so accurate, which is severely affected by the environmental backgrounds, driving conditions, and driver activities (such as turning around, talking, and picking up beverage). In addition, this ap- proach requires the camera to focus on a relative small area (around the driver’s eyes). It thus requires relative precise cam- era focus adjustment for every driver.
Using the estimated face position detected in the previous frame, the subsequent images are searched for the eyes using
IJSER © 2014 http://www.ijser.org
International Journal of Scientific & Engineering Research, Volume 5, Issue 9, September-2014 657
ISSN 2229-5518
the reference templates. For this operation, a grayscale correla- tion pattern matching method is used. The templates consist of four different images, namely the left open eye, left closed eye, right open eye and right closed eye. Using the reference eye patterns, the image is searched for localizing the eyes during the eye-tracking phase.
Sample templates are shown in the Figures 3 and 4 below:
Fig 3. Open eye template. Fig 4. Closed
Eye templates at different head orientations or rotations were not used as this could increase the computational time for each image. A grayscale correlation method is used. The tem- plates are matched with every pixel in the region being searched and a match score is assigned to each pixel in the target image.
The match r is computed as: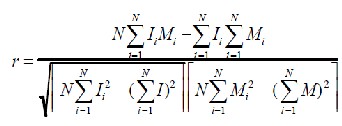
Where N is the number of pixels in the model, M is the model and I is the image against which the pattern is being com- pared. A match computed by the above expression is unaffect- ed by linear changes in the image or model pixel values. In other words, the search is just as efficient even if the image gets brighter or darker. The value of r reaches a maximum of 1 when the model matches perfectly with the image or 0 when there is no match. The actual match scores are computed as:
The system consists of three well-defined phases, namely the face detection, eye tracking and fatigue detection. The se-
quences of images from the camera are fed to the system. Ini-
tially, the system doesn’t know the initial position of the face. The system grabs the first image and tries to find the face re- gion in the image using the skin color model. Due to unfa- vorable lighting conditions or initial head orientation of the driver, the localization might fail. So the system grabs anoth- er frame and repeats the same process until the face region is detected with certainty. It is assumed that the person’s head is not displaced a lot from the previous position between two consecutive frames. So after the face is detected, the eyes are tracked in the region and monitored to detect micro-sleeps. The eye templates obtained previously for the driver are used for localizing the eyes. The eyes are analysed to determine whether they are open or closed. This information obtained for each frame is passed on to the fatigue detection phase if there is no tracking error. The system doesn’t relocalize the eyes unless there is a tracking error. If there is, the area searched is increased in size. So even if the face is displaced significantly between frames, the eyes can still be localized.
Possible techniques for detecting drowsiness in drivers can be generally divided into the following categories: sensing of physiological characteristics, sensing of driver operation, sens- ing of vehicle response, monitoring the response of driver.
Among these methods, the techniques that are best, based on accuracy are the ones based on human physiological phenom- ena. This technique is implemented in two ways: measuring changes in physiological signals, such as brain waves, heart rate, eye blinking and measuring physical changes such as sagging posture, leaning of the driver’s head and the open/closed states of the eyes. The first technique, while most accurate, is not realistic, since sensing electrodes would have to be attached directly onto the driver’s body, and hence be annoying and distracting to the driver. In addition, long time driving would result in perspiration on the sensors, diminish-
IJSER © 2014 http://www.ijser.org
International Journal of Scientific & Engineering Research, Volume 5, Issue 9, September-2014 658
ISSN 2229-5518
ing their ability to monitor accurately. The second technique is well suited for real world driving conditions since it can be non-intrusive by using optical sensors of video cameras to detect changes.
Driver operation and vehicle behaviour can be implemented by monitoring the steering wheel movement, accelerator or brake patterns, vehicle speed, lateral acceleration, and lateral displacement. These too are non-intrusive ways of detecting drowsiness, but are limited to vehicle type and driver condi- tions. The final technique for detecting drowsiness is by moni- toring the response of the driver. This involves periodically requesting the driver to send a response to the system to indi- cate alertness. The problem with this technique is that it will eventually become tiresome and annoying to the driver.
The word appropriate is inherently subjective and contextual-
ly dependent. What is appropriate in one situation may not be in another. For a safety critical system, however, one effec- tiveness measure that can be applied is whether or not system provides timely and accurate warnings. In this context, accu- rate means that the warning has a direct correlation to the driver’s eye closure as it relates to drowsiness and that the warning is issued without delay. Assuming that this is the case, this leaves the characteristics of effectiveness in the quali- tative realm of user acceptance and behaviour.
For example, does the driver:
• Heed or ignore the warning system?
• Believe in the accuracy of the system against self- assessments of drowsiness?
• Perceive benefits of warnings and accept false alarms?
• Take mitigating measures and/or stop driving when necessary?
• Make behavioral changes both on- and off-road to decrease the likelihood and frequency of drowsiness episodes?
Introducing new technology into a community can lead to change within that community. This change has a direct rela- tionship with the effectiveness of the system.
EEG is one of the most widely used non-invasive techniques for recording electrical brain activity. After its discovery, this technique has been employed to answer many different ques- tions about the functioning of the human brain and has served
as a diagnostic tool in clinical practice. Electroencephalo- graphs, thus, measure membrane potential variations occur- ring in neu-rons. The polarity of the signal changes according to the location of the synapses, being excitatory and inhibitory synapses inversely correlated. For excitatory, the polarity is nega-tive when located in superficial cortical layers and posi- tive when close to the soma of a cell, while the opposite hap- pens for inhibitory synapses (Hoffmann 2007). Although the cerebral activity is better detected over the region of interest, the volume conduction in the cerebrospinal fluid, skull and scalp allows the signal to spread to distant electrodes. Addi- tionally, this barrier created between the neurons and the sen- sors makes frequencies over 40 Hz almost invisible. Both these conditions generally restrict EEG to global measurements of the brain activity (Hoffmann 2007).
Hz. It emerges with closing of the eyes and with relaxation, and attenuates with eye opening or mental exertion [27].
30 Hz. Beta activity is closely linked to motor behavior and is generally attenuated during active movements. Low ampli- tude beta with multiple and varying frequencies is often asso- ciated with active, busy or anxious thinking and active con- centration [27].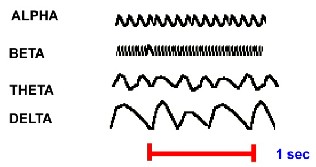
Typical EEG wave forms are
Fig 5. Typical EEG wave forms
IJSER © 2014 http://www.ijser.org
International Journal of Scientific & Engineering Research, Volume 5, Issue 9, September-2014 659
ISSN 2229-5518
5.2 EEG Sensors and Data Collection
EEG signals are collected by using a Emotiv Epoc system, which is neuro-signal acquisition and Processing wireless neu- roheadset. It uses a set of sensors to tune into electric signals produced by the brain to detect thoughts, feelings and facial expressions and connects wirelessly to computer. The meas- ured raw data is processed in different platforms (MATLAB,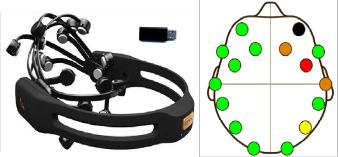
.NET) [27].
(A) (B)
Fig 6. (A) The Emotiv EPOC neuroheadset and the wireless
USB receiver. (B) A picture that shows with intuitive colors the contact quality of the neuroheadset on the user head.
The Research Edition SDK includes a research headset: a 14 channel (plus CMS/DRL references, P3/P4 locations). Chan- nel names based on the International 10-20 locations are: AF3, F7, F3, FC5, T7, P7, O1, O2, P8, T8, FC6, F4, F8, and AF4. Other specifications are listed below in Table 1 and the positions used are shown in Figure 2[27].
Table 1. Specifications of Emotiv EPOC used in EEG signal collection [27]
Driver drowsiness is a major, though elusive, cause of traffic crashes. In this research to monitor driver safety by analyzing information related to fatigue using Emotive signals and to avoid the accidents. The Emotive signals are decomposed into time–frequency representations using wavelet transform and statistical features are calculated to depict their distribution. A power spectra-based system has been implemented for the classification of Emotive signals using the statistical features extracted from wavelet coefficients as inputs. The extracted Emotive signals are delta, theta, alpha and beta depends on these frequency values measure the driver fatigue. A warning alarm is applied if driver fatigue is believed to reach a defined threshold.
[1] NCSDR/NHTSA Expert Panel on Driver Fatigue and Sleepiness, Drowsy driving and automobile crashes, DOT Report HS-808-707, NHTSA, Washington, D.C., 1998.
[2] M. R. Rosekind, “Underestimating the societal costs of impaired alertness: safety, health and Productivity risks,” Sleep Medicine, vol.
6, pp. S21-S25, 2005.
[3] J. Gackenbach, Sleep and dreams: A sourcebook, New York: Gar- land, 1986.
[4] H. Ueno, M. Kaneda, and M. Tsukina, “Development of drowsiness detection system, “Proceedings of the 1994 Vehicle Navigation & In- formation Systems Conference, pp. 15-20,Yokohama, Japan, Aug. 31- Sep.2, 1994.
[5] J. Chu, L. Jin, L. Guo, K. Guo, and R. Wang, “Driver’s eye state de- tecting method design based on eye geometry feature,” 2004 IEEE In- telligent Vehicles Symposium, Parma, Italy, pp.357-362, 2004.
[6] Q. Ji, Z. Zhu, and P. Lan, “Real-time nonintrusive monitoring and prediction of driver fatigue,” IEEE Transactions on Vehicular Tech- nology, vol. 53, pp. 1052-1069, 2004.
[7] W. W. Wierwille, S. S. Wreggit, C. L. Kirn, L. A. Ellsworth, and R. J.
Fairbanks III, Researchon vehicle-based driver status/performance monitoring: development, validation, and refinement of algorithms for detection of driver drowsiness, National Highway Traffic Safety Administration, U.S. DOT Tech Report No. DOT HS 808 247, 1994.
[8] W. W. Wierwille, M. G. Lewin, and R. J. Fairbanks III, Final report: Research on vehiclebased driver status/performance monitoring, Part I, Part II, Part III, National Highway Traffic Safety Administra- tion, U.S. DOT Tech Report No. DOT HS 808 638, 1996.
[9] [9] E. M. Ayoob, R. Grace, and A. Steinfeld, “A user-centered
IJSER © 2014 http://www.ijser.org
International Journal of Scientific & Engineering Research, Volume 5, Issue 9, September-2014 660
ISSN 2229-5518
drowsy-driver detection and
[10] warning system,” Proceeding of the 2003 Conference on Designing for User Experiences, San Francisco, CA, pp. 1-4., 2003.
[11] R. P. Hamlin, Three-in-one vehicle operator sensor, Transportation Research Board, National Research Council, IDEA program project final report ITS-18, 1995.
[12] H. J. Eoh, M. K. Chung, and S.-H. Kim, “Electroencephalographic study of drowsiness in simulated driven with sleep deprivation,” In- ternational Journal of Industrial Ergonomics, vol. 35, pp. 307-320,
2005.
[13] C. T. Lin, R. C. Wu, S. F. Liang, W. H. Chao, Y. J. Chen, and T. P.
Jung, “EEG-based drowsiness estimation for safety driving using in- dependent component analysis,” IEEE Transaction on Circuits and Systems, vol. 52, pp. 2726-2738, 2005.
[14] S. K. L. Lal, A. Craig, P. Boord, L. Kirkup, and H. Nguyen, “Devel- opment of an algorithm for an EEG-based driver fatigue counter- measure,” Journal of Safety Research, vol. 34, pp. 321-328, 2003.
[15] European Society of Cardiology and the North American Society of Pacing and Electrophysiology, “Heart Rate Variability: Standards of measurement, physiological interpretation, and clinical use,” Euro- pean Heart Journal, vol. 19, pp. 354-381, 1996.
[16] S. Elsenbruch, M. Harnish, and W. C. Orr, “Heart rate variability during waking and sleep in healthy males and females,” Sleep, vol.
22, pp.1067-1071, 1999.
[17] L. Toscani, P. F. Gangemi, A. Parigi, R. Silipo, P. Ragghianti, E. Sira- bella, M. Morelli, L. Bagnoli, R. Vergassola, and G. Zaccara, “Human heart rate variability and sleep stages,” The Italian Journal of Neuro- logical Sciences, vol. 17, pp. 437-439, 1996.
[18] M. H. Bonnet, and D. L. Arand, “Heart rate variability: sleep stage, time of night, and arousal influences,” Electroencephalography and Clinical Neurophysiology, vol. 102, pp. 390-396, 1997.
[19] G. Calcagnini, G. Biancalana, F. Giubilei, S. Strano, and S. Cerutti,
“Spectral analusis of heart rate variability signal during sleep stag- es,” Proceedings of the 16th Annual International Conference of the IEEE Engineering in Medicine and Biology Society, vol. 2, pp. 1252-
1253, Baltimore, MD, Nov. 3-6, 1994.
[20] F. Jurysta, P. van de Borne, P. F. Migeotte, M. Dumont, J. P. Lanquart, J. P. Degaute, and P. Linkowski, “A study of the dynamic interac- tions between sleep EEG and heart rate variability in healthy young men,” Clinical Neurophysiology, vol. 114, pp. 2146-2155, 2003.
[21] E. Vanoli, P. B. Adamson, B. Lin, G. D. Pinna, R. Lazzara, and W. C.
Orr, “Heart Rate Variability During Specific Sleep Stages - A Com- parison of Healthy Subjects With Patients After Myocardial Infarc- tion,” Circulation, vol. 91, pp. 1918-1922, 1995.
[22] M. Tsunoda, T. Endo, S. Hashimoto, S. Honma, and K. I. Honma, “Effects of light and sleep stages on heart rate variability in humans,” Psychiatry and Clinical Neurosciences, vol. 55, pp. 285-286, 2001.
[23] S. Milosevic, “Driver’s fatigue studies,” Ergonomics, vol. 40, pp. 381-
389, 1997.
[24] N. Egelund, “Spectral analysis of heart rate variability as an indica- tion of driver fatigue,” Ergonomics, vol. 25, pp. 663-672, 1982.
[25] K, Jiao, Z. Y. Li, M. Cheng, and C. T. Wang, “Power spectral analysis of heart rate variability of driver fatigue,” Journal of Dong Hua Uni- versity, vol. 22, pp. 11-15, 2005.
[26] Y. Lin, H. Leng, G. Yang, and H. Cai, “An Intelligent Noninvasive Sensor for Driver Pulse Wave Measurement,” IEEE Sensors Journal, vol. 7, pp. 790-799, 2007.
[27] NCSDR/NHTSA Expert Panel on Driver Fatigue and Sleepiness,
Drowsy driving and Automobile crashes, DOT Report HS-808-707,
NHTSA, Washington, D.C., 1998.
[28] Xun Yu “Integrated Approach for Nonintrusive Detection of Driver Drowsiness” Northland Advanced Transportation Systems Research Laboratories University of Minnesota Duluth October 2012
[29] J. Gonzales-Sanchez, M. E. Chavez-Echeagaray, R. Atkinson, & W.
Burleson, “ABE: an agent-based software architecture for a multi- modal emotion recognition framework,” WICSA 2011, pp.187-193,
2011.
[30] Emotiv Research Edition SDK v1.0.0.5-Premium, Emotiv SDK User
Manual.
[31] P. S. Iventado, R. Legaspi, M. Suarez, & M. Numao, “Predicting student emotions resulting from appraisal of ITS feedback,” Research
& Practice in Technology Enhanced Learning, vol. 6, no. 2, pp. 107,
2001.
[32] E. T. Mampusti, J. S. Ng, J. J. I. Quinto, & G. L. Teng, “Measuring academic affective states of students via brainwave signals,” KSE, pp.
226-231, 2001.
[33] C. Hondrou, & G. Caridakis, “Affective, natural interaction using EEG: sensors, application and future directions,” Proceedings of SETN’12, pp. 331-338, 2012.
IJSER © 2014 http://www.ijser.org