f(k;x,λ) = (λx)ke−λx for x, λ ≥ 0 (1)
International Journal of Scientific & Engineering Research, Volume 4, Issue 9, September-2013 202
ISSN 2229-5518
A Quantitative Performance Analysis of a 3G Wireless Cellular Network
Etebong B. Isong1 & Dr.Uduak A. Umoh2
Abstract—This paper presents a qualitative performance analysis of a 3G wireless cellular Network.Some key traffic parameters like: Erlang traffic, blocking probability and throughput of the existing system in parts of southern and northern Nigeria were quantitatively analyzed and average blocking probability computed.This is to assist mobile operators to explore an optimized way of improving the network to achieve an acceptable threshold without compromising the Quality of Service (QoS).. The analyses are done using the Matlab.
Index Terms— Average Blocking Probability, Blocking Rate, CDMA, Erlang Traffic.Throughput
—————————— ——————————
COde Division Multiple Access (CDMA) is becoming wide- ly used for mobile networks.Unlike other multiple access techniques, such as Frequency Division Multiple Access
FDMA) and Time-Division Multiple Access (TDMA), where transmissions share either frequency band or time duration, respectively, CDMA transmissions use all of the available time-frequency space. One form of CDMA called direct se- quence CDMA uses a set of unique signature sequence or spreading codes, also called chip sequences, to modulate the data bits of different MSs. With the knowledge of these spreading codes, the receiver can isolate and extract the data corresponding to each MS by the process of channel estima- tion and detection.This process spreads the bandwidth of the underlying data signal, hence CDMA is called a Spread Spec- trum Technique [1].There are currently two major CDMA standards for mobile networks: CDMA2000 (aka IS-2000) and Wideband CDMA (WCDMA). CDMA2000, used mainly in the USA, is fully compatible with its predecessor, cdmaOne (aka IS-95), is based on Third Generation Partnership Project 2 (3GPP2), and spreads spectrum across a 1.25MHz bandwidth (backward compatible to cdmaOne systems) and 3.75MHz (to achieve data transmission rates compatible to 3G require- ments) [2]. WCDMA, used mainly in Europe, is based on Third GenerationPartnership Project (3GPP) and spreads spec- trum across a 5MHz bandwidth [3]. In CDMA systems, time is divided into slots. A number of slots make up a frame.
With the introduction of high-data-rate services, network ca-
————————————————
• 2 Department of Computer Science, University of Uyo -Nigeria. E-mail:
uduakumoh@uniuyo.edu.ng
pacity has become an important performance consideration of
3G access networks [4][5]. It therefore must be considered
along with network coverage as an objective during network planning [6][7][8][9][10]. Since network capacity strongly de- pends on how balanced the actual traffic load over all cells is, dynamic load balancing routines that adjust one or more cell parameters in response to changing traffic patterns can be ap- plied after service deployment [6][11][12]. Such load balancing operations, in turn, must include coverage as an additional objective or constraint [8][9].
Traffic statistics is important for evaluating the performance of a network, ensuring QoS, design and sizing of electronic pro- cessing and switching systems, etc. Mostly used performance measures for traffic include throughput, delay and packet er- ror probability. Real traffic normally varies over many or all time scale and possesses long-range-dependence (LRD) prop- erties; as a consequence, when traffic congestion occurs, con- gestion tends to get worse for a substantial period of time. It has been observed that real traffic is usually bustier than Pois- son or Markovian traffic and as such cannot be adequately modelled by these models. As such a distribution that pos- sesses the capability of modelling the heavy-tailed characteris- tics of systems with LRD properties is required.
Traffic modelling and characterization are vital for under- standing and solving performance related problems in future wireless and wire-land IP networks [13]. The central goal of traffic modelling lies in constructing models that capture im- portant statistical properties of the underlying measured data. Developing an analytical or simulation model is however chal- lenged by the ability to obtain realistic values for the parame- ters of both workload and system abstraction. One method is to measure such parameters in an operational system. To this end, we collected and studied data measurements from a 3G
IJSER © 2013 http://www.ijser.org
International Journal of Scientific & Engineering Research, Volume 4, Issue 9, September-2013 203
ISSN 2229-5518
cellular network system operating in Nigeria.
3 RELATED TRAFFIC PARAMETERS
The various traffic parameters which are directly related to the performance analysis under consideration in this work are described below, using known mathematical models:
Poisson distribution![]()
f(k;x,λ) = (λx)ke−λx for x, λ ≥ 0 (1)
k!
Erlang distribution![]()
![]()
f(x;k,λ) = λkxk−1e−λx for x, λ ≥ 0 (2) (k−1)!
Where: λ is the arrival rate of a Poisson process, and k is the number of arrival events. The Poisson distribution tells the probability of the number of arrivals over a given amount of time x. The Erlang distribution tells the probability of the time interval over a given number of arrivals k. The difference is that, in Erlang distribution, it is assumed to have an arrival at time t=0 (which is not counted toward k) and t=x (which is counted toward k), respectively, whereas Poisson does not.
Poisson is derived using the law of rare events: Assume B(n,p) denote the binomial distribution of n Bernoulli events with “success” probability p. Assume the rate of occurrence of “suc-![]()
![]()
=λ1x0e−λx
0!![]()
Consider f(x; k − 1, λ) =λk−1xk−2e−λx , then f(x; k, λ) is defined by the convolution: (k−2)!
f(x;k,λ)=∫x 0 f(u;k−1,λ)⋅λe−λ(x−u)du
![]()
=∫x 0 λk−1uk−2e−λu ⋅ λe−λ(x−u) du
(k−2)!
= λk ∫x 0 uk−2 e−λue−λ(x−u) du
(k−2) !![]()
=λ ke−λx ∫ x 0 uk−2 du
(k−2)!![]()
=λke−λx xk−1
(k−2)! k−1![]()
![]()
=λkxk−1 e−λx
(k−1)!
The Erlang-B assumes that blocked transmissions are cleared and that the sender tries again later. The blocking probability P(block) according to the Erlang-B model is given as[14]:
C
cess” is λ, then λx=np where x is the time to finish n Bernoulli
events. Define Xn to be the number of “success” events oc-
ρ![]()
P(block ) = C!
(3)
C ρ
curred. So
lim Pr[Xn = k] = lim (n k )pk(1−p)n−k
Where;![]()
∑i =0 i!
n→∞ n→∞
=lim n! (λx)k (1−λx)n−k
n→∞ k!(n−k)! n n
![]()
=lim ( n! ) (λx)k (1−λx)n (1−λx)−k
n→∞ nk(n−k)! k! n n
![]()
![]()
=lim ( n(n−1)⋯(n−(k−1) ) (λx)k (1−λx)n (1−λx)−k
C is the number of channels
ρ is the offered load
The probability distribution function (PDF) of busy channels in any particular cell is dependent on the other cells only through the offered load, ρ. Thus, the probability of number of busy channels in cell (ni) is dependent on the distribution of other cells in the systems. Using Poisson arrivals this probabil- ity is given as:
n→∞ nk k! n n
ρ ni e
− ρi
![]()
=1⋅(λx)k ⋅e−λx⋅1
k!
![]()
P(ni ) = (4)
ni !
If all channels are busy, then;
∑ j =1 n j
= C or
=(λx)k e−λx
∑ ( ) = 1
p n
k! j =1
. Thus the system requires optimization of its
The formula for Erlang distribution is derived by induction. The case of f(x;1,λ) is trivial because this is the exponential distribution, i.e. the time for the next arrival is x.
f(x;1,λ) =λe−λx
channel allocation strategies to cope with the enormous sys- tem load at busy periods which results in heavy-tailed traffic.
IJSER © 2013 http://www.ijser.org
International Journal of Scientific & Engineering Research, Volume 4, Issue 9, September-2013 204
ISSN 2229-5518
The Uplink Throughput of user i , normalised by the system bandwidth, in a CDMA network is given as[15];
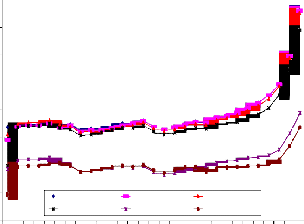
0.77 and a corresponding low throughput of 8.88, as can be
seen in Fig. 2 and Fig. 3 respectively. The reason is not uncon- nected with the densely populated nature of these areas, as more users are likely to join the network. Though the average traffic in Benue and Anambra States, Bayelsa and Cross River States, and, Delta and Ebonyi States, were 479, 414 and 334, respectively, their average blocking rate were as high as 0.76,
Ti =
Ri PL
![]()
(1 − f (γ i ))
W
(5)
0.76 and 0.72, respectively. This indicates severe network prob-
lems caused by other related factors such as faulty equipment and configuration problems, as we expected under ideal con-
Where:
Ri is the Bit Error Rate (BER) of user i
W is the System Bandwidth
PL is the Packet Length
f (γ i ) is the BER as a function of SINR of user i
dition, a reduction in the average blocking rate for these study
areas. Only Enugu and Imo States, and Kogi and Rivers States, showed normal network performance as both study areas had low average traffic (306 and 322), low average blocking rates (0.43 and 0.40) and high average throughputs (9.19 and 9.38).
The function
f (.)
however, depends on the modulation
A critical look at Fig. 2, revealed that there was a sudden rise
scheme employed.
To assess the performance of the analyzed system, we com- pute the system’s average Packet Error Probability using the equation:
in blocking rate within the last three days of the study, which
correspondingly affected the throughput performance of the
system.
Pe = 1 − (1 − P(block ))
(6)
The average blocking probability of the existing system for a period of one month is 0.297; substituting this value into equa- tion (6) with a packet length of 256 bits or 0.01325 KB, gives:
Pe = 1-(1-0.297)0.01325
= 1- 0.9953
= 0.0047
The above computation indicates the current performance of
the system. The result shows an increase in packet error prob-
ability increases, i.e., the system performance deteriorates with increase in the packet length.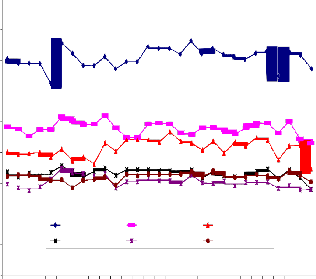
900
800
700
600
500
400
300
The existing CDMA mobile network operating in Nigeria is quantitatively analysed using the Matlab. The aim is to study some key traffic parameters and performance of the existing system in some parts of Southern and Northern Nigeria to enable mobile operators explores an optimized way of im- proving the system to achieve an acceptable threshold.
200
100
0
Abia & Akwa Ibom Benue & Anambra Bayelsa & Cross River
Delta & Ebonyi Enugu & Imo Kogi & Rivers
Study period
A quantitative analysis of the average Erlang traffic at busy/peak periods, for the study area is shown in Fig. 1. We observed from the various plots in Figure 10 that the average traffic in some parts of Southern zone of the Nigeria was high. For instance in Abia and Akwa Ibom States, the traffic was high as 708 Erlang, thus yielding the highest blocking rate of
Fig. 1: Graph of average Erlang traffic vs. Study period
IJSER © 2013 http://www.ijser.org
International Journal of Scientific & Engineering Research, Volume 4, Issue 9, September-2013 205
ISSN 2229-5518
1.6
1.4
1.2
1
0.8
0.6
0.4
0.2 | Abia & Akwa Ibom | Benue & Anambra | Bayelsa & Cross River |
Delta & Ebonyi | Enugu & Imo | Kogi & Rivers | |
0 |
Study period
Fig. 2: Graph of Average Blocking Rate vs. Study period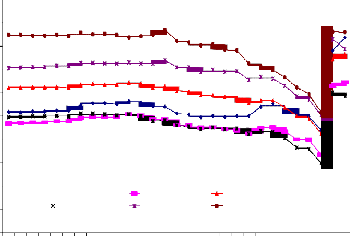
9.8
9.6
9.4
9.2
9
8.8
8.6
8.4
8.2
8
7.8
Fig. 3: Graph of average throughput vs. study period
Study period
The performance of an existing 3G cellular wireless network was quantititatively analyzed using some key traffic parame- ters like: erlang traffic, blocking rate/probability and throughput. The result has shown the effect of one parameter on the other over a period of time.
IJSER © 2013 http://www.ijser.org
International Journal of Scientific & Engineering Research, Volume 4, Issue 9, September-2013 206
ISSN 2229-5518
[1] A. Goldsmith, “Wireless Communications”. Cambridge University
Press, 2005.
[2] L. W. Couch, “Digital and Analogue Communication Systems” 4th
edition. Macmillan Publishing Company, New York, 1993.
[3] G. C. Clark, and J. B. Cain, “Error Correction Coding for Digital
Communications”, Plenum Press, New York, 1981.
[4] T. Ojenpera and R. Prasad,” WCDMA: TowardS IP Mobility and
Mobile internet,”Artech House Publishers, 2001.
[5] H. Holma and A. Toskala, “WCDMA for UTMS: Radio Access for Third Generation Mobile Communications,” John Wiley & Sons Ltd New York, 2000.
[6] S.T.S. Chia, “Design and Optimization for Cellular Access Net- work,’’Electronic and Communication Engineering Journal,’’8(6): 269-
277, 1996.
[7] S. Hurley, “Planning Effective Cellular Mobile Radio Networks,”IEEE Transactions on Vehicular Technology, 51(2): 243-253, 2002.
[8] C. Wheatley, “Trading Coverage for Capacity in Cellular Systems: A
systems Perspective,’’Microwave Journal, 38(7):62-76, 1995.
[9] V.V. Veeravalli and A. Sendonaris,’’ The Coverage-Capacity Tradeoff in Cellular CDMA systems, IEEE Transactions on Vehicular Technolo- gyVol. 48(5): 1443-1450,1999.
[10] Q. Hoa, B.H. Song, E.Gunawan, J.T.Ong, C.B. Soh and Z.Li, “A Low- Cost Cellular Mobile Communication System: A Hierarchical Opti- mization Network Resource Planning Allocation Planning Ap- proach”, IEEE Journal of Selected Areas on Communications, 15(7): 1315-
1326, 1997.
[11] C.Y. Lee, and H.G.Kang, “Cell Planning with capacity expansion in Mobile Communications: A Tabu Searchj Approach,’’ IEEE Transac- tions on Vehicular Technology,49(5): 1678-1691, 2000.
[12] S.K. Das,S.K. Sen and R. Jayaram,’’ A Dynamic Load Balancing Strat- egy for Channel Assignment using Selective Burrowing in Cellular Mobile Environment.Wireless Networks,3:333-347,1997.
[13] A. Klemm, E. Klemm, C. Lindermann and M. Lohmann,’’Modelling IP Traffic using the Batch Markovian Arrival process.Performance Evaluation, 54:149-173, 2003.
[14] S.S. Kolashi,’’ On Erlang capacity of CDMA Systems.In Mobile and Wireless Communications, Omidyar (ed.), Kluwer Academic Publishers, USA, 2003.
[15] S. Ulukus and L. J. Greenstein, (2000). Throughput Maximization in CDMA Uplinks Using Adaptive Spreading and Power Control. In Proceedings of IEEE 6th International Symposium on Spread-Spectrum Technology and Applications, 2000.
IJSER © 2013 http://www.ijser.org