equal to:
𝑔𝑙𝑁𝑒𝑤 = 0.2 . 𝑅𝑆1 . 𝑅𝑆2 + 𝜇𝑒𝑓𝑓𝑒𝑐𝑡𝑖𝑣𝑒 𝑤𝑖𝑛𝑑𝑜𝑤 … … … (7)
Where:
International Journal of Scientific & Engineering Research, Volume 4, Issue 10, October-2013 659
ISSN 2229-5518
Abstract
Text data present in images contain useful information for automatic explanation, indexing, and structuring for images. Extracting information involves detection, localization, tracking, extraction, enhancement, and recognition of the text from a given image. However variations of text due to differences in color as an example make the problem of automatic text enhancement extremely challenging in the computer vision research area especially when we deal with image's color component. A comparison between seven different filters has been executed upon colored text image by processing each image's color component individually. MSE, SNR, and PSNR for each filter's application have been analyzed to determine the success and limitations of each approach. Among the seven different filters that have been adopted and in spite of its changeable effect in luminance, one can use the New-Equalization filter that has been
suggested in this research as a good enhanced filter for such type of text.
Keywords: Color Text Information, RGB components, MSE, SNR, PSNR
Text data in an image is particularly interesting, because it can be used to easily and clearly describe the contents of an image. Since the text data can be embedded in the image in different colors, font styles, sizes, orientations, and against a complex background, the problem of enhancing the candidate text region becomes a challenging one especially when we deal with
image's color component [1].
Image is represented by an array of pixels which is displayed so that each pixel has a digital information of red (R), green (G), and blue (B) on a rectangular coordinate grid in the case of a full-color digital image [2].
Let C(x,y,t,λ) represents the spatial energy distribution of an image source of radiant energy at spatial coordinates (x,y), at time t and wavelength λ. Because light intensity is a real positive quantity, that is, because intensity is proportional to the modulus squared of the electric field, the image light function is real and nonnegative. Furthermore, in all practical imaging systems, a
small amount of background light is always present. Hence it is assumed that [3,4]
IJSER © 2013 http://www.ijser.org
International Journal of Scientific & Engineering Research, Volume 4, Issue 10, October-2013 660
ISSN 2229-5518
0 ≤ C(x,y,t,λ) ≤ A……………………..(1)
Where A is the maximum image intensity. The physical image is, of course, observable only over finite time interval. Thus, let
-T ≤ t ≤ T………………………………..(2)
The image light function C(x,y,t,λ) is, therefore, a bounded four-dimensional function with bounded independent variables. As a final restriction, it is assumed that the image function is continuous over its domain of definition. The intensity response of a standard human observer to an image light function is commonly measured in terms of the instantaneous luminance of the
light field as defined by [3,4]
∞
𝑌(𝑥, 𝑦, 𝑡) = � 𝐶 (𝑥, 𝑦, 𝑡, 𝜆)𝑉(𝜆)𝑑𝜆 … … . (3)
0
Where V(λ) represents the relative luminous efficiency function, that is, the spectral response of
human vision. Similarly, the color response of a standard observer is commonly measured in terms of a set of tristimulus values that are linearly proportional to the amounts of red, green and blue light needed to match a colored light. For an arbitrary red-green-blue coordinate system, the
instantaneous tristimulus values are [3,4].
∞
𝑅(𝑥, 𝑦, 𝑡) = � 𝐶(𝑥, 𝑦, 𝑡, 𝜆)𝑅𝑆 (𝜆)𝑑𝜆 … … (4)
0
∞
𝐺(𝑥, 𝑦, 𝑡) = � 𝐶 (𝑥, 𝑦, 𝑡, 𝜆)𝐺𝑆 (𝜆)𝑑𝜆 … … (5)
0
∞
𝐵(𝑥, 𝑦, 𝑡) = � 𝐶 (𝑥, 𝑦, 𝑡, 𝜆)𝐵𝑆 (𝜆)𝑑𝜆 … … (6)
0
Where RRSR(λ), GRSR(λ), BRSR(λ) are spectral tristimulus values for the set of red, green and blue
primaries [3,4].
In many image processing applications such as computer vision an example, color information is an important feature which has been successfully used. Color science still remains a challenging field of study in the computer vision and digital image processing community today [5]. The ink which is used in the color's text image is based upon a subtractive color process in which cyan, magenta and yellow (CMY) dyes are used. The used ink absorbs ambient white light and reflects red, green and blue light to a viewer's eye. The amount of each ink is subtractively proportional to the amount of each red, green and blue (RGB) tristimulus value [6].
Image enhancement is one of the important requirements in digital image processing which is vital in making an image useful for various applications which can be seen in the areas of Digital photography, Medicine, Geographic Information System, Industrial Inspection, Law
Enforcement and many more digital image applications [7].
The goal in image enhancement is to accentuate certain image features for subsequent analysis or for image display. Image enhancement is useful in feature extraction, image analysis and visual
IJSER © 2013 http://www.ijser.org
International Journal of Scientific & Engineering Research, Volume 4, Issue 10, October-2013 661
ISSN 2229-5518
information display. The enhancement process itself doesn't increase the inherent information display in the data. It simply emphasizes certain specified image characteristics. Enhancement algorithms are generally interactive and application dependent [8].
Image's enhanced methods can be classified into two classes of filters, the first class is the conventional (non-adaptive) filters that are independent on image model, these filters always smear the edges, and blur the texture image regions. The second class is the adaptive filters that are dependent on image model and local image statistics, so they preserve texture image regions, lines, and boundaries [9,10]. Some of the filters are implemented in the frequency domain, while
the other are performed in the spatial domain [11].
Filters that utilize the spatial domain are practically more preferable than those utilize the frequency domain, because they are easier, simpler and faster [9,10]. So, in what follows and due to the reasons mentioned above, some of the well known spatial domain filters have been
adopted with a novel one which has been suggested in this research.
The Average-Up, Average-Down, Mean (average), Median, Maximum, and Minimum filters are some examples of the non-adaptive filters. These filters are operated on the local neighborhoods in small windows and then replaced the central pixel with the largest mean, smallest mean, mean, median, maximum, and minimum value respectively in the local window. The typical sizes of each filter's window are 3x3, 5x5, 7x7 and 9x9 [10-12].
A New-Equalization filter has been suggested. This type operates also on the local neighborhoods in a small window, calculates the mean and standard deviation values of the local neighborhoods in the effective window. The central pixel would be then replaced by a new value
equal to:
𝑔𝑙𝑁𝑒𝑤 = 0.2 . 𝑅𝑆1 . 𝑅𝑆2 + 𝜇𝑒𝑓𝑓𝑒𝑐𝑡𝑖𝑣𝑒 𝑤𝑖𝑛𝑑𝑜𝑤 … … … (7)
Where:![]()
𝜇
𝜎 𝑒𝑓𝑓𝑒𝑐𝑡𝑖𝑣𝑒 𝑤𝑖𝑛𝑑𝑜𝑤 ,
𝑅𝑆2 = 𝑐𝑒𝑛𝑡𝑟𝑎𝑙 𝑝𝑖𝑥𝑒𝑙(𝑔𝑙) − 𝜇𝑖𝑚𝑎𝑔𝑒
µReffective window, imageR: mean of the local neighborhoods in the window, and total image respectively.
σReffective windowR: standard deviation of the local neighborhoods in the effective window.
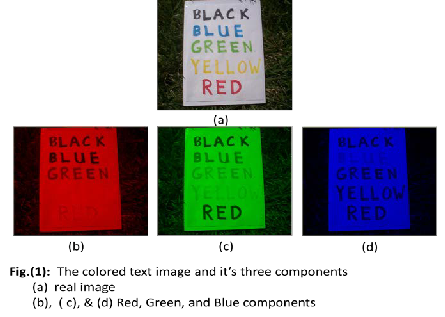
Figure (1a) represents the colored text image which is supplied by [13] that has been used in this research. Markers were used to write the names of the colors used on a white piece of paper. One can see the subtractive process that works by selectively subtracting specific portions of the incident white light. As a result, some words disappeared in images' components, this is can be
seen clearly in Figs.(1b, c, &d) respectively for red, green, and blue components.
IJSER © 2013 http://www.ijser.org
International Journal of Scientific & Engineering Research, Volume 4, Issue 10, October-2013 662
ISSN 2229-5518
Subjectively, one can notice the effective role of increasing window's block size in letters' thickness of the written words, blur effect, and word's clearness with a variable luminance caused by using Maxi/Mini/Average-Down, Mean/Average-Up, and the New-Equalization filter, respectively. On the other hand and in the case of Median filter, no role can be seen in increasing window's block size. The effect of increasing the block size can be summarized in Fig.(2) for G-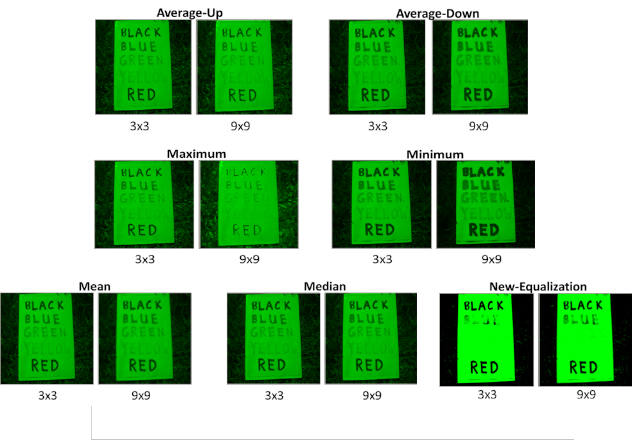
component as an example.
IJSER © 2013 http://www.ijser.org
International Journal of Scientific & Engineering Research, Volume 4, Issue 10, October-2013 663
ISSN 2229-5518
The statistical estimators in the comparison process that have been adopted here upon each component are as follow:
2
𝑀𝑒𝑎𝑛 𝑆𝑞𝑢𝑎𝑟𝑒 𝐸𝑟𝑟𝑜𝑟 (𝑀𝑆𝐸) =< �𝐼𝑖𝑚𝑎𝑔𝑒 − 𝐼𝑒𝑛ℎ𝑎𝑛𝑐𝑒𝑑 �
> … . … . (8)
𝑆𝑖𝑔𝑛𝑎𝑙 𝑡𝑜 𝑁𝑜𝑖𝑠𝑒 𝑅𝑎𝑡𝑖𝑜 (𝑆𝑁𝑅) =<
2
![]()
𝑖𝑚𝑎𝑔𝑒
(𝐼𝑖𝑚𝑎𝑔𝑒 − 𝐼𝑒𝑛ℎ𝑎𝑛𝑐𝑒𝑑 )2
> … … . . (9)
𝑃𝑒𝑎𝑘 𝑆𝑖𝑔𝑛𝑎𝑙 𝑡𝑜 𝑁𝑜𝑖𝑠𝑒 𝑅𝑎𝑡𝑖𝑜 (𝑃𝑆𝑁𝑅) = 10 .
𝑙𝑜𝑔 255 ![]()
𝑀𝑆𝐸𝑖𝑚𝑎𝑔𝑒
𝑙𝑜𝑔10
… … . . (10)
Where Iimage, enhanced represent the real and enhanced image (i.e. image's component and its enhanced one) respectively. Table (1) explains the values for the previous statistical estimators that have been applied to each component individually. Quantitatively, in the case of MSE results and due to its role in increasing image's luminance, a highest value of MSE for green component has been recorded for the New-Equalization filter followed by red, and blue components. Otherwise, convergent values for MSE obtained to other filters' application. For all filters, SNR and PSNR results have a nearly steady and symmetric behaviors.
Table (1): Results for MSE, SNR, and PSNR for each image's component
IJSER © 2013 http://www.ijser.org
International Journal of Scientific & Engineering Research, Volume 4, Issue 10, October-2013 664
ISSN 2229-5518
Figure (3) shows the relationships between the adopted statistical estimators and the degree of smoothing process (block size) for the averaged resultant component.
Ave-Up Ave-Down Maxi.
Mini. Mean Median
New-Equalization
Ave-Up Ave-Down Maxi.
Mini. Mean Median
New-Equalization
4000
3500
3000
2500
2000
1500
1000
500
0
100
80
60
40
20
0 20 40 60 80 100
Degree of Smoothing
0
0 20 40 60 80 100
Degree of Smoothing
Ave-Up Ave-Down Maxi.
Mini. Mean Median
New-Equalization
50
40
30
20
10
0
0 20 40 60 80 100
Degree of Smoothing
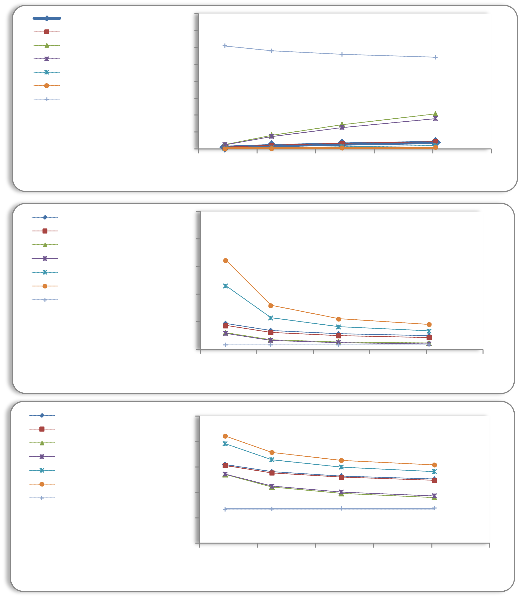
Fig.(3): MSE, SNR, & PSNR variation with degree of smoothing for all filters![]()
Increasing the degree of smoothing yields the following:
1- An increase in MSE has been occurred to all filters except for the New-Equalization filter; a decreasing state in MSE for it's corresponding curve can be seen.
2- In SNR & PSNR curves and for all filters, a decrease in their values can be seen except the case of the New-Equalization filter which witnessed a gradually increased in its values and the curve seems to be a straight line.
3- Increasing window's block size distorted the resultant image (component) in its details for all filters except for the New-Equalization filter. The last one works attractively with
a successful way in the enhancement process which is previously in Fig.(2).
IJSER © 2013 http://www.ijser.org
International Journal of Scientific & Engineering Research, Volume 4, Issue 10, October-2013 665
ISSN 2229-5518
The previous results show a various behavior in the enhancement process for each used filter. In spite of luminous changeable that occurs during its application and due to the previous considerations, one can adopt the New-Equalization filter as a good enhanced filter for each image's component of the colored text image that have been used here. The subject of this research needs more efforts and new attempts to further improve images' components in the future.
Giorgio Ronchi, Anno LXV, n. 2, 2010.
Microsystems, Inc., 1997.
135, 1981.
thesis, College of Science, University of Baghdad, 1998.
CVIPtools", Prentice-Hall, Inc., 1998.
retrospective view", http://ticsp.cs.tut.fi/images/1/1b/Cr1005-lausanne.pdf.
[13]"Infrared-CoolCosmos, Infrared colored markers", http://coolcosmos.ipac.caltech.edu/image_ galleries/markers.html.
IJSER © 2013 http://www.ijser.org