International Journal of Scientific & Engineering Research, Volume 6, Issue 1, January-2015 158
ISSN 2229-5518
Waterways finding in the province of Kirkuk- Iraq based on hydrological analysis of digital
elevation model
Ehsan S. Jaseim1, Faisel G. Mohammed2
Abstract— The digital elevation model of great importance as it contains very valuable information "can be used after extracted by special programs in this research was to find the waterways in the province of Kirkuk in Iraq through the digital elevation model. The creation of the model by downloading from the site of US Geological Survey and is relevant dimensions of 90 meters. After conducting a hydrologic analysis of the digital elevation model using the ArcGis10.2 program.
Index Terms—Digital Elevation Model (DEM), Shuttle Radar Topography Misson (STRM).
—————————— ——————————
1 SHUTTLE RADAR TOPOGRAPHY MISSION (SRTM)
t is one of the most space for land surveys carried out by the U.S. space agency (NASA) for the production of radio detec- tion ranging wavelength 56 mm launched this mission val- uable 2/11/2000 and lasted more than 11 days. Which collect- ed enough data to produce a three-dimensional database of more than 80% of the land mass and about 99.97% of the areas between latitudes 60 ° N "and 56 in the south." Download this moon aboard the space shuttle Endeavour, carrying Systems Capture Space borne Imaging Radar-C (SIR-C) as well as X- Band synthetic Aperture Radar (x-SAR) [1] that the resulting data from this radar is a kind of data, digital elevation (Digital (DEM Elevation Model that are precisely 90 meters, and these values represent the topography of the land on a continuous basis, that the error rate of vertical back to the Managing Ran- dom vertical, Which cause mediated by the contrast between trees and human infrastructure and direct change in elevation in touch oasis less than an area of a single cell. rises values that represent the highest elevations such as buildings and trees do
not represent the height of the earth's surface. [2]
In such cases getting the details of the underground struc-
ture may require extensive surveys, which can be cost-wise
and time-wise very expensive. The inventory process can take
months or even years, [3] Open source SRTM DEM is used as
an elevation data which deals with Hydrological and mor-
phometric parameters like flow direction, flow accumulation,
stream link, stream ordering, watershed boundary, slope, as-
pect and contour line. [4] SRTM obtained elevation data on a
near-global scale to generate the most complete high-
resolution digital topographic database of Earth. [5]
———————————————
• Ehsan S. Jaseim is currently pursuing master's degree program inAstron- omy in University of Baghdad, College of Science, Department of Computer Science, Department of Astronomy Science, Iraq, Baghdad, PH-
01123456789. E-mail: msc_ehsan@yahoo.com
• Faisel G. Mohammed is currently Lecturer (Assist. Prof. have PhD in
astronomy science) in University of Baghdad, College of Science, Depart- ment of Computer Science, Iraq, Baghdad, , PH-9647709644492 E-mail:
2 DIGITAL ELEVATION MODEL (DEM)
2.1 Introduction
It is a set of points from an area on the surface of the earth has been appointed its Level (X.Y) and height (Z) and every point will be defined in the vacuum of space to the values of the three axes (X.Y.Z) and these values represent the topogra- phy of the land on a continuous basis [3]
Digital elevation models help to understand the nature of the surfaces and methods of statistical representation as if it were a third dimension. [6]
A digital elevation model (DEM) is used to represent a ground surface or a terrain. The DEM can be in form of a ras- ter or a triangular irregular network. Digital elevation models (DEMs) are commonly built using remote sensing techniques like in the case of the Shuttle radar topographic mission (SRTM) digital elevation data and they can also be built from land surveying.
DEM is required in a variety of applications which include
flood or drainage modeling, land-use studies, geological ap-
plications, etc and in most cases are common basis for digital-
ly-produced relief maps that are used in geographic infor-
mation systems.
The DEM data is distributed free of charge by USGS and is
available for download from the National Map Seamless Data
Distribution System, or the USGS ftp site for easy download.
[7]
Generating DEMs from remotely sensed data can be cost
effective and efficient. A variety of sensors and methodologies
to generate such models are available and proven for mapping applications. Two primary methods if generating elevation data are:
1. Stereogrammetry techniques using airphotos (photo- grammetric), VIR imagery, or radar data (radar- grammetry)
2. Radar interferometer. [8]
Digital Elevation Models (DEMs) have become a widely
used tool and product in the last 20 years. They provide a snap
shot of the landscape and landscape features while also
faisel@scbaghdad.edu.iq
IJSER © 2015 http://www.ijser.org
International Journal of Scientific & Engineering Research, Volume 6, Issue 1, January-2015 159
ISSN 2229-5518
providing elevation values. They have allowed us to better visualize and interrogate topographic features.
A Digital Elevation Model (DEM) is generically described as a spatially geo-referenced data set that is a popular way of encoding the topography for environmental modeling pur- poses. They are also directly Compatible with remotely sensed data sources and are able to represent complex terrain units given the DEM has an adequate resolution. Computer tech- nology and digital image processing technologies have been developed and this development provides to perform these extraction processes automatically or semi-automatically. The aim of making the processes automatic is to increase the speed of collecting the data and to reduce the cost. [9]
2.2 Characteristics of Digital Elevation Models (DEM)
Digital elevation models (DEMs) provide one of the must useful digital data sets for a wide range of users. The need for global coverage with a medium scale DEM (1-3 arc second, or
30-100 m post spacings) led to the Shuttle Radar Topography
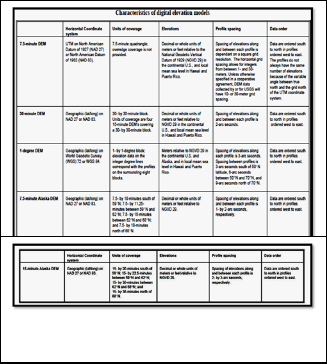
Mission [Gut,10]
Figure (1:1) show Characteristics of digital elevation model [10]
DEM has been used for topographic correction orthograph- ic correction and classification of remote sensed image. The use of high quality DEM can reduce the difficulty of remote sensed image classification, while increasing the classification accuracy [1]. High precision and fine resolution global covered DEM is therefore considered as one of the basic ancillary data for the China’s 30m global land cover mapping project [11].
2.3 Consists of DEM
(1) A two dimensional array of numbers that represents the spatial distribution of elevations on a regular grid.
(2) a set of x, y, and z coordinates for an irregular network of points (3) contour strings stored in the form of x, y coordi-
nate pairs along each contour line of specified elevation . Though there are some disadvantages
Regular grid DEMs are nowadays the most popular due to their computational efficiency. The use of DEM in this paper, therefore, refers to a regular gridded DEM.
DEMs are useful for many purposes, and are an important precondition for many applications. They are particularly use- ful in regions that are devoid of detailed topographic maps.
DEMs have been found useful in many fields of study such as geomorphometry, as these are primarily related to surface processes such as Landslides which can directly be depicted from a DEM, archaeology as subtle changes due to previous human activity in the sub surface can be inferred on Detailed DEMs, (commercial) forestry, e.g. height of trees and relation to preferred tree stem size, hydrology, like deriving drainage network and Overland flow areas that contribute to (suspend- ed) sediment loads and analysis of glaciers (movement of glac- iers using multi temporal DEM’s and glaciated terrains (change of glacier thickness by comparison of) . typically top- ics of interest to geomorphologists, DEMs that provide a good representation of the terrain, are of utmost importance as a starting point for further analysis.[12]
3 HYDROLOGICAL ANALYSIS
3.1 Introduction
Hydrological analysis of the most important analyzes that can be used in digital elevation models considered. Which specializes in water depth, trends and communicated with each other, it was in this research to take advantage of these hydrological for waterways in the study area in detail and converted format from Raster to Vector. In order to be utilized in the method of selecting the site.
3.2 Basic concepts in the Hydrological analysis
3.2.1 Flow Direction
This function computes the flow direction for a given grid. The values in the cells of the flow direction grid indicate the direction of the steepest descent from that cell [13] trends in the flow of water over the surface of the earth and this is done through the use of a digital representation of trends by using this command determines the direction of the gradient for most of each cell.
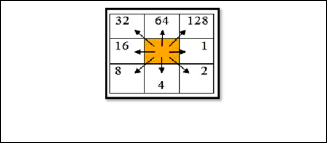
If we assume the existence of our water in the cell layer of the value of this cell is calculated according to the direction in which this water will overwhelmingly. And there went the water vertically to the top 64 to take the cell value. If moved to the right, take cell value 1. As figure (1:2)
Figure (1:2) show Flow Direction Generation [14]
IJSER © 2015 http://www.ijser.org
International Journal of Scientific & Engineering Research, Volume 6, Issue 1, January-2015 160
ISSN 2229-5518
Flow direction it determines the cell’s direction by using the deterministic (8) model to identify the flow direction of the central cell to its neighboring cells. Each cell will get a unique number based on its direction. There are eight feasible flow directions determined by unique numbers;
East = 1; Southeast = 2; South = 4; Southwest = 8; West = 16;
Northwest = 32; North =64; Northeast = 128”. [14]
3.2.2 Flow accumulation
It is quantifies how much water flows through each cell of a terrain if poured uniformly onto it (and assuming the terrain surface is impervious [15] This function computes the flow accumulation grid that contains the accumulated number of cells upstream of a cell, for each cell in the input grid [13]
The estimation of the flow accumulation is computed by tracing the waterway upstream from an outlet (or sink). When the cell with the minimum elevation in the DEM is found, all cells that drain to this cell will contribute to the flow. For an individual cell, that is:
Fout= Fin +FLocal
Where Fout denotes the flow output from the cell, Fin denotes
the flow received by the cell, and F local denotes the flow pro- duced in the cell, which is set to 1. The F out is then distribut- ed to the cell(s) which receive the flow from the centre cell according to its drainage distribution. [16]
3.2.3 Stream Order
A layer of classification lines Entry into water by grade, Where Class 1 lines Entry into water secondary and flowing lines in entry into water level 2. So this is called Category way (strahler) [14]
3.2.4 Rank River
Is an expression of the importance of a stream in a drainage network, the intensity discharge calculated by dividing the sum of the lengths of the sewer basin is an area of the pelvis, The ratio is the bifurcation rate ratios bifurcation, which is calculated by dividing the number of each rank what streams on the number of streams Rank which followed. [17]
The hydrological analyses are performed using a digital el- evation model (DEM). In GIS a DEM is defined as a raster- or a vector map with elevation data. In most geomorphologic analyses a raster map of square pixels is used. Each pixel has a number which represents elevation of the terrain in that point [15]
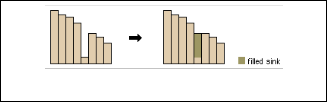
Correcting the DEM It is important that eventually sinks or pits are removed from the DEM to avoid discontinuities in the flow network. The sinks could be caused by errors in the sam- pling points, during the generation of the DEM (false sinks), or it could be naturally sinks in the terrain (true sinks). In rela- tively steep terrain greater sinks than one meter could be as- sumed as false Sinks in the DEMs used in this article have been removed by the sink filling method. This method aim that the height level in the sinks gradually is raised until the level of the lowest out flow is reached [15] as in figure (1:3)
Figure (1:3) the filling method [15]
3.2.5 Steps of The hydrological analyses
Contain hydrological analyses on many basic steps. In this search will be use four toll:-
• Fill
• Flow Direction
• Flow accumulation
• Stream order
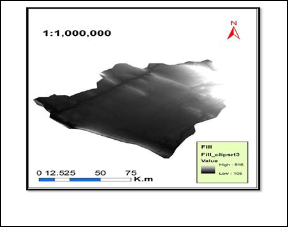
3.2.6 Fill stricture
Map (1:1) after use Fill toll
Note that there is a clear change in the form of a digi- tal elevation model (DEM) after using this tool because the tool filling and as has already been clarified; fill in the blanks digital elevation model
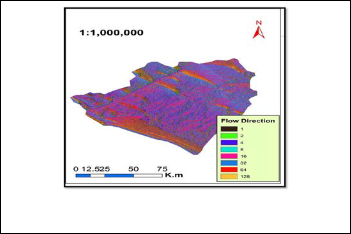
Map (1:2) The complete process of Flow Direction.
Note that the division of the direction of flow (1 to 128) for the first three zones (black, green, blue) represents the highest proportion of the flow of water. The last three areas (light blue, red, and yellow) represent the flow rate at least
IJSER © 2015 http://www.ijser.org
International Journal of Scientific & Engineering Research, Volume 6, Issue 1, January-2015 161
ISSN 2229-5518
3.2.7 Flow accumulation
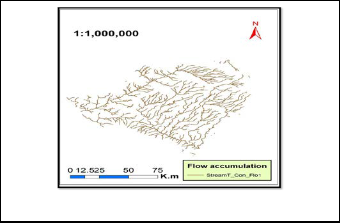
Map (1:3) show after use of Flow accumulation
In this step was to extract all waterways in the digital ele- vation model. And note that it owns the course of the show, and one which will be the distinction between sub-sewer main and using the tool stream order
3.2.8 Stream Order
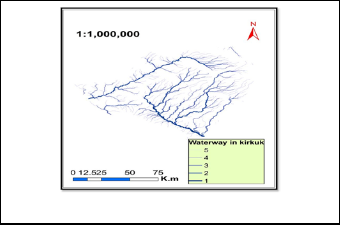
Map (1:4) Shows order waterway in Kirkuk
Note that he was waterways classified in Kirkuk and extract- ed from the digital elevation model to five degrees (five degrees was chosen by the researcher Ray) which represents NO. (1, 2) more waterways offer. "In fact, the number (1) is the great river. While NO. (2) represents a small river of (Daquq) and (Zab) River It can re-map view and replace sewer degrees of numbers to
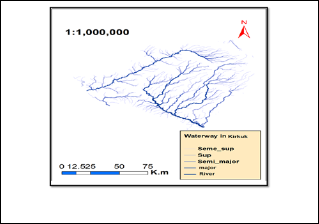
names to further clarify the map. As in Figure (1:5)
Some important conclusions are summarized in the following few point:
1. The old adage “ better information leads to better decision “ is as true for GIS as it is for other information systems. A GIS, however, is not an automated decision making system but a tool to query, analyze, and map data in support of the decision making process. GIS technology has been used to assist in tasks such as presenting information at planning inquiries.
2. Was to provide a systematic approach to conducting re- search using geographic information systems and choose the site for the establishment of an airport in Iraq as a case study. Can be used geographic information system in two ways. First, to enter, store, organize and analyze the avail- able data. Second, analysis, visualization and query geo- spatial information systems capabilities can be used in the selection of sites required prior to a set of criteria.
3. This study has shown that the GIS, can be a powerful tool in planning and managing a research work involving spa- tial data analysis, particularly in site suitability studies.
4. As for the science of remote sensing, the fundamentals and concepts of this science was the basis under which the clas- sification and interpretation of Satellite imagery in a meth- od of Supervised Classification in ArcGIS
5. The GIS if properly used represent an economic value can be translated into significant economic benefits, and this is the information age, and the wisdom behind it is to ration- alize spending and reduce the time and to achieve the greatest return the material and waste material at least in the projects that will be held
6. You can remote sensing techniques that a realistic picture of the study area offers, and better visuals using the space for its vast amount of information that can be utilized for the purposes of the various studies, including the subject of this study.
7. The significant benefits derived from digital elevation model and directed by the possibility of multiple maps such as map of elevation and slope and shadow and aspect
REFERENCES
[1] Hamed Hassan Abdulla: Morphometric parameters study for the lower part of lesser zap using GIS technique , DIYALA JOURNAL FOR PURE SCIENCES, University of Baghdad, Iraq , Vol. 7, No. 2, April 2011 , pp 127 -155.
[2] Al-jaf, Ahmad Othman: Remote Sensing and GIS For Studding Some Geological Phenomena and Mineral Deposits in the Western Desert in Iraq .M.Sc. University Of Baghdad, 2008.
[3] General Organization for Technical Education and Vocational Train- ing, Saudi Arabia,2006
[4] Shweta Karsauliya: Application of Remote Sensing and GIS in Solid Waste Management- A Case Study of Surroundings of River Yamu- na, -International Journal of Environmental Engineering and Man- agement, Volume 4, Number 6, India, 2013,pp. 593-604.
[5] Attia Mahmoud Mohamed El-Tantawi : Climate change in Libya and desertification of Jifara Plain Using Geographical Information System and Remote Sensing Techniques , PhD , University in Mainz – 2005
MAP (1:5) Waterways in Kirkuk
IJSER © 2015 http://www.ijser.org
International Journal of Scientific & Engineering Research, Volume 6, Issue 1, January-2015 162
ISSN 2229-5518
[6] Aohood bint Ayed Rehaily The use of GIS in determining the most appropriate landfill sites in Madinah ALMonawarah, master theses , Umm Al Qura University, 2010
[7] Isah O. Anavberokhai: Introducing GIS and Multi-criteria analysis in road path planning process in Nigeria, Master Thesis, university of gavle , 2008.
[8] Noam Levin: Fundamentals of Remote Sensing Edited and written, International Maritime Academy, Trieste, Italy, 1st Hydrographic Data Management course, IMO, 1999.
[9] G. Toz a, , M. Erdogan : DEM (Digital Elevation Model) Production and Accuracy Modeling Of DEMS From 1:35.000 SCALE Aerial Pho- tographs , The International Archives of the Photogrammetry, Re- mote Sensing and Spatial Information Sciences. Vol. XXXVII. Part B1. Beijing 2008.
[10] Part 2 Specifications -Standards for Digital Elevation Models, Na- tional Mapping Program-Technical Instructions, U.S. Department of the Interior, U.S. Geological Survey-National Mapping Division
[11] Lei Wang, Jun Chen, Hongwei Zhang, Lijun Chen , Difference Anal- ysis of SRTM C-band DEM and ASTER GDEM for Global Land Cov- er Mapping ,National Geomatics Center of China (NGCC( Beijing, China, School of Remote Sensing and Information Engineering Wu- han University Wuhan, China
[12] Gerald Forkuor, and Ben Maathuis , Comparison of SRTM and AS- TER Derived Digital Elevation Models over Two Regions in Ghana – Implications for Hydrological and Environmental Modeling , Inter- national Water Management Institute, Faculty of Geo-Information Science and Earth Observation, University of Twente Ghana The Netherlands pp 220-240
[13] Venkatesh Merwade: Watershed and Stream Network Delineation using ArcHydro Tools, Purdue University, 2012
[14] Daniel Sheehan: From Topographic Maps to Digital Elevation Mod- els Anne Graham ,MIT Libraries, IAP, 2013
[15] Per Lars, Erik Viréhn: Water on Devious ways - A GIS Analysis Mas- ter in Geography at the Department of Geography NTNU, Trond- heim subject number GEOG 2009,
[16] Petter Pilesjö (The University of Lund, Sweden) and Qiming Zhou (The University of New South Wales Sydney, Australia), Theoretical Estimation Of Flow Accumulation From A Grid-Based Digital Eleva- tion Model,
[17] Saad Abu Ras Al-Ghamdi: The Extraction of Drainage Network Us- ing Image Processing of Digital Satellite Data. Case Study: Noman Mountains Area, Umm Al-Qura University Journal of Educational
Sciences, social and humanitarian , Vol.16 , No.2, pp 286 – 323, 2004.
IJSER © 2015 http://www.ijser.org