International Journal of Scientific & Engineering Research, Volume 4, Issue 12, December-2013 12
ISSN 2229-5518
Review Paper…………
Various Techniques for Removal of Power Line
Interference From ECG Signal
Snehal Thalkar Prof. Dhananjay Upasani
Master of Engineer Associate Professor
Dept. of Electronics & Telecommunication Dept. of Electronics & Telecommunication
SITS, Narhe, Pune SITS, Narhe, Pune
Abstract— ECG is a biomedical signal which gives electrical activity of heart. This ECG signal is corrupted by various noises like power line interference, baseline wandering, channel noise, contact noise, muscle artifacts etc. Frequency range of ECG signal is nearly same as the frequency of power line interference. ECG signal has frequency range from 0.5 Hz to 80 Hz and power line interference introduces 50 to 60 Hz frequency component in that signal which is the major cause of corruption of ECG. This paper focuses on certain techniques for denoising of such non stationary ECG signal. Least mean square (LMS) algorithm effectively eliminate noise from signal but it requires reference model for analysis. So drawbacks of conventional method are overcome by wavelet transform hence wavelet transform is the best method for denoising the ECG signal.
Index Terms—ECG, FIR, IIR, PLI, EMF, FFT, STFT, DW T, IDWT
IJ————S—————— E———————R———
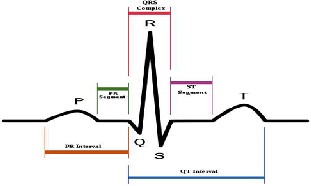
The main function of the heart is to pump blood throughout the body to deliver the oxygen and nutrient demands of the body’s tissues as well as to remove carbon dioxide. The first wave in ECG is called the P wave which is generated due to electrical activity of atria. Duration of atria should not be more than 0.11 seconds and amplitude should not be more than 3mm. The PR interval is measured from the be- ginning of the P wave to the beginning of the QRS com- plex. The normal duration for this is 0.12-0.20 seconds. The most important complex in the electrocardiogram is the QRS which shows electrical activities of ventricles The duration (QRS interval) which is measured from the beginning of the QRS complex to it's end is 0.05 to 0.10 seconds. The S-T segment follows the QRS complex. The duration of S-T segment is near about 0.08 seconds. Finally T wave represent repolarization of ventricles. The height of T wave should not be greater than 5 mm.
Fig.1 ECG Signal
This ECG signal is affected by various kind of noises like:
1. Power Line Interference:
The power line interference of 50/60 Hz is the source of interference and it corrupt the recordings of Electrocardio- gram (ECG) which are extremely important for the diagno- sis of patients. The interference is caused by:
a. Electromagnetic interference by power line
b. electromagnetic field (EMF) by the machinery which is placed nearby. The signal component holds harmonics with different amplitude and fre-
IJSER © 2013 http://www.ijser.org
International Journal of Scientific & Engineering Research, Volume 4, Issue 12, December-2013 13
ISSN 2229-5518
quency. The harmonics frequency is integral multi- ple of fundamental frequency such as 50Hz.
c. Stray effect of the alternating current fields due to loops in the cables
d. Improper grounding of ECG machine or the pa- tient.
e. Electrical equipments such as air conditioner, ele- vators and X-ray units draw heavy power line cur- rent, which induce 50 Hz signals in the input cir- cuits of the ECG machine[2].
This noise occurs at the time of muscle activity during an ECG recording especially in a stress test. This artifact consist of maximum frequency of 10 KHz
3. Data Collecting Device Noise:
This noise is mainly due to signal processing hardware
4. Patient–Electrode Motion Artifacts:
It is the movement of the electrode away from the contact area on the skin that leads to variations in the impedance between the electrode and skin causing potential variations in the ECG
5. Baseline Wandering :
Baseline wander is a low-frequency component present in the ECG system. This is due to offset voltages in the elec- trodes, respiration, and body movement. Baseline wander have frequency greater than 1Hz
6. Contact Noise:
This noise is caused by the loss of contact between the electrode and the skin, which effectively disconnects the
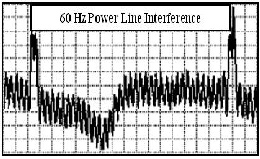
Fig.2 60 Hz Power Line Interference
The noise from electric power system is a major source of noise during the recording or monitoring of ECG. Different noises have different frequencies. The noise with low fre- quency is being problem with ECG signal as well as some time high frequency noises also interfere ECG like mobile phone. If the physical or mathematical variable changes rapidly then it can be high frequency and if it changes slowly then it would be low frequency. If the variable does not change at all then it is said that it has zero frequency. Most of the electronic devices such as ECG, transmitter, receiver, computer etc get power from power line. The 50
Hz alternative current (AC) is reduced in voltage, rectified and then filter to obtain low voltage direct current (DC). This is used to give power to those electronic devices.
2. Muscle Artifacts Known as an Electromyography
measurement system and generates large artifacts since the ECG signal is usually capacitively coupled to the system. The characteristics of this noise signal include the ampli- tude of the initial transition, the amplitude of the 60 Hz component and the constant time of the decay.
7. Electrosurgical Noise:
Electrosurgical noise is generated by other medical equip- ment present in the patient care environment at frequencies between 100 KHz and 1 MHz .This noise remains approx- imately for 1 to 10 seconds.
8. Channel Noise:
Poor channel conditions can also introduce noise to the ECG when ECG is transmitted. It is mainly like white Gaussian noise which contains all frequency components.
IJSER © 2013 http://www.ijser.org
International Journal of Scientific & Engineering Research, Volume 4, Issue 12, December-2013 14
ISSN 2229-5518
Due to these interferences the quality of ECG signal can not be ideal so it is needed to improve the quality of re- quired output of ECG signal.
2 Different Filtering Techniques Has Been Proposed For
Cancellation of Power Line Interference From ECG Signal
Many of the researchers have used digital Infinite Impulse Response (IIR) filter to remove the effects of power line interference and baseline wander from ECG signals. Be- cause, the design of IIR filter is simple. Notch filters can be used to remove the stationary power line interference. Sta- tionary means which do not vary with amplitude, frequency and phase over time but ECG signal corrupted with power line interference is non stationary in nature and we never
have exact prior knowledge of such PLI. In the absence of
4. Notch filter is incapable to filter the highly non- linear signals in the entire ECG range[1].
The digital filters are divided into two basic types, Finite Impulse Response (FIR) and Infinite Impulse Response (IIR) filters. which are known as non recursive and recur- sive filters. FIR filter was chosen since it is simple and sta- ble. The choice between the filter type (recursive and non recursive) is done due to the computational property and the storage required for the implementation.
The simplest method of FIR filter design is called the win- dow method. A window is an array w[n] consisting of coeffi- cients that meet proposed filter requirements. The design of the FIR filter using the window method requires specify-
ing which window functions is used. All frequencies below
IJSER
prior knowledge about power line interference (PLI) noise,
application of notch or other conventional filters cause dis- tortion of the ECG frequency spectrum [1]. For a second order notch filter, the bandwidth (Δf), notch frequency (fo) and quality factor (referred as Q factor) are related by ,
Q = fo /∆f (1) for a fixed notch frequency, if Q is decreased, the band- width will increase and vice versa. The Q factor is de- creased in order to increase attenuation level. If a notch filter has higher attenuation level, it will be able to remove PLI noise to a greater extent from ECG signal. The IIR notch filter practically fails to eliminate the line interference at frequencies other than 50 Hz,
Major drawbacks of IIR notch filter are:
1. With increase in attenuation level the PLI noise will removes effectively but It causes increase in notch filter bandwidth which eventually disturbs the nearby spectrum. This is the major drawback of us- ing notch filter.
2. More filtering time is required
3. Memory requirement is also much more
the cutoff frequency fc are passed with unity amplitude
while all higher frequencies are blocked. By taking the in- verse Fourier Transform of this ideal frequency response, the ideal filter kernel (impulse response) is obtained.
The FIR filters are stable and having linear phase charac- teristics. FIR filters are having a transfer function of a poly- nomial in z-plane and is an all-zero filter that means the zeros in the z-plane determine the frequency response magnitude characteristic. The z transform of N-point FIR filter is given by[12]
H(z) = ![]() (2)
(2)
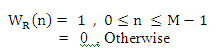
FIR filters are particularly useful for applications where ex- act linear phase response is required. The FIR filter is gen- erally implemented in a non-recursive way which guaran- tees a stable filter. FIR filter using different windows are preferred due to ease of design and simplicity of program- ming .The various windows used are[12]:
Rectangular window:
IJSER © 2013 http://www.ijser.org
International Journal of Scientific & Engineering Research, Volume 4, Issue 12, December-2013 15
ISSN 2229-5518
Hanning Window:
Hamming Window: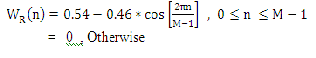
Blackman Window:
(3)
(4)
(5)
An adaptive filter is a filter that self-adjusts its transfer func- tion according to an optimization algorithm driven by an error signal. Because of the complexity of the optimization algorithms, most adaptive filters are digital filters. The adaptive filter reduces the mean squared error between primary input (ECG signal) and the reference input (noise with ECG signal). The power line interference (50Hz) from ECG signal can be removed by adaptive filtering while it’s harmonics and high frequency noise can be removed by implementing general notch rejection filters.
A non-adaptive filter has a static transfer function while Adaptive filters can be used in applications where some parameters of the desired processing operation are not known in advance. The adaptive filter uses feedback in the
form of an error signal to refine its transfer function to
IJSEmatch the chanRging parameters. A filter can be used to re-
(6)
In rectangular window based FIR filter response, it was clear that the filter has sharp attenuation and pulsation in the stop band. In the pass band, the filter was found to be stable. The hamming, hanning and the blackman windows do not have a sharp cut-off like the rectangular window. Using these windows, we can designed the high pass filter of cut-off frequency 3 Hz and the low pass filter of cut-off frequency 100Hz. The noisy signals can passed through different filters to remove noise . Rectangular window based FIR filter can give good result as compare to other window [7].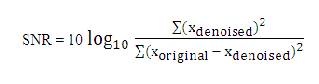
The efficiency of different windows in case of FIR filter can be analyzed by evaluating following SNR[5],
(7)
move the noise, extract information signals and separate two or more combined signals. if the a signal x(k) is pro- cessed in a discrete system the output signal will be y(k), if this output signal y(k) is different from the original signal x(k) then it must be needed to modify the system to get the required output. Then digital filter will be the solution to ma- nipulate this problem. Digital filters are extremely used in noise cancellation, echo cancellation and also in the field of biomedical engineering to remove unwanted noise from ECG.
The word adaptive means to adjust with other environment (system) by having the same response as the system itself to some phenomenon which is taking place in it’s surround- ings. Or the system which tries to adjust its parameter, de- pending upon the other system’s behavior and it’s sur- rounding. The systems which carries out its functionality after undergoes the process of adaptation is called filter. The term ‘filter’ means to take the unnecessary particles (frequency component) from its input signal and process them to generate required output under certain specific
rules. There are various principal option for the implemen-
IJSER © 2013 http://www.ijser.org
International Journal of Scientific & Engineering Research, Volume 4, Issue 12, December-2013 16
ISSN 2229-5518
tation of adaptive signal processing: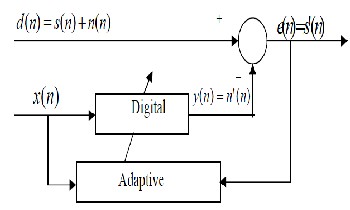
Fig.3 Adaptive Filter[16]
signal d (n) contains not only desired signal s (n) but also undesired noise signal n (n). That is measured signal is distorted by noise n (n). At that time, if undesired noise sig- nal n(n) is known, desired signal s(n) can be obtained by
The variable filter has a Finite Impulse Response (FIR) structure. For such structures the impulse response is equal to the filter coefficients. The coefficients for a filter of order P are defined as
![]() =
= ![]() (9)
(9)
The error signal or cost function is the difference between the desired and the estimated signal,
![]() (10)
(10)
The variable filter estimates the desired signal by convolv- ing the input signal with the impulse response. In vector notation this is expressed as![]()
subtracting noise signal n(n) from corrupted signal d(n). However complete information about noise source is diffi-
(11)![]()
cult to obtain, thus estimated noise signal n’ (n) is used. The estimate noise signal n’ (n) is calculated through some filters and measurable noise source X(n) which is linearly related with noise signal n(n). After that, using estimated signal n’ (n) and obtained signal d (n), estimated desired signal s’ (n) can be obtained. If estimated noise signal n’ (n) is more close to real noise signal n(n), then more desired signal is obtained. Adaptive filter is classified into two parts, adaptive algorithm and digital filter. Function of adaptive algorithm is making proper filter coefficient. General digital filters use fixed coefficients, but adaptive filter change filter coefficients in consideration of input signal, environment, and output signal characteristics. Using this continuously changed filter coefficient, estimated noise signal n’ (n) is made by filtering X (n)[16].
The input signal is a sum of desired signal d(n) and interfer- ing noise v(n)
where , X(n) =
is an input signal vector. The variable filter updates the filter coefficients at every time instant
![]() =
= ![]() + ∆
+ ∆![]() (12)
(12)
where ∆ ![]() is a correction factor for the filter coefficients. The adaptive algorithm generates this correction factor based on the input and error signals.
is a correction factor for the filter coefficients. The adaptive algorithm generates this correction factor based on the input and error signals.
Least mean squares (LMS) algorithms are a class of adap- tive filter used to mimic a desired filter by finding the filter coefficients that relate to producing the least mean squares of the error signal (difference between the desired and the actual signal). It is a stochastic gradient descent method in that the filter is only adapted based on the error at the cur- rent time.
X(n) = d(n) + v(n) (8)
IJSER © 2013 http://www.ijser.org
International Journal of Scientific & Engineering Research, Volume 4, Issue 12, December-2013 17
ISSN 2229-5518
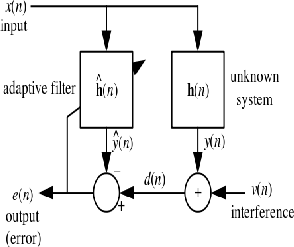
Fig.4 Least Mean Square Filter
An unknown system h(n) is to be identified and the adap- tive filter attempts to adapt the filter ![]() (n) to make it as close as possible to h(n). x(n), d(n) and e(n) are observable sig-
(n) to make it as close as possible to h(n). x(n), d(n) and e(n) are observable sig-
nals while y(n), v(n), h(n) are not directly observable.
Hence short time fourier transform come into existence to obtain the information of location of frequency in time. But again both time and frequency resolutions cannot be arbitrarily high. We cannot precisely know at what time in- stance a frequency component is located. We can only know what interval of frequencies are present in which time intervals. And in this STFT window size was fixed. wavelet analysis is superior to time domain analysis for identifying patients at increased risk of clinical deterioration. The tran- sient nature of the ECG makes it ideal for WT analysis. WT allows a powerful analysis of non stationary signals, making it ideally suited for the high resolution interrogation of the ECG over a wide range of applications. The continuous wavelet transform (CWT) is a time–frequency analysis method which differs from the more traditional short time Fourier transform (STFT) by allowing arbitrarily high locali-
zation in time of high frequency signal features.
IJSEThe CWT doRes this by having a variable window width,
Adaptive filtering methods effectively used for removing the
power line interference and other noises from ECG Signals. Advantages of adaptive filter method are:
1. faster filtering response
2. smaller residual errors.
Drawback of adaptive filter method is:
1. This method requires reference signal (either signal or noise characteristics) information for the effective filter- ing process.
In time domain analysis of ECG signal the analysis of addi- tional or hidden Information is not possible. Hence trans- form from one domain to another is required. The transform of a function may give additional or hidden information about the original function, which may not be available oth- erwise. Thus Frequency domain representation of the func- tion can be obtained by using fast fourier transform(FFT). Hence Perfect knowledge of what frequencies exists was obtained , but no information about where these frequen- cies are located in time.
which is related to the scale of observation. Wavelet trans- form (WT) is designed to give good time resolution and poor frequency resolution at high frequencies, and good frequency resolution and poor time resolution at low fre- quencies. This approach is useful for ECG signals since ECG signals are characterized by high frequency compo- nents for short durations and low frequency components for long durations. WT allows a powerful analysis of non sta- tionary signals, making it ideally suited for the high resolu- tion interrogation of the ECG over a wide range of applica- tions.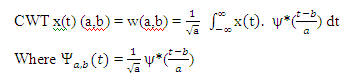
A continuous-time wavelet transform of f(t) is defined as:
(13) Here a, b belong to real number, a ≠ 0 and they are dilating and translating coefficients, respectively. The asterisk de-
IJSER © 2013 http://www.ijser.org
International Journal of Scientific & Engineering Research, Volume 4, Issue 12, December-2013 18
ISSN 2229-5518
notes a complex conjugate. This multiplication of ![]() is for the purpose of normalization of energy so that the trans- formed signal will have the same energy at every scale. The analysis function ψ(t), the so-called mother wavelet, is scaled by a, so a wavelet analysis is often called a time- scale analysis rather than a time-frequency analysis. The wavelet transform decomposes the signal into different scales with different levels of resolution by dilating a single prototype function, the mother wavelet. Furthermore, a mother wavelet has to satisfy that it has a zero net area, which suggest that the transformation kernel of the wavelet transform is a compactly support function (localized in time), thereby offering the potential to capture the non- stationary spikes which normally occur in a short period of time.
is for the purpose of normalization of energy so that the trans- formed signal will have the same energy at every scale. The analysis function ψ(t), the so-called mother wavelet, is scaled by a, so a wavelet analysis is often called a time- scale analysis rather than a time-frequency analysis. The wavelet transform decomposes the signal into different scales with different levels of resolution by dilating a single prototype function, the mother wavelet. Furthermore, a mother wavelet has to satisfy that it has a zero net area, which suggest that the transformation kernel of the wavelet transform is a compactly support function (localized in time), thereby offering the potential to capture the non- stationary spikes which normally occur in a short period of time.
with this choice of a and b, there exists the multiresolu-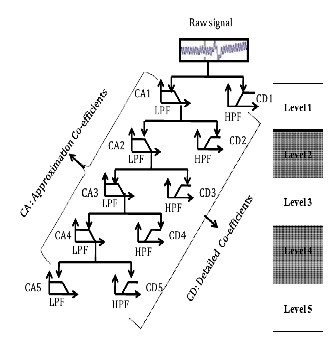
tion analysis (MRA) algorithm, which decompose a signal
domain. The choice of mother wavelet can be selected based on correlation between the signal of interest and the wavelet-denoised signal . Discrete Wavelet Transform (DWT) based wavelet denoising have incorporated using different thresholding techniques to remove power line in- terference from ECG signal. Thresholding methods are used to denoise the ECG signals.
The general wavelet denosing procedure is as follows :
2.4.1 Apply wavelet transform to the noisy signal to produce the noisy wavelet coefficients to each level.
into scales with different time and frequency resolution. MRA is designed to give good time resolution and poor fre- quency resolution at high frequencies and good frequency resolution and poor time resolution at low frequencies. The fundamental concept involved in MRA is to find the average features and the details of the signal via scalar products with scaling signals and wavelets. The wavelet decomposi- tion results in levels of approximated and detailed coeffi-
cients. The time-frequency representation of DWT is per-
formed by repeated filtering of the input signal with a pair of filters namely, low pass filter (LPF) and high pass filter (HPF), and its cutoff frequency is the middle of input signal frequency. The coefficient corresponding to the low pass filter is called as Approximation Coefficients and similarly, high pass filtered coefficients are called as Detailed Coeffi- cients. The approximation coefficient is consequently divid- ed into new approximation and detailed coefficients. This decomposition process is carried out until the required fre- quency response is achieved from the given input signal. This multi-resolution analysis enables us to analyze the signal in different frequency bands; therefore, we could ob-
serve any transient in time domain as well as in frequency
Fig.5 Filter bank structure for implementing DW T[14]
The time-frequency representation of DWT is performed by repeated filtering of the input signal with a pair of filters namely, low pass filter (LPF) and high pass filter (HPF), and its cutoff frequency is the middle of input signal frequency. The coefficient corresponding to the low pass filter is called as Approximation Coefficients (CA) and similarly, high pass fil- tered coefficients are called as Detailed Coefficients (CD) is shown in Figure. Furthermore, the CA is consequently divided into new approximation and detailed coefficients. This de- composition process is carried out until the required frequen-
cy response is achieved from the given input signal.
IJSER © 2013 http://www.ijser.org
International Journal of Scientific & Engineering Research, Volume 4, Issue 12, December-2013 19
ISSN 2229-5518
The relation between the low-pass and high-pass filter and the scalar function ψ (t) and the wavelet φ (t) can be states as fol- lowing[17]
φ (t) = ![]() (14) ψ (t) =
(14) ψ (t) = ![]() (15) The relation between the low-pass filter and high-pass filter is given as
(15) The relation between the low-pass filter and high-pass filter is given as
g[L-1- n] = ![]() (16) where g[n] is the high-pass, h[n] is the low-pass filter, L is the filter length (total number of points). Filters satisfying this condition are commonly used in signal processing, and they are known as the Quadrature Mirror Filters (QMF).
(16) where g[n] is the high-pass, h[n] is the low-pass filter, L is the filter length (total number of points). Filters satisfying this condition are commonly used in signal processing, and they are known as the Quadrature Mirror Filters (QMF).
At each level of decomposition the signal is decomposed into
low and high frequencies. Due to the decomposition process the input signal must be a multiple of ![]() where n is the num- ber of levels.
where n is the num- ber of levels.
2.4.2 Down sampling of wavelet coefficient:
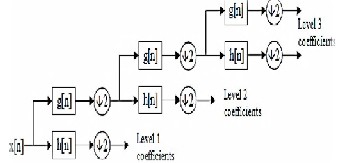
In DWT the decimation step removes every other of the coeffi- cients of the current level. Thus the computation of the wave- let transform is faster and more compact in terms of storage space and one more important thing is, the transformed signal can be perfectly reconstructed from the remaining coefficients.
Fig.7 DWT Multilevel Decomposition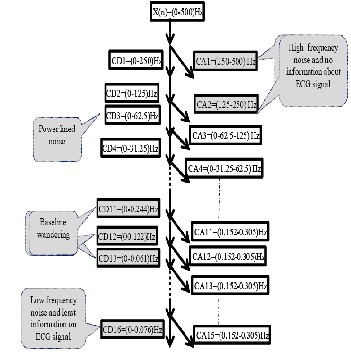
IJSEThe two filterinRg and downsampling operation can be ex-
pressed by:
![]()
![]()
[k] = (17)
![]()
![]()
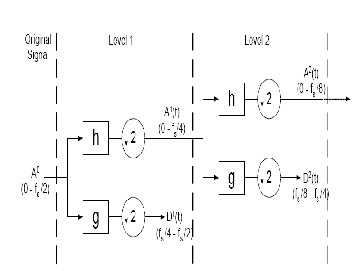
[k] = (18)
Fig.6 DW T Filter Structure W ith Relevant Noises[14]
This multi-resolution analysis enables us to analyze the signal in different frequency bands. Therefore we could observe any transient in time domain as well as in frequency domain.
Fig.8 Multiresolution Wavelet Decomposition W ith Dowmsampling By 2
Operation[17]
Select appropriate threshold method and threshold rule at each level for quantization of wavelet coeffi-
IJSER © 2013 http://www.ijser.org
International Journal of Scientific & Engineering Research, Volume 4, Issue 12, December-2013 20
ISSN 2229-5518
cients to best remove the noises. Threshold value will be selected by obtaining a minimum error between wavelet coefficient of noise signal and original signal.
2.4.3 Various threshold methods available are as fol- lows:
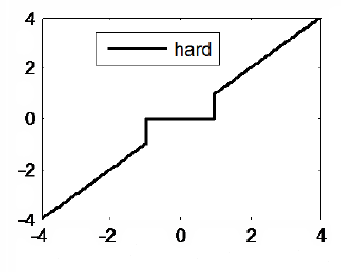
a. Hard Thresholding:
Hard thresholding method zeros the coefficients that are smaller than the threshold and leaves the other ones un- changed. Mathematically hard thresolding is given as[15],
![]()
= 0 otherwise
(19)
Fig.10 Soft Thresolding(shrinkage) Wavelet Function[15]
c. Semi Soft Thresholding:
Semi soft thresholding is a family of non-linearity that interpo-
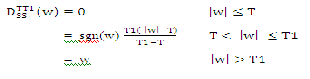
lates between soft and hard thresholding. It uses both a main threshold T and a secondary threshold T1=mu*T. When mu=1, the semi-soft thresholding performs a hard thresholding, whereas when mu=infinity, it performs a soft thresholding. Mathematically semi soft thresholding is given as[15]:
(21)
Fig.9 Hard Thresolding(Shrinkage) Wavelet Function[15]
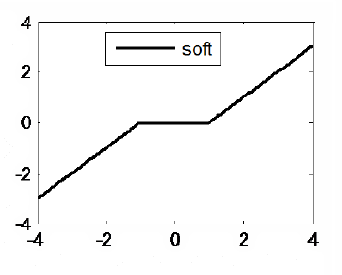
b. The Soft Thresholding:
The soft thresholding method zeros the coefficient that are smaller than threshold and scales the remaining coefficients in order to form a continuous distribution of the coefficients cen- tered on zero. Mathematically soft thresolding is given as[15]:
![]() (20)
(20)
IJSER © 2013 http://www.ijser.org
International Journal of Scientific & Engineering Research, Volume 4, Issue 12, December-2013 21
ISSN 2229-5518
where n is the total number of wavelet coefficients This meth- od yields the minmax performance is multiplied by the log value of the length of the wavelet coefficients.
b. Rigerous SURE Thresholding (![]() ): Steins unbiased risk estimator (SURE) or rigrsure is an adaptive thresholding method which is based on Stein’s unbiased likelihood estima- tion principle. This method computes is likelihood estimation first using the given threshold t, and then minimize the non-
): Steins unbiased risk estimator (SURE) or rigrsure is an adaptive thresholding method which is based on Stein’s unbiased likelihood estima- tion principle. This method computes is likelihood estimation first using the given threshold t, and then minimize the non-
likehood t, so the threshold has been obtained[2].
Fig.11 Semi Soft Thresolding(Shrinkage) Wavelet Function[15]
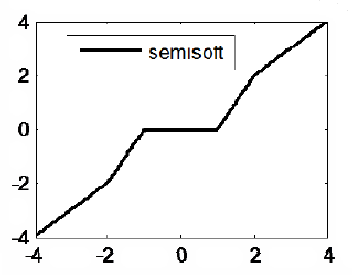
d. Stein Thresholding:
One more way to achieve a trade-off between hard and soft
c. Heuristic SURE Thresholding (![]() ): Hensure threshold is a combination of SURE and global thresholding method. If the signal-to noise ratio of the signal is very small, then the SURE method estimation will have more amounts of
): Hensure threshold is a combination of SURE and global thresholding method. If the signal-to noise ratio of the signal is very small, then the SURE method estimation will have more amounts of
noises. In this type of situation, the fixed form threshold is
IJSER
thresholding is to use a soft-squared thresholding non-
linearity, this thresholding is also called as Stein estimator[15].
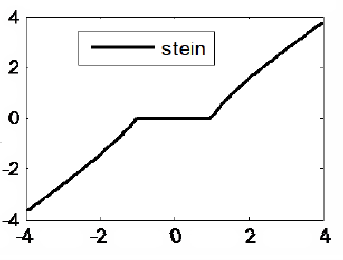
Fig.12 Stein Thresolding(Shrinkage) Wavelet Function[15]
2.4.4 Various thresholding rules are as follows:
a. Global Thresholding (![]() ): This is a fixed thresh- old or global thresholding method and it is computed as[2]:
): This is a fixed thresh- old or global thresholding method and it is computed as[2]:
![]()
(22)
selected by means of global thresholding method. Minimax
threshold is also used fixed threshold and it yields minmax performance for Mean Square Error (MSE) against an ideal procedures. In Hensure method the threshold value will be selected by obtaining a minimum error between wavelet coefficient of noise signal and original signal[2].
d. MINMAX Thresholding: It uses a fixed threshold chosen to yield minimax performance for mean square error against an ideal procedure. The minimax principle is used in statistics in order to design estimators. Since the de- noised signal can be assimilated to the estimator of the unknown regression function, the minimax estimator is the one that realizes the minimum of the maximum mean square error obtained for the worst function in a given set[2].
2.4.5 Inverse wavelet transform of the thresholded wavelet coefficients to obtain a denoised signal. The denoised sig- nals reconstructed without affecting any features of signal of interest. More level of decomposition has to carried out in order to remove low frequency noise from signal. For
IJSER © 2013 http://www.ijser.org
International Journal of Scientific & Engineering Research, Volume 4, Issue 12, December-2013 22
ISSN 2229-5518
each level of decomposition threshold value has to calcu- late by applying threshold selection rule and the wavelet coefficient above the value of threshold has been removed (soft thresholding).The selection of hard and soft threshold- ing depends on application.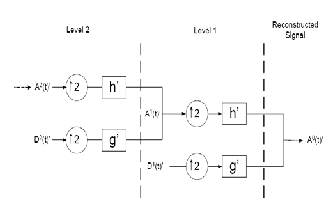
Fig.13 Multiresolution Wavelet Reconstruction Up Sampling by 2[17]
quire any reference model and accuracy is also much bet- ter.
REFERENCES
[1] Maryam Butt, Nauman Razzaq, Ismail Sadiq, Muhammad Salman, Tahir Zaidi.“Power Line Interference Removal from ECG Signal us- ing SSRLS Algorithm”, IEEE 9th International Colloquium on Signal Processing and its Applications, 8 - 10 Mac., 2013.
[2] Girisha Garg, Shorya Gupta, Vijander Singh, J.R.P. Gupta,” Identifica- tion ofOptimal Wavelet-Based Algorithm for Removal of Power Line Interferences in ECG Signals.
[3] Mohammad Zia Ur Rahman, Rafi Ahamed Shaik, D V Rama Koti
Reddy,“Baseline wander and Power line interference elimination from Cardiac Signals using Error Nonlinearity LMS Algorithm.”,
978-1-61284-038-3/10, 2010.
[4] H.N Bharath, K.M.M Prabhu,” A New LMS based Adaptive Interfer-
ence Canceller for ECG Power Line Removal”, International Confer-
IJSER
wavelet coefficient corresponding to frequency range of 50
to 60 HZ has to remove as it corresponds to power line in- terference. After applying threshold on each level of the original signal, the effects of noises on the ECG signals will get remove. Finally, we have to reconstruct the signal on each level by using Inverse Discrete Wavelet Transform (IDWT) to obtain noise free ECG signal.
Finite impulse response consist of limited number of im- pulses hence number of computation elements are also less hence this method is flexible and cost effective but these types of filters are generally realized non recursively or non adaptive which means that there is no feedback in- volved in computation of the output data. The output of the filter depends only on the present inputs. So as compare to least mean square and wavelet transform, FIR filter using various windows has less efficiency to remove 50 Hz pow- er line interference from ECG signal. Thus we can say that among all the methods discussed above wavelet transform
is the best method for denoising of ECG as it does not re-
ence on Biomedical Engineering (ICoBE), February 2012.
[5] Ms. Geeta Kadam, Prof.P.C.Bhaskar,” Reduction of Power Line Inter- ference inECG Signal Using FIR Filter”, International Journal Of Computational Engineering Research / ISSN: 2250–3005, March – April 2012.
[6] Mahesh S. Chavan, Ra. Agarwala and M.D. Uplane, “Design and
implementation of Digital FIR Equiripple Notch Filter on ECG Signal for removal of Power line Interference”, WSEAS Transaction on Sig- nal Processing, April 2008.
[7] Mikhled Alfaouri and Khaled Daqrouq, ECG Signal Denoising By Wavelet Transform Thresholding, American Journal of Applied Sci- ences 5 (3): 276-281, ISSN 1546-9239, 2008.
[8] Suranai Poungponsri, Xiao-Hua Yu, “Electrocardiogram (ECG) Sig-
nal Modeling and Noise Reduction Using Wavelet Neural Net- works”, Proceedings of the IEEE International Conference on Auto- mation and Logistics Shenyang, China August 2009.
[9] Pradnya B. Patil, Dr. Mahesh S. Chavan, “A Wavelet Based Method
for Denoising of Biomedical Signal.” Proceedings of the International Conference on Pattern Recognition, Informatics and Medical Engi- neering , March 21-23, 2012.
[10] Mohammad Zia Ur Rahman, Rafi Ahamed Shaik, D V Rama Koti Reddy,” Baseline wander and Power line interference elimination from Cardiac Signals using Error Nonlinearity LMS Algorithm.” Pro-
ceedings of 2010 International Conference on Systems in Medicine
IJSER © 2013 http://www.ijser.org
International Journal of Scientific & Engineering Research, Volume 4, Issue 12, December-2013 23
ISSN 2229-5518
and Biology 16-18 December 2010.
[11] Brij N. Singh, Arvind K. Tiwari, “Optimal selection of wavelet basis function applied to ECG signal denoising.” Digital Signal Processing
16 (2006) 275–287
[12] Rashmi Panda, Umesh C. Pati,” Removal of Artifacts from Electro- cardiogram Using Digital Filter”,IEEE Students’ Conference on Elec- trical, Electronics and Computer Science,2012.
[13] N. M.Verulkar, P. H. Zope, S. R. Suralkar, “Filtering Techniques for Reduction of Power Line Interference in Electrocardiogram Signals.”, International Journal of Engineering Research & Technology (IJERT) Vol. 1 Issue 9, November- 2012 ISSN: 2278-0181.
[14] P. Karthikeyan, M. Murugappan, and S.Yaacob, ECG Signal De-
noising Using Wavelet Thresholding Techniques in Human Stress Assessment, International Journal on Electrical Engineering and In- formatics - Volume 4, Number 2, July 2012.
[15] V.Naga Prudhvi Raj, Dr T Venkateswarlu, ECG Signal Denoising
Using Undecimated Wavelet Transform, 978-1-4244-8679-3/11 2011
IEEE. International Journal of Computer Science and Information
Technologies, Vol. 2 (1) , 2011, 489-493.
[16] A.Bhavani Sankar, D.Kumar & K.Seethalakshmi,” Performance Study of Various Adaptive Filter Algorithms for Noise Cancellation in Res- piratory Signals”, Signal Processing : An International Journal (SPIJ), Volume (4): Issue (5).
[17] http://wavelet transform and denoising
IJSER © 2013 http://www.ijser.org