International Journal of Scientific & Engineering Research, Volume 3, Issue 10, October-2012 1
ISSN 2229-5518
Validation of Experimental Strain Measurement
Technique and Development of Force Transducer
Prof. Bipin D. Patel, A.R.Srinivas
—————————— ——————————
The main techniques of experimental stress analysis which are in use today are brittle lacquers, strain gauges, photo- elasticity & photo-elastic coatings. Strain Gauges are popularly used in engineering measurement domains. Based on the principles used in the construction the strain gauges are classi- fied into mechanical, optical, electrical and acoustical types. Of all, the electrical strain gauges have become so widely accept- ed that they now dominate the entire strain-gauge domain.
The discovery of the principle upon which the electrical re-
sistance strain gage is based was made in 1856 by Lord Kelvin, who loaded copper and iron wires in tension and noted that their resistance increased with the strain applied to the wire. He then developed a Wheatstone bridge to measure the re- sistance change through which he further established three vital facts; first that resistance of the wire changes as a func- tion of the strain, second, different materials has different sen- sitivities and three that Wheatstone bridge could be used to
measure these changes accurately. Since then, extensive u1ti.l1i-
zation of strain gages by industries and academic laborator1i.e2s throughout the world has made bonded-strain-gages moni-
tored by Wheatstone bridge as the most perfected measuring system.
Strain is the amount of deformation of a body due to an applied force. More specifically, strain (ε) is defined as the fractional change in length, as shown in the Fig. 1. Strain can be positive (tensile) or negative (compressive) and is dimen- sionless. In practice, the magnitude of measured strain is very small. Therefore, strain is often expressed as micro strain (με), which is ε x 10 -6 [1]
————————————————
Prof. Bipin D. Patel, Assistant Professor, ME Department, SPCE-Visnagar, Email: bdpatel.mech@spcevng.ac.in, phone: +91-9909468081.
A.R.Srinivas, Scienst, Space Application Center, ISRO-
![]()
Ahmedabad, Email: arsrinivasu@yahoo.com, phone: 079-26915184/89.

Fig.1 Definition of strain
Strain is the amount of deformation of a body due to an ap- plied force. More specifically, strain (ε) is defined as the frac- tional change in length, as shown in the Fig. 1. Strain can be positive (tensile) or negative (compressive) and is dimension- less. In practice, the magnitude of measured strain is very small. Therefore, strain is often expressed as micro strain (με), which is ε x 10 -6 [1]
The electrical resistance strain gauge is simply a length of wire or foil formed into the shape of a continuous grid, as shown above cemented to a non-conductive backing. The gauge is then bonded securely to the surface of the component under investigation so that any strain in the surface will be experi- enced by the gauge itself. Since the fundamental equation for the electrical resistance R of a length of wire is, R= ρL/A, It follows that any change in length, and hence sectional area, will result in a change of resistance. Thus measurement of this resistance change with suitably calibrated equipment enables a direct reading of linear strain to be obtained. This is made possible by the relationship which exists for a number of al- loys over a considerable strain range between change of re- sistance and strain which may be expressed as follows:![]()
![]()
R K L
R L
Gauge factor (GF) can be expressed as,
IJSER © 2012
The research paper published by IJSER journal is about Validation of Experimental Strain Measurement Technique and Development of Force Transducer 2
ISSN 2229-5518
![]()
![]()
R / R R / R
L / L
where, ε is the strain. The value of the gauge factor is always supplied by the manufacturer and can be checked using sim- ple calibration procedures if required. Typical values of K for most conventional gauges lie in the region of 2 to 2.2, and most modern strain-gauge instruments allow the value of K to be set accordingly, thus enabling strain values to be recorded directly [2].
ture change are minimized. Also the sensitivity of the bridge to strain is doubled by making both gauges active, although in different directions [2,4].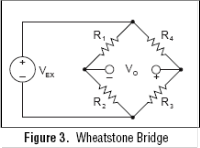
Fig.3 half bridge circuit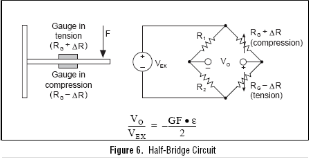
*For example, A test specimen undergoes a substantial strain of 500 με. A strain gauge with a gauge factor GF = 2 will exhib- it a change in electrical resistance of only 2* (500 ´ 10–6) =
0.1%. For a 120 W gauge, this is a change of only 0.12 W.
Fig.2 wheastone bridge circuit
The Wheatstone bridge circuit as shown in Fig. 2 for which
condition of balance for this network being (i.e. the galvanom- eter reading zero when),
R1 R3 R2 R4 .
In practice, the strain measurements rarely involve quantities
larger than a few mill strains. Therefore, to measure the strain
requires accurate measurement of very small changes in re-
sistance*. The general Wheatstone bridge, illustrated, consists of four resistive arms with an excitation voltage, Vex. The output voltage of the bridge, V0, will be,
A Cantilever beam made from aluminum alloy 6061-T6 as shown in the Fig.4 will be used for measuring bending strain with half bridge configuration. The Electrical resistance strain gauge as shown in Fig.5 is used with Vishay Micro measure- ment for Experimental measurement technique.
Vo R3
R2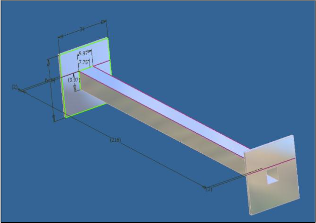
Vex![]()
R3 R4![]()
R1 R2
From this equation, it is apparent that when R1/R2 = RG1/RG2, the voltage output V0 will be zero. Under these conditions, the bridge is said to be balanced. Any change in resistance in any arm of the bridge will result in a nonzero output voltage. Therefore, if we replace R4 in Fig.2 with an active strain gauge, any changes in the strain gauge resistance will unbal- ance the bridge and produce a nonzero output voltage. If the nominal resistance of the strain gauge is designated as RG, then the strain-induced change in resistance, ΔR, can be ex- pressed as ΔR = RG × GF × ε. Assuming that R1 = R2 and R3 = RG [2,3].
Different bridge configuration are used for the assessment of strain among them a half bridge circuit is used by using two
strain gauges in the bridge, the effect of temperature can be avoided. Fig. 3 illustrates a strain gauge configuration where one gauge is active (RG + ΔR), and a second gauge is placed transverse to the applied strain. Therefore, the strain has little effect on the second gauge, called the dummy gauge. Howev- er, any changes in temperature will affect both gauges in the same way. Because the temperature changes are identical in the two gauges, the ratio of their resistance does not change, the voltage V0 does not change, and the effects of the tempera-
Fig.4. CAD Model of the beam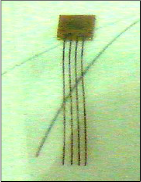
Fig.5 Electrical resistance strain gauge
IJSER © 2012
The research paper published by IJSER journal is about Validation of Experimental Strain Measurement Technique and Development of Force Transducer 3

ISSN 2229-5518
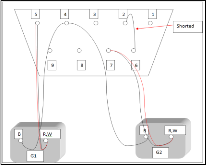
Fig.7 half bridge circuit interconnections details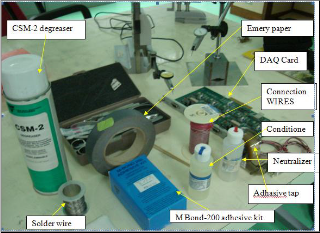
Fixing of the gage to beam involves the sequential steps like Solvent Degreasing, Surface Abrading, Gage location Layout line, Surface Conditioning, Neutralizer, Locating the Strain gauge and Applying the bond to strain gauge by using the strain gauge accessories as shown in Fig.6 [5].
Fig.6. Strain gauge accessories
Model 5100 B Scanner (Make Vishay Micro Systems) is the type of the data acquisition system used for the measurement of the strain. Model 5100 B Scanners which provide fast static acquisition & digitization of 20 channels of various analog inputs. System flexibility allows for mixing type of input card within a scanner. Strain smart is the software which is provid- ed within the data acquisition system. Fig.7 shows the details of half bridge circuit interconnection [5,6].
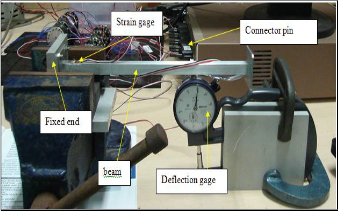
A cantilever beam as shown in Fig.8 is subjected to a point load at the end of the beam. The strain gauges are attached on its top and bottom surfaces to measure strain produced at that location. Here the load is applied in steps of 0.25398 N. the strain gauges are attached to the data acquisition system with the help of multipin connectors which in turn is connected to the PC and data is read by the software. The software will produce the output in terms of micro strain and output volt- age in the form of millivolt (mV). The data is taken for various load cases ranging from 0.25398N to 6.1 N and results are achieved.
Fig.8. Experimental setup
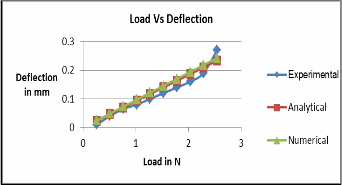
To validate experimental measured results two approaches are adopted, first classical mechanics theory is used to predict the displacements and strain, Second Finite Element Method by using the commercially available FEA software are used to compare the same. The results of these three approaches are compared and plotted in the graphs shown in figure 10.
From the pure bending theory, we have, A beam with a mo- ment of inertia I and with Young's modulus E will have a bending stress σ at a distance “y” from the Neutral Axis and the NA will bend to a radius r in accordance with the follow- ing formula.![]()
![]()
![]()
M E
I y r
By getting the value of the stress the theoretical strain can be found out by using the hook’s law formula.
IJSER © 2012
The research paper published by IJSER journal is about Validation of Experimental Strain Measurement Technique and Development of Force Transducer 4
ISSN 2229-5518
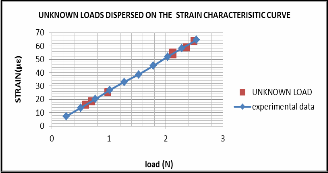
known loads are taken and loaded on the CLB. The corre- sponding strains/Voltages are plotted on the Strain V/s Load. The figure 11shows the unknown load dispersed on the strain v/s load characteristic curve [7,8].
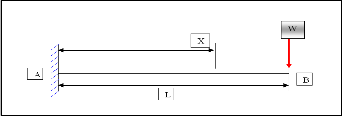
Fig.9 Cantilever beam with axial loading
As shown in Fig. 9, A cantilever beam is subjected to a point
load at free end. Let M.I of the section of the cantilever at neu- tral axis be “I”. Consider any section of the cantilever at dis- tance x from fixed end A. The bending moment at any section of the beam is given by
d 2 y
![]()
EI
dx2
w(l x)
By Simplifying this equation we get deflection at A is zero at x=0. Now, downward deflection (Y) at free end, i.e. at x=L can be determine by
Fig. 11 A plot of comparison of strain charecteristics curves for the unknown load
Wl 3
![]()
3EI
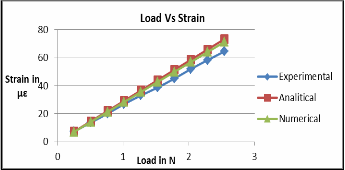
Fig. 10 A plot of comparison of strain/deflection results achieved by experimental, analytical and numerical approach
The Bending beam developed earlier is used as a force trans- ducer. From the load and deflection data generated for the cantilever beam, load characteristic curves are plotted. These loads curves are used to predict unknown loads and thereby using the CLB as a force transducer by measuring the corre- sponding strain indicated by the strain measurement setup created in the experimentation. To check the accuracies and ranges of the operation of the forced transducer some un-
An Experimented setup for the measurement of strain/stress has been successfully established using strain gauge meas- urement principle. The CLB is characterized for the plain bending using half bridge circuit and the behavior of CLB is validated using classical bending theory and FEM software. The characteristics curves for the load v/s strain, voltage are plotted for the CLB for the various loads, which results in de- velopment of force transducer. To check the behavior of the force transducer a sets of unknown load have been measured and the data have been dispend on the load characteristics curve. The fine method of dispend unknown load shows the accuracy of the load cell.
The authors are thankful to Space Application Center (SAC) for enabling them to work on the project. We deeply acknowledge the knowledge base bestowed on us by SAC official at various levels for generating the solutions proposed.
[1] Holman J.P. “Experimental Method for Engineers”, 3rd
Ed, McGraw Hill, 1978.
[2] J.W. Daly and W.F Riley, “Experimental Stress Analysis”,
1991 McGraw-Hill.
[3] Hannah, R.L et. "Strain Gage User's Handbook", USA, Esevier Science Publishers Ltd and Society of Experi-
mental Mechanics, 1992.
[4] G.S. Holister,”Experimental Stress analysis: Principles and
Methods”,1967 Cambridge University Press.
[5] www.vishayypg.com/micromesurement/instruments
[6] http://zone.ni.com/devzone/cda/tuf/p/id.
[7] http://en.wikipedia.org/wiki/Strain_gauge.
[8] Robert Lyon. “Small Mechanism Stress Analysis”, present-
ed at SESA in 1965, Spring Meeting held in Denver, Colo.,
on May 5–7.
IJSER © 2012