Inte rnatio nal Jo urnal o f Sc ie ntific & Eng inee ring Re se arc h, Vo lume 3, Issue 1, January -2012 1
ISS N 2229-5518
Utilization of Remote sensing and GIS in
Managing Disasters – A Review
C. Vijayaraghavan, Dr. D. Thirumalaivasan, Dr. R. Venkatesan
Abs tract - During the past f ive decades, natural hazards such as f loods, earthquakes, severe storms and tropical cyclones, droughts, w ild land f ires, and also manmade disasters such as Nuclear disaster, oil spills, and terrorist attacks have caused major loss of human lives and livelihoods, the destruction of economic and social infrastructure, as w ell as environmental damages. Disaster reduction is both an issue f or consideration in sustainable development agenda and a cross cutting issue relating to social, economic, environmental and humanitarian sectors. These impo rtant f eatures have to analyze and there is a need to study . Though, in recent years the Open GIS technology standards have been developed by several agencies, w hich provide the basis f or utilization of geographic inf ormation services, also gives an opportunity f or data interoperability, da ta integration and data sharing betw een different emergency management agencies, How ever f inding suitable services and visualization of geospatial inf ormatio n f or decision makers is still a crucial task. Objective of this paper is to assess the state of art literature review in diff erent methodologies of utilizing geospatial technology in managing both natural and man made disasters dedicated by diff erent authors and also to f ind new direction in this important area.
Inde x Terms : Natural disasters, Geographical Inf ormation system, man-made disasters, Nuclear disaster
1. INTRODUCTION
—————————— ——————————
it is not possible to prevent them. Nevertheless their effect
on human health and property can be mitigated effectively
A disaster is defined as a serious disruption of the
functioning of a community or a society causing widespread human, material, economic or environmental loss that exceed the ability of the affected community or society to cope using its own resources. Disasters interrupt the society by claiming lives, creating victims and destroying infrastructures and houses. Disasters also have negative impacts on the environment as they affect natural resources. Therefore, considering society, economy and environment as the three main components of sustainable development, disasters have a negative impact on sustainable development which making appropriate management of disaster a necessity.
When a disaster occurs, funds and budgets that have been assigned for development purposes are diverted to respond to that disaster and returning quality of life to normal. It is estimated that 70–80% of information is resolvable to geographic location, therefore the nature and characteristics of geographic information (GI), and the way in which it is used, is paramount in managing crises effectively. Therefore spatial data and related technologies have proven to be crucial for effective collaborative decision-making in disaster management. However, current studies show that although spatial data can facilitate disaster management, there are substantial problems with collection, access, dissemination and usage of required spatial data for disaster management. Such problems become more serious in the disaster response phase with its dynamic and time-sensitive nature.
2. N ATUR AL AN D M ANM ADE D ISASTERS
Disasters may be natural or manmade. Natural disaster like earthquake, flood, tsunami, etc will occur and
if appropriate anticipatory measures based on Geospatial technology in a timely, coordinated manner is planned and implemented in each phas e of operation like relief, rehabilitation and reconstruction. Earthquakes are caused by the motion of tectonic plates - individual sections that make up the earth's surface like panels on a football. Immense strain accumulates along fault lines where adjacent plates meet. When the rock separating the plates gives way, sudden seismic ground-shaking movements occur. The point where the seismic activity occurs is the epicenter, where the earthquake is strongest. The seismic waves usually travel out from the epicenters, sometimes creating widespread destruction as they pass. Earthquakes lead the list of natural disaster in terms of damage and human loss and they affect very large areas, causing death and destruction on a massive scale. Cyclones are the deadliest of all natural disasters worldwide associated with strong winds, storm surges, heavy precipitation and floods. The property damage caused by winds depends on quality of construction and maximum wind speed. Storm surges which are rapid increase in sea -level along the coast due to strong winds driving the water ashore cause maximum damage. When rain falls, it drains down from hillside to streams, along rivers and out into sea. When this rainfall is incessant, the land becomes saturated and the natural drainage system fails. The upper reaches of rivers quickly fill and force the excess water downstream. In the lower reaches water flows slower. Here the river swells and begins to break its banks. This results in flooding of the plains especially the low-lying flat wide areas in the lower reaches of a river.
A tsunami is a chain of fast moving waves caused
by sudden trauma in the ocean. They can be generated by earthquakes, volcanic eruption or even impact of
IJSER © 2012 http:// www.ijser.org
Inte rnatio nal Jo urnal o f Sc ie ntific & Eng inee ring Re se arc h, Vo lume 3, Issue 1, January -2012 2
ISS N 2229-5518
meteorites. Tsunamis are not tidal waves as they are not caused by changes in tides. They are most common around the edge of the Pacific, where more than half the world's volcanoes are found. These seismic surges can assault coastlines, often with little or no warning. Tsunamis are rare in the Indian Ocean. The tsunami of December 2004 started with an earthquake off the north Sumatra Coast which generated devastating tsunami waves affecting several countries in South East Asia. Landslides are frequent and annually recurring phenomenon in hilly areas. Outward and downward movement of mass, consisting or rock and soils, due to natural or man -made causes is termed as landslide. High intensity rainfall triggered most of the landslides. As long as landslides occur in remote, unpopulated regions, they are treated as just another denudation process sculpting the landscape, but when occur in populated regions; they become subjects of serious study. Most of the landslides occur due to exhaustive deforestation for the development of urbanization and plantation. In these areas rainwater directly penetrates into the soil and cause landslides.
Among the manmade disasters, probably the most
devastating (after wars) are industrial disasters. These disasters may be caused by chemical, mechanical, civil, electrical or other process failures in an industrial plant due to accident or negligence, which may cause widespread damage within and/or outside the plant. The worst example globally was the Methyl Iso-cynate gas leak in
1984 from the Union Carbide Factory in Bhopal which has so far claimed more than 20,000 lives and injured few million personals besides stunting the growth of a generation born from the affected population. This disaster triggered a completely new legal regime and practices for preventing such disasters. With increased emphasis on power generation through nuclear technology, the threat of nuclear hazards has also increased. The Department of Atomic Energy (DAE) has been identified as the nodal agency in the country in respect of manmade radiological emergencies in the public domain. Nuclear facilities in India have adopted internationally accepted guidelines for ensuring safety to the public and environment. Apart from this there is also a threat of nuclear disaster through terrorist attack in any of the major cities in India. To overcome this kind of disasters proper decision support system is essential.
3. DISASTER M AN AGEMENT USING GIS
Most of the Natural and manmade Disaster management activities can be accomplished faster by the help of Geographic Information system (GIS), a computerized data base, analyze and visualization system of spatial data. Geographic Information Systems (GIS) provide a range of techniques which allow ready access to data, and the opportunity to overlay graphical location -
based information for ease of interpretation. They can be used to solve complex planning and management problems. The disaster management consists of three important phases as Pre disaster phase (planning, preparedness and mitigation), On -Disaster phase or impact phase (response, recovery, evacuation, etc.) and post disaster phase (Rehabilitation, damage Assessment, providing food and medical facilities, etc). All phases of emergency management (reduction, readiness, response and recovery) can benefit from GIS, including applications related to disaster management systems, a critical element in managing effective lifelines in an emergency. Considering GIS as underpinning technology for spatial technologies and its role in facilitating data collection and storage as well as facilitating decision-making based on spatial data processing and analysis, GIS is a good tool for improving decision-making for disaster management.
The Geographic Information System (GIS) - based methodologies are now being developed for disaster loss estimation and risk modeling. These data can be used not only for real - time damage assessment but also for long term planning of efficient land use measure and adoption of building codes (minimum construction standards) or retrofitting methods. The easy availability of such maps, which include details of infrastructure, roads, hospital, school, shelters, engineering structure etc. simplify disaster management and rehabilitation efforts.
In this paper, we survey the literature to identify potential research directions in disaster operations, discuss relevant issues, and provide a starting point for interested researchers. From the literature review it has been concluded the most of the authors worked on the following unique three phases of disaster.
3.1. Pre-disa ster Pha se
Prevention or mitigation is not at all possible for most of the disasters. The time for warning, protective action and possible evacuation of the population may be possible just before the disaster strikes. The effectiveness of protective actions will largely depend on the level of preparedness of the population particularly at community level. The community must be prepared to understand and react to the warning. Sudden natural disasters often do not allow enough time for the implementation of protective measures. In long - term disasters or when an Early Warning System in effective, protective measure will depend on the awareness and preparedness of the community, of the local authorities and of the health staff. During this phase, several activities such as mapping of potential risks, Vulnerability analysis Inventory of existing resources were prepared using GIS.
3.2. On-di sa ster Pha se
IJSER © 2012 http:// www.ijser.org
Inte rnatio nal Jo urnal o f Sc ie ntific & Eng inee ring Re se arc h, Vo lume 3, Issue 1, January -2012 3
ISS N 2229-5518
The movement the disaster strikes is time for destruction, injury and death. It may last a few seconds , as is the case of earthquakes, or days or weeks as is the case of floods and drought. The effects of the impact on healthy vary widely according to several factors, such as the nature of the disaster itself, population density, pre-disaster health and nutritional status, climate, organization of health services, etc. Immediately after impact is the time for rescue, relief and assistance to the victim. In the immediate post-impact period, the local community is isolated and many of the most pressing rescue tasks are accomplished by the survivors themselves with the locally available resources. GIS can be effectively utilized to analyze the worst situation. Shortest route and the emergency evacuation route maps were generated using GIS to serve
the affected community.
3.3. Post-di sa ster Phase
The relief phase should lead to the Damage assessment, rehabilitation, reconstruction, rebuilding and restoring of pre-disaster conditions. Damage assessment for residential buildings and infrastructures may be done for predicting total property damage to the city. For this the latest remote sensing data collected after disaster is incorporated with GIS for generating new thematic maps. Initiatives towards rehabilitation should start immediately after the impact phase and gradually increase during the emergency and reconstruction phases. The rehabilitation measure and their effects on the long-term global development of the affected community should be carefully considered. Too often, measures decided in a hurry tend to obstruct further re-establishment of normal living conditions. However, disasters can also have positive effects in the long run and be considered as an opportunity for development. The additional resources available, the new attitudes and cohesion developed by the community and the strengthening of operational capabilities at all levels can all be used to accelerate the development process of the affected country.
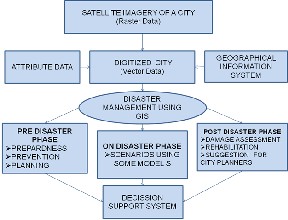
Figure-1: Flow Chart diagram for Disaster Management using GIS
4. LITER ATURE R EVIEW:
4.1. General:
In the paper published by Christopher W. Zobel, et al. [16] Disaster operations management is an increasingly important application area for the developing techniques of service science. This paper examines the use of topic maps, a semantic technology, within this environment, and provides a preliminary discussion of the benefits that its implementation can provide in the capture and exchange of contextual information.
As per Kian Fadaie , disaster response becomes more sophisticated, it is possible to en visage emergency coordination centres having their own remotely piloted vehicles (RPV) that can be launched from the roof of their building. Using existing technology, such an aircraft could be positioned using GPS and could carry a small video camera and transmitter, similar to that used by television companies for sporting events. One can envisage a computer display showing the digitized map of the disaster area with the position of the RPV superimposed. At the same time, an inset on the screen could show the video images transmitted by the RPV, giving the response coordinator first hand information from the site of the emergency. Hy Dao1, et al. have studied Evaluation of risk for four hazards (cyclones, droughts, earthquakes and floods), a statistical analysis was carried out to identify the socio-economical indicators reflecting human vulnerability to hazards. To calibrate the risk model, past casualties recorded were used. The final outputs include a set of indicators for measuring levels of risk on a country by country basis, a global database on hazard frequencies, an evaluation of the population exposed and the identification of socio-economical parameters for estimating human vulnerability to natural hazards.
IJSER © 2012 http:// www.ijser.org
Inte rnatio nal Jo urnal o f Sc ie ntific & Eng inee ring Re se arc h, Vo lume 3, Issue 1, January -2012 4
ISS N 2229-5518
4.2. Role of Geospatial Technology in Earthquake
Hazard Management:
Batuk, et al.[9]. From their study insists , Geographical Information Systems (GIS) are in a state to be used almost in every phases of a disaster management. Creating the scenarios, determining the risks, generating the sustainable plans, implementing the applications are the examples to use GIS for mitigation phase of a disaster management cycle (DMC). Urban and regional planning activities also play important roles in mitigation phases. Similar to planning process, DMC mos tly requires integrated data from multiple sources and coordinated institutional structure. Although GIS tools are able to handle different datasets for spatial analysis; integration of that data and organizing the institutes requires modern approaches or frameworks such as Spatial Data Infrastructures (SDI). Yalkun Yusuf, et al. Present a method of earthquake damage detection by comparing the optical images with panchromatic bands for the Gujarat, India earthquake, which occurred on January 8, 2001, before and after earthquake. They investigate the pre- and post- event satellite images through calculating the differences in the reflection intensity of the two images, which showed significant changes in the reflectance due to earthquake disaster. Koichiro Umemura, et al. [52] indicates that more detailed database of damaged buildings in Nishinomiya City was developed by matching two different data sets. One of them is the building damage data surveyed by Nishinomiya City Government and other one is conducted by the organization of AIJ and CPIJ and digitized by Building Research Institute (BRI). By the matching, it would be possible to utilize the detailed inventory by the former survey and the unified standard of damage assessment in the wide damaged area by the latter. This database can be used to analyze the building damage in regard to the structural type and construction period
In a research of managing earthquake, Babak Mansouri [7] focuses on the damage detection using Envisat ASAR product in conjunction with GIS applications developed for Tehran. An urban model is proposed for SAR processing that is based on the radar return from right angle reflectors with various heights and orientations considering a range of sensor-target directions variations.
4.3. Role of Geo spatial Technology in Flood Hazard
Management:
Cunjian Yang, et al. [21] Studied the method of rapidly assessing the flood disaster is discussed here by using the technologies of Remote Sensing and Geographic Information System (GIS). Satellite SAR image such as Radar sat SAR or ERS SAR is geometrically corrected and matched with the data from the GIS database such as land
use or the geometrical-corrected Landsat TM image. The flood extent can be extracted from SAR image by visual interpretation or automatic extraction with support of DEM or Landsat TM. The flood extent can be overlaid with the data such as land use data from GIS database or Landsat TM and the results such as map and table can be obtained by using GIS. Christian Herold and Dr. Frédéric Mouton [15] in a case study for utilization of GIS during flood emergencies, Estimates of peak-flow magnitude for ungauged stations were obtained by statistical means, performing several regressions on the basin variables. Peak- flow magnitude estimates enable the computation of corresponding flooded areas using Manning’s equation and GIS processing. This ―regression method‖ is processed on two test-zones situated in North and South America
4.4. Role of Geospatial Technology in Coa stal
Hazard Ma nagement:
Hemant B et al studied about the earthquake triggered near Banda Ache of Indonesia on December 26,
2004 was the fifth most strong for the last 100 years and the worst in 40 years, registering a magnitude of 9.0. The earthquake was followed by tsunami, surge of waves that killed nearly a quarter of a million people, mostly in Indonesia, Sri Lanka, and India. The earthquake shaking and subsequent tsunami caused substantial damage to structures that include buildings, harbors, overhead water tanks, seaport control towers, and so on. Other important structures, for example, dams, bridges, hangars, and so on, also suffered minor damage without disrupting their functioning. Reinforced concrete structures on the islands were the worst performers, while traditionally constructed timber and masonry structures performed well in response to ground shaking. The mandatory Indian Standards were not complied within the design of many recent structures on the islands located in the most severe seismic zone in India.
Bruno Chatenoux and Pascal Peduzzi [12], in their investigation gain a thorough understanding of factors leading to higher exposure to the tsunami is essential for improving coastal management, in order to rebuild near- shore infrastructure in a safer way. To initiate such a process, a spatial and statistical analysis was performed to identify which geophysical and biological configurations were susceptible to be associated with reduced tsunami impacts. Near-shore bathymetry (water depth), the orientation and elevation of coastlines, the distance from the earthquake epicenter and other key geomorphological parameters, presence of mangroves, coral reefs and type of fringing vegetation were all extracted using GIS
IJSER © 2012 http:// www.ijser.org
Inte rnatio nal Jo urnal o f Sc ie ntific & Eng inee ring Re se arc h, Vo lume 3, Issue 1, January -2012 5
ISS N 2229-5518
technologies and correlated with maximum length of inland impacts as recorded by remote sensing or ground surveys. Akhilesh Pal et al [2] have studied that, the Alabama Gulf Coast region is periodically subject to tropical storms and hurricanes. Normal traffic flows turn into congestion, frustration and gridlock. This reduces the number of vehicles that can leave the area if an evacuation order is issues. If a severe hurricane strikes the coast, stall traffic flow can contribute in catastrophic loss of life and damage. A study was conducted to review and evaluate existing emergency evacuation procedures for the Gulf Coast, and to make recommendations for the use of advance technologies to enhance evacuation procedures. An advisory committee of transportation and emergency management officials was involved throughout the project. The study included the examination of existing emergency evacuation plans, interviews with involved individuals and agencies, identification of technologies that can be adopted to improve planning and management of evacuations, simulation of evacuation traffic flows, and other technical steps.
4.5. Role of Geospatial Technology in Man Made
Di sa ster s Management:
Alan F. Phillips [3] from his study indicates that the Detonation of a Single Nuclear Bomb or ―Warhead‖ Would Cause a Local Disaster on a Scale That Few People in the World have seen and survived. The effect of a single bomb would depend on its power, and where it exploded – high in the air or at ground level – and whether in a densely populated and built-up area like a city or in open country like an attack on a missile silo. The nuclear bombs available to the great military powers of the world range in power from several megatons down to a few kilotons. A
―megaton‖ is the explosive power of one million tons of TNT. A ―kiloton‖ is the power of one thousand tons of TNT. Bombs likely to be available to terrorist organizations or governments other than the great military powers would be in the 10- to 100-kiloton range. Steinmeyer. K.P has studied that an atomic bomb explosion results in a great amount of damage due to blast and fire, followed by the highly radioactive fallout. At Chernobyl there was no nuclear detonation so the initial local damage was limited to the Unit 3 Reactor Building and adjacent structures. However, the amount of radioactive material released during the accident was far more than would have resulted from a nuclear explosion. The fire in the reactor core burned for approximately three weeks and a huge quantity of fallout was produced. Large areas a round the power plant had to be abandoned and contamination was spread as far as Western Europe, Africa and the Far East. Abdul Mannan [1], in his study expressed that although an act of nuclear terrorism is of very remote probability in Pakistan, nevertheless, an attempt has been made to review the pre
and post 9/11 threat of nuclear terrorism and its impact on Pakistan. A hypothetical case study has been made of sabotage on radioactive consignments during transportation within the city of Karachi and Lahore and possible consequences were assessed using Hazard Prediction and Assessment Capability (HPAC) computer code. Pakistan’s response to nuclear terrorism and the further need of improvements has been discussed. Vamanu. D et al , in their paper indicates that it was confirmed in a consensual manner by the various authorities and technical expert parties present and participating in the exercise that RODOS is indeed a viable and functional decision support system, worth implementation in the National Emergency Center, and a commitment was publicly expressed to this effect. It became apparent that the application of RODOS is a demanding endeavor in several respects, including, inter alia, the need of having the system implemented and fully operational in the Situation Room, wherever it may be, to avoid forbidding telecommunication stopgaps that may get aggravated in a real crisis.
Zakharov. A.I et al in their paper expressed that; Accident at the Chernobyl nuclear power plant (NPP) in April 1986 appeared to be one of most serious ecological catastrophes. It led to the nuclear pollution of vast surrounding territories and had severe global ecological consequences. They have also investigated on manifestation of footprints of the nuclear catastrophe on the SIR-C/X SAR images of the NPP area obtained 8 years since the accident. Coniferous forests in the area of nuclear power plant may be used as a descriptor of the level and spatial distribution of nuclear pollution using SAR data. L - band SAR data seem to be one of the most useful for the purpose of monitoring of the Chernobyl forests state. El- Harbawi et al have studied about the air pollution problem which received more attention during the last decades whereby there has been a significant increase in public awareness of the potential dangers caused by chemical pollutants and their effects on both human beings and the environment. A methodology was developed to study about the pollution. These methods include; mathematical models, simulation modelling, and simulation software. Obviously, to evaluate the impact from air pollution using complex models, the best way is by simulating the mathematical models through computer techniques. Furthermore, the integration of Geographic Information Systems (GIS) and simula tion models, combined with suitable databases and expert systems within a common and interactive Graphical User Interface (GUI) should make for more powerful and easy to use - and understand - risk information systems.
DeeleshMandloi and Rajiv Gupta [25], in their paper presents a method by which the accident-prone locations on roads, commonly termed as accident black spots, can be identified. The methodology incorporates a model which implements prioritization of roads for accident occurrence,
IJSER © 2012 http:// www.ijser.org
Inte rnatio nal Jo urnal o f Sc ie ntific & Eng inee ring Re se arc h, Vo lume 3, Issue 1, January -2012 6
ISS N 2229-5518
followed by analysis using a Geographic Information System (GIS). The GIS software used for this purpose is ARCVIEW 3.1. The various factors required for the analysis are modeled using Microsoft Visual Basic6.0 and Microsoft Visual C++6.0 software packages. A method was derived for systematically identifying neighborhoods that may face transportation difficulties during an evacuation. Thomas J. Cova and Richard L. Church have studied in their paper that a classification of this nature offers a unique approach to assessing community vulnerability in regions subject to fast-moving hazards of uncertain spatial impact (e.g., urban fire storms and toxic spills on highways). The approach is founded on an integer programming (IP) model called the critical cluster model (CCM). A heuristic algorithm is described which is capable of producing efficient, high - quality solutions to this model in a GIS context. Lu Li-zhen et al in their paper through analysis of remote sensing technology’s application in the investigation and app raisal of geological hazard, in view of the application of remote sensing interpretation about debris flow geological hazard in small basin area, presented the remote sensing interpretation method (RSVH) based on virtual GIS and hydrology spatial analysis. RSVH integrates virtual GIS, digital processing of remote sensing image and spatial analysis. Through degrades the large scale area to small spatial logic unit (SSLU), it creates three-dimension virtual scene on the SSLU using remote sensing image and high accuracy DEM data, and overlay layers that has rich attribute information such as terrain, geology, lithology, soil, hazard and so on.
5. CONCLUSION :
In this paper a general review of disaster management for both natural and manmade disasters using Geospatial technology and Geographical Information system (GIS) was presented. From this literature review it has been concluded the most of the authors worked on the unique three phases of disaster management such as Pre disaster management, on disaster management and Post disaster management. This paper also concludes that using Geo spatial technology the disaster could not be able to completely mitigate but to some extent the administrators could use this technique for planning preventive measures before disaster and to react during emergences situation. It is also appropriate to review the work so far accomplished in different fields of various disasters and to identify the necessary directions for future research.
REFERENC ES:
[1] Abdul Mannan, Preventing Nuclear Terrorism in
Pakistan: Sabotage of a Spent Fuel Cask or a
Commercial Irradiation Source in Transport, Pakistan
Nuclear Regulatory Authority, April 2007.
[2] Akhilesh Pal, Michael H. Triche, Andrew Graettinger, Karri Veerabhadra Rao, John McFadden, and Daniel S. Turner, Enhancements to Emergency Evacuation Procedures, UTCA Report 01105- August 2005
[3] Alan F. Phillips, the Effects of a Nuclear Bomb Explosion on the Inhabitants of a City, Physicians for Global Survival (Canada) June 2003
[4] Amini Hosseini. K , M. Hosseini, M.K. Jafari and S.
Hosseinioon, Recognition of Vulnerable Urban Fabrics in Earthquake Zones: A Case Study of the Tehran Metropolitan Area, JSEE / winter 2009, Vol. 10, No. 4, Available online at: http://www.iiees.ac.ir/jsee
[5] André Sabino, RuiNóbrega, Armanda Rodrigues
&NunoCorreia, Life-Saver: Flood Emergency Simulator Proceedings of the 5th International ISCRAM Conference – Washington, DC, USA, May
2008, F. Fiedrich and B. Van de Walle, eds.
[6] Ashton B. Carter, Dr. William J. Perry and Dr. Michael M. May, The Day After: Action Following a Nuclear Blast in a U.S. City, Journal Article, Washington Quarterly, Autumn 2007, volume 30, issue 4, pages 19-
32
[7] Babak Mansouri, Remote Sensing and GIS Applications for Urban Risk and Disaster Management for Tehran 4th International Workshop on Remote Sensing for Disaster Response 25-26th September 2006 Cambridge, UK Technology application and deployment for disaster management
[8] Babak Mansouri, Masanobu Shinozuka, and Reza
Nourjou, SAR Remote Sensing for Urban Damage Assessment for Tehran, 5th International Workshop on Remote Sensing Applications to Natural Hazards
10-11th September 2007 Washington DC
[9] Batuk , B. Şengezer , O. Emem Relations Between Disaster Management, Urban Planning and NSDI, The International Archives of the Photogrammetry, Remote Sensing and Spatial Information Sciences. Vol. XXXVII. Part B8. Beijing 2008
[10] Bayasgalan.B, Disaster and Environment Monitoring
using Remote Sensing data and GIS Technology in Mongolia, 10th International Research and Training Seminar on Regional Planning for Disaster Prevention, United Nations Centre for Regional Development, 12 December 1996, Nagoya, Japan
Pages 37 – 48
IJSER © 2012 http:// www.ijser.org
Inte rnatio nal Jo urnal o f Sc ie ntific & Eng inee ring Re se arc h, Vo lume 3, Issue 1, January -2012 7
ISS N 2229-5518
[11] Bikas Maity, G. Mukhopadhyay, Dam Break Study With Brahmaputra Basin Indian Cartographer, 2003, pages 212 – 219
[12] Bruno Chatenoux and Pascal Peduzzi, Analysis on the Role of Bathymetry and other Environmental Parameters in the Impacts from the 2004 Indian Ocean Tsunami, A Scientific Report for the UNEP Asian Tsunami Disaster Task Force – June 2005
[13] Casciati A F., P. Gamba, F. Giorgi, A. Marazzi, A.
Mecocci, Flexible Environment for Earthquake Rapid Damage Detection and Assessment Geoscience and Remote Sensing, 1997. IGARSS '97. Remote Sensing - A Scientific Vision for Sustainable Development., 1997
IEEE International vol.1 pages 113 - 115
[14] Charlotte F. Young, RN, PhD, and Deborah J. Persell, Biological, Chemical, and Nuclear Terrorism Readiness: Major Concerns and Preparedness of Future Nurses, Disaster Management & Response/Young and Persell, October-December 2004
Volume 2, Number 4 pages 106 – 114
[15] Christian Herold & DrFrédéric Mouton, Global Flood Modelling: Statistical Estimation of Peak-Flow Magnitude, World Bank Development Research Group & UNEP/GRID-Europe Early Warning Unit February 2006
[16] Christopher W. Zobel,G. Alan Wang, Topic Maps For Improving Services In Disaster Operations Management, Journal of Service Science – Third Quarter 2008 Volume 1, Number 1,Pages 83 - 92
[17] Chen Shi-rong, Wang Shi-xin, Zhao Qin, Lv Chang-
chun, Flood Loss Evaluation System Using Remote Sensing And GIS, Geoscience and Remote Sensing Symposium, 2003. IGARSS '03. Proceedings. 2003
IEEE International vol.4, pages, 2511 - 2513
[18] Church, Richard L. and Cova 2000 ―Mapping evacuation risk on transportation networks using a spatial optimization model,” Transportation Research Part C, 8(1-6), pages 321-336.
[19] Claudia Basta ,, Jeroen M.M. Neuvel , Sisi Zlatanova ,
Ben Ale, Risk-maps informing land-use planning processes, A survey on the Netherlands and the United Kingdom recent developments Journal of Hazardous Materials 145 (2007), Elsevier B.V, pages
241–249
[20] Cova, T. J., and Church, R.L., 1997. Modeling community evacuation vulnerability using GIS. International Journal of Geographic Information
Science 11, pages 763-784.
[21] Cunjian Yang, He Huang Yiming, Wei Hong Zhu1&JiemingZhuo, Rapidly Assessing the Flood Disaster by Using Remote Sensing and GIS, Geoscience and Remote Sensing Symposium, 2002. IGARSS '02. 2002 IEEE International vol.5, page 2880 -
2882
[22] Das, P.K. Prediction of Storm surges. Sadhana 1994 19, pages 583 - 595.
[23] David C. Thoman, Kevin M. Brotherton, and Wayne
Davis Benchmarking Upgraded HotSpot Dose Calculations against MACCS2 Results EFCOG Safety Analysis Working Group, 2009
[24] David M. TralliT, Ronald G. Blom, Victor Zlotnicki, Andrea Donnellan, Diane L. Evans, Satellite remote sensing of earthquake, volcano, flood, landslide and coastal inundation hazards, ISPRS Journal of Photogrammetry & Remote Sensing, International Society for Photogrammetry and Remote Sensing, Inc. Published by Elsevier B.V, 59 (2005), pages 185– 198

C.Vijayaragavan completed his Bachelor degree in Civil Engineering in 1994 and obtained his Master degree in Advanced construction Technology in 2000. He became a Life Member of ISTE , Member (M) of IAENG and Member of IACSIT. At Present he is doing his Doctral Program in Research Scholar, Institute of
Remote Sensing, College of Engineering, Guindy, Anna University,Chennai, India. He has published many papers in International Journals and Conferences. His Area of Interest includes
Dr. D. Thirumalaivasan is working as Associate Professor, Institute of Remote Sensing, Department of Civil Engineering, College of Engineering Gundy, Anna University, ChennaiSardar Patel road, Gundy, Chennai-
600025, India
Dr. R. Venkatesan is working as Scientist G, Radiological Safety Division, Indira Gandhi Centre for Atomic Research, Kalpakkam, Kancheepuram district, Tamilnadu, India.
IJSER © 2012 http:// www.ijser.org
International Journal of Scientific & Ergineerirg Research, Volume 3, IsstE 1, Jarruary -2012 8 lSSN 2229-5518
IJSER ©2012
rttp /lwww iJ ser erg