International Journal of Scientific & Engineering Research, Volume 4, Issue 8, August-2013 1890
ISSN 2229-5518
![]()
![]()
![]()
![]()
![]()
(4) danomartins@hotmail.com, 5adeyinkayusuff@yahoo.com
In this study, existing experimental vapour-liquid equilibrium (VLE) data covering a wide range of temperature, phase composition and pressure for ethane-n-butane-n-pentane was correlated using MATLAB (Matrix Laboratory) software. To increase the reliability of correlations, neural network was trained using existing vapour-liquid equilibrium data with the aid of Levenberg Marquardt algorithm. Network parameters are fine-tuned until the output generated by simulation are checked and observed to match with pre-determined experimental V L E data. It was found that there is high degree of coherence between the chosen targets from experimental data and predicted values. This confirms that correlations and predictions of V L E data using neural network is efficient and significant.
IJSER © 2013 http://www.ijser.org
International Journal of Scientific & Engineering Research, Volume 4, Issue 8, August-2013 1891
ISSN 2229-5518
Recently, many methods and approaches have been used to determine vapour-liquid equilibrium data for hydrocarbon binary, ternary and multi-components because of its relevance and great importance in chemical process industries, refining and petroleum industries. A few of these approaches are: graphical, analytical and statistical approaches. However, it was found that the correlation with these approaches were not so accurate as expected and in some cases it proved quite difficult to correlate unfamiliar data and operating conditions. Due to these frustrating efforts, artificial neural network (ANN) or machine learning algorithm (embedded in the MATLAB) comprising of a large number of highly interconnected processing elements (neurons) was developed for correlating vapour-liquid equilibrium data because it can reason more dynamically like the human brain, follow trend, capable of self training and can organize both enormous, familiar and unfamiliar data.
Vapour liquid equilibrium (abbreviation VLE) is a state where liquid and its vapour (gas phase) are in equilibrium: a condition or a state where the rate of evaporation (liquid becoming vapour) is equal to the rate of condensation (vapour becoming liquid), under specific conditions where no net vapour liquid inter-conversion intervenes [1]. When heat is added slowly to a closed vessel that contains liquid mixture of several components at constant pressure, the
temperature increases until a point is reached when the first bubble forms, at this point, vapour and liquid is said to be in a state of equilibrium [2]. As vapourization proceeds, the composition of the remaining liquid continually changes and hence does its vapourization temperature. A similar phenomenon occurs when a mixture of vapour is subjected to a condensation process at constant pressure, at some temperature. The first droplets of liquid form, thereafter the compositions of vapour and the condensation temperature both changes. When a liquid is heated slowly, at constant pressure, the temperature at which the first vapour bubble forms is the bubble point temperature of the liquid at a given pressure and when a gas (vapour) is cooled slowly at constant pressure, the temperature at which the first liquid droplet forms is the dew temperature [2] [3].
When two phases are in equilibrium, vapour- liquid equilibrium data is useful in relating the composition of the liquid phase to that of the vapour phase [4].
The modeling and control of equipment for different chemical processes require the vapour- liquid equilibrium data [5] [6].
The thermodynamics of ternary phase equilibrium is based on the concept of the chemical potential. The chemical potential was introduced by Gibbs while G. N. Lewis
IJSER © 2013 http://www.ijser.org
International Journal of Scientific & Engineering Research, Volume 4, Issue 8, August-2013 1892
ISSN 2229-5518
proposed the idea of the quantity called fugacity,
which has a unit pressure.
F v Φ = i yi P
(3)
Since, in a mixture of ideal gases, the fugacity of
each component is equal to its partial pressure.
The activity coefficient γ on the other hand
Physically, it is convenient to think of the
relates the liquid phase fugacity
Fi L
to the
fugacity as thermodynamic pressure, in real
liquid phase mole fraction xi
and to the
mixtures, the fugacity can be considered as a partial pressure which is corrected for non-ideal
standard state fugacity
Fi L
Fi01 as
behavior. Fugacity Fi
is related to partial![]()
γ i = 01
xi Fi
(4)
pressure of a system when the system
approaches or behaves like an ideal situation. Thus,
Combining equations 3 and 4, the equation for any component i becomes:![]()
Fi
yi P
as p-------0 (1)
Fi = Fi
01
(5); and
Pressure is low and approaches zero
Φi yi P = γ i xi Fi
(6)
yi = mole
fraction of component i in the
The relation between fugacity coefficient Φ and activity coefficient γ is may be given as
vapour phase
P = total
pressure
Φi yi P = γ i xi Pi
(7)
For two phases which are at the same temperature, the equation of equilibrium for
For non ideal gas and liquid solution
Sat Sat
each component is expressed in terms of
Φi yi P = γ i xi Pi
Φ (8)
fugacity Fi as
Fi = FL
(2)
Equation 7 reduces to
yi P = xi Pi
(9)
Thus, fugacity coefficient Φ relates the vapour phase fugacity F V to vapour phase mole fraction
yi and total pressure P by
Pi = vapour
Pp = Partial
pressure
pressure
P Sat is the saturation vapour pressure of pure
component i
IJSER © 2013 http://www.ijser.org
International Journal of Scientific & Engineering Research, Volume 4, Issue 8, August-2013 1893
ISSN 2229-5518
Φ Sat
is the fugacity coefficient at saturation of
[7], [8], [9], [10], [11], and [12], have all
reported the correlation of vapour-liquid
pure component i
but
yi P = Pp
Equation 9 becomes
Pp = xi P1
(10)
(11)
equilibrium data for binary systems while [13] have shown how NRTL equation can be used to correlate vapour-liquid equilibrium data for ternary systems. In this work, MATLAB, software with neural network conditions was used to correlate experimental vapour-liquid equilibrium data with the aid of Levenberg
Marquardt algorithm employed to train the set of
Activity coefficient is related to molar Gibb’s energy by:
data. The Levenberg Marquardt algorithm is one of the best training rules designed to approach network speed [14], cited by [8]. Neural
T ∑ i i
(12)
network is an interconnected group akin to the
n G E = RT n ln γ
i
vast network of neuron in the human brain. It is
RT ln γ
∂(nG E )
=
an information processing paradigm that is![]()
i
∂ni
T ,P ,n ≠1
(13)
inspired by the way biological system neurons such as the brain process information [15]. The
E E
ln G
1 ∂(nG )
artificial neural network is a model based on![]()
γ i =
RT
where
![]()
=
RT
![]()
∂ni
T ,P ,n ≠1
(14)
some experimental results that is proposed to predict the required data because of avoiding more experiments. [8]. In the course of data
R is the ideal gas constant and T is temperature
correlation, neural network provides a network which organizes and provides good pattern for
vapour- liquid equilibrium data.
Pressure (kPa) | Ethane vapour mole | Butane vapour mole | Pentane vapour mole | Ethane liquid mole | Butane liquid mole | Pentane liquid mole |
IJSER © 2013 http://www.ijser.org
International Journal of Scientific & Engineering Research, Volume 4, Issue 8, August-2013 1894
ISSN 2229-5518
fraction (y2 ) | fraction (y4 ) | fraction (y5 ) | fraction (x2 ) | fraction (x4 ) | fraction (x5 ) | ||
2444.3 | 0.846 | O.102 | 0.052 | 0.517 | 0.274 | 0.209 | |
2855.2 | 0.875 | 0.086 | 0.039 | 0.602 | 0.229 | 0.169 | |
3026.2 | 0.860 | 0.077 | 0.037 | 0.713 | 0.175 | 0.112 | |
3271.5 | 0.882 | 0.081 | 0.037 | 0.765 | 0.144 | 0.091 | |
3386.0 | 0.872 | 0.085 | 0.043 | 0.794 | 0.128 | 0.078 | |
2111.7 | 0.828 | 0.149 | 0.023 | 0.510 | 0.378 | 0.112 | |
2507.8 | 0.852 | 0.122 | 0.020 | 0.599 | 0.312 | 0.089 | |
2903.0 | 0.871 | 0.111 | 0.018 | 0.690 | 0.245 | 0.065 | |
3146.4 | 0.871 | 0.110 | 0.019 | 0.740 | 0.208 | 0.052 | |
3349.46 | 0.865 | 0.115 | 0.020 | 0.788 | 0.170 | 0.042 | |
2164.2 | 0.893 | 0.046 | 0.061 | 0.560 | 0.131 | 0.309 | |
2254.2 | 0.898 | 0.043 | 0.059 | 0.064 | 0.113 | 0.246 | |
2923.7 | 0.904 | 0.041 | 0.055 | 0.718 | 0.093 | 0.246 | |
3316.6 | 0.911 | 0.041 | 0.051 | 0.793 | 0.076 | 0.131 | |
3439.6 | 0.910 | 0.038 | 0.052 | 0.823 | 0.068 | 0.109 | |
3517.5 | 0.904 | 0.041 | 0.055 | 0.836 | 0.061 | 0.103 |
IJSER © 2013 http://www.ijser.org
International Journal of Scientific & Engineering Research, Volume 4, Issue 8, August-2013 1895
ISSN 2229-5518
IJSER © 2013 http://www.ijser.org
International Journal of Scientific & Engineering Research, Volume 4, Issue 8, August-2013 1896
ISSN 2229-5518
Ethane (x2 ) | Butane (x4 ) | Pentane (x5 ) | Temperat ure (K) |
0.5173 | 0.2738 | 0.2091 | 338.5500 |
0.6029 | 0.2290 | 0.1690 | 338.5550 |
0.7127 | 0.1734 | 0.1122 | 338.5551 |
0.7649 | 0.1450 | 0.0900 | 338.5551 |
0.7957 | 0.1284 | 0.0780 | 338.5549 |
0.5104 | 0.3776 | 0.1121 | 338.5550 |
0.5980 | 0.3121 | 0.0890 | 338.5552 |
0.6857 | 0.2443 | 0.0652 | 338.5551 |
0.7426 | 0.2060 | 0.0520 | 338.5550 |
0.7866 | 0.1708 | 0.0422 | 338.5550 |
0.5653 | 0.1310 | 0.3090 | 338.5551 |
0.6400 | 0.1131 | 0.2455 | 338.5500 |
0.7105 | 0.0920 | 0.2460 | 338.5500 |
0.7942 | 0.0762 | 0.1314 | 338.5500 |
0.8266 | 0.0667 | 0.1090 | 338.5550 |
0.8349 | 0.0617 | 0.1033 | 338.5549 |
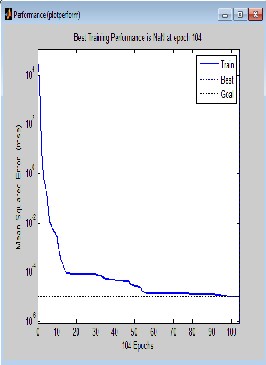
Simulation takes the network input P and the network object and returns the network output a. In this work, the simulation is repeated as a loop. In the loop, the model is run for specific time, parameter changed and model run again. This was repeated until the correlation was completed and the simulation was completed when the target was met after 104 iterative processes. This is shown in Fig. 1.0, with the trainlm line (performance goal line) touching the target line.
The small value of the mean square error (M S E) as shown in Fig. 1.0 is an indication that the developed network has efficiently trained the data and that the output (predicted values) are not far from the target. Comparing table 2.0 and
3.0, the output (predicted values) of liquid phase compositions and temperature gives set of data that is close to the target (experimental liquid phase compositions and temperature data).
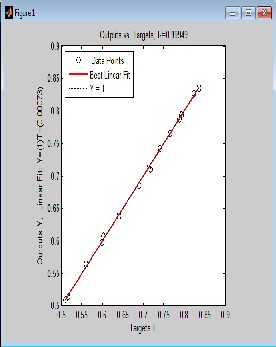
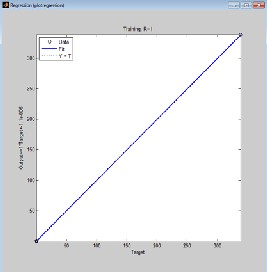
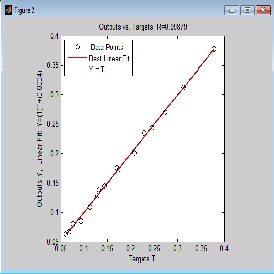
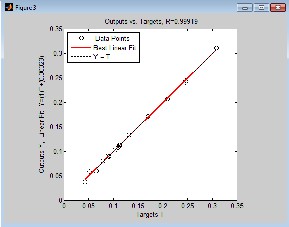
From Fig. 2.0, 3.0, 4.0 and 5.0 (regression and output-target) graphs, deviations of data points from the line of best fit is negligible which indicates that there is high degree of correlation between predicted values and experimental data. Correlation coefficient R will be significant when the indices given by [i, j] in the P matrix is less or equal to 0.05. Correlation coefficient R in Fig. 2.0 (Regression graph) is 1, which means there is 100% correlation between the predicted and experimental vapour-liquid equilibrium data: an indication that the developed neural network is highly efficient. The value of R in Fig. 3.0, 4.0 and 5.0 is given as 0.99949,
0.99879 and 0.99919 respectively meaning that there is 99.949%, 99.879% and 99.919% correlation between output and the set target for ethane-butane-pentane ternary system. It also confirms that there is good correlation between the input, target and output parameter.
From the experimental data, the values of pressure and vapour phase composition of the ternary system were given as input to the network while the target was taken to be the
IJSER © 2013 http://www.ijser.org
International Journal of Scientific & Engineering Research, Volume 4, Issue 8, August-2013 1897
ISSN 2229-5518
respective temperatures and liquid phase composition.
Comparing table 2.0 and 3.0, the output (predicted values) of liquid phase compositions and temperature gives set of data that is close to the target (experimental liquid phase compositions and temperature data).
Vapour mole fraction of ethane, butane and pentane picked at random at a particular pressure, [0.865; 0.115; 0.020; 3349.46], were given as input to the trained network which predicted its equivalent composition of the liquid phase and temperature as [0.7881; 0.1699;
0.0420; 3380.55]. These values agree with the experimental data.
Neural network was successfully used to correlate vapour-liquid equilibrium data for hydrocarbon ternary systems (ethane-n-butane- n-pentane). The network was highly efficient and suitable for training the experimental data because the set target and performance goal was met. The accuracy of prediction of neural network increases when the network is iteratively trained. For the ternary systems, mean square errors are negligible and predicted values were very close to the targets. In addition, good correlation results for hydrocarbon ternary systems were achieved as correlation coefficient
is close to 1 for each of the system. A successful
validation test evidenced in the corresponding predicted values of liquid phase compositions and its equivalent vapour phase compositions also indicates that the predictive capability of the network is highly efficient. All these confirmed conclusively that neural network is a viable tool for the correlation of vapour-liquid equilibrium data for hydrocarbon ternary system.
Research work can however be extended to other ternary systems like alcohol.
[1] Coulson, J. M. and Richardson, J. F. Particles Technology and Separation Process, Vol., 2, 5th Edition, Sydney, Butterworth Heinemann. Pp. 206-264, (2002).
[2] Processium. Vapour-liquid Equilibrium. http://en.processium.com/thermodynamics/vapo ur-liquid-equilibrium.htm (accessed: 04-02-
2013)
[3] Mccabe, W. L. Smith, J. C. and Harriot, P. Unit Operations of Chemical Engineering, 7th Edition, Mc Graw Hil, Milan. Pp 20-64, (2005).
[4] Philip, C. W. Separation in Chemical
Engineering, Oxford Press, New York. Pp 271-
291, (1997).
[5] Yamamoto, H. and Tochigi, K. Prediction of Vapour-Liquid Equilibra Using Reconstruction Learning Neural Network Mehtod. Fluid Phase Equilibra. 257: 169-172, (2007).
IJSER © 2013 http://www.ijser.org
International Journal of Scientific & Engineering Research, Volume 4, Issue 8, August-2013 1898
ISSN 2229-5518
[6] Ernest, E. L. Applied Process Design. Vol.,
2, 3rd Edition Plenum Press, New York. Pp 6-17, (2002).
[7] Mitra, D., Roy, D., Bandyopadhyay, M and Bhattacharya, P. Prediction of Vapour-liquid Pseudo-equilibrium for Pervaporation of Benzene-cyclo-hexane System. Indian Journal of Chemical Technology, Vol.13 pp. 290- 293, (2006).
[8] Goral M., Skrzecz, A., Bok, A., Maczynski, A. and Oracz . Journal of Phy.Chem. Ref. Data.
33, 959, (2004).
[9] Kasprzycka-Gutman, T. and Oracz, P. Recommended Vapour-Liquid Equilibrium Data. Part 4. Binary Alkanol-Alkene/Alkyne Systems. Journal of Physical Chem. Ref. Data.Vol., 35 (4) 1577-1595, (2006).
[10] Rattan, V. K., Gill, B. K. and Kapoor, S. Isobaric Vapour-Liquid Equilibrium Data for Binary Mixture of 2- methyl tetrahydrofuran and Cumene. World Academy of Science, Engineering and Technology. (23) 41-44, (2008).
[11] Moghadassi, A. R., Nikkholgh, M. R., Hosseini, S. M, Parvizian, F. and Sanaeirad, A. Prediction of Vapour-Liquid Equilibrium (V LE) Data for Binary Systems: Case Study: Methane/tetra fluoro methane. Journal of Engineering and Applied Sciences. Vol., 6 No
(8):1-8, (2011).
[12] Guha, A. and Pal, R. Prediction of Vapour- Liquid Equilibrium (V LE) of Some Binary Liquid Systems by Generalized London Potential Method. Indian Journal of Chemical Technology. Vol., 14, pp. 178-182, (2007).
[13] Graczova, E., Steltenpohl, P., Balintova, L. and Krsackova, E. Correlation of Vapour-Liquid Equilibrium Data of Ternary Systems. Chem. Pap. 58(6) 442- 446, (2004).
[14] Demuth, H. and Beale, M. Neural Network Tool box. User’s Guide. The Math Works Inc., M. A. (2002).
[15] Okeyinka, A. E. Introduction to Modelling and Simulation of Physical Systems. Pp. 120-
124, (2006).
[16] Dasturt, S. P. and Thodos G. Chemical Engineering Science. Vol. 19, Oxford Pergaman Press Ltd. Pp. 935-952, (1964).
[17] Dasturt, S. P. and Thodos G. Vapour- Liquid Studies for Ethane-Butane- Pentane Ternary System at 1500C. Journal of Chemical Engineering. Vol., 7, No 3: 1-17, (1964).
IJSER © 2013 http://www.ijser.org