International Journal of Scientific & Engineering Research Volume 3, Issue 10, October 2012
ISSN 2229-5518
USE OF INDUSTRIAL POLLUTION PROJECTION SYSTEM (IPPS) TO ESTIMATE POLLUTION LOAD BY SECTOR IN TWO INDUSTRIAL ESTATES IN OGUN STATE, WESTERN NIGERIA
*B.O. Odesanya1, S.O. Ajayi1, M. Shittu2 & O. Oshin2
1 College of Pure and Applied Sciences, Caleb University, Imota. Lagos State; 2 Chemistry Department, Olabisi Onabanjo University, Ago-Iwoye. Ogun State. Nigeria.
We have used industrial projection pollution system (IPPS) to generate estimates of pollution load by industrial establishments in two industrial estates in Ogun state, Western Nigeria using employment data.
Results indicate that the most polluting sectors are chemical and pharmaceuticals (CPH), basic metal (BML) and food, beverage and tobacco (FBT), the three giving a cumulative contribution of 97.18% of pollution to all media. The least polluting sectors are Electrical and electronic sector (EES) (0.02%), Motor vehicle assembly (MVA) (0.04%) and Wood and wood products (WWP) (0.13%). The trend is consistent with results obtained in other developing economies although estimation parameters differ. They sectoral ranking of pollution intensity is similar to the findings of Oketola and Osibanjo10, 12 in a similar study for Lagos.
It has been established that few sectors account for most pollution load to the environment. They are also the sectors that account for 83.36% of the total personnel employed. There is thus a need to formulate policy that would reduce pollution load without significantly reducing employment.
KEYWORDS: Industrial Pollution Projection System (IPPS), Pollution Intensity, Pollution load, Industrial Pollution, Employment.
----------------------------- ♦ ------------------------------
The quest for industrial development is one of the main objectives of nations. Industrial production, however, comes with attendant problems especially that of pollution. Governments and, at times, private establishments use the establishment of industrial estates as incentives for entrepreneurs to start manufacturing projects in specific areas known as Industrial Estates. Government’s intention is generally to stimulate the creation of multiplier effects from such industries for its citizens and also earn itself extra revenue in form of taxes.
Ota industrial estate was established to lure manufacturing industries from the older and, then increasingly chocked, Ikeja industrial estate by the Ogun state Government to facilitate rapid development of the area. The seeming lack of adequate space, planning and proper management led to the start-up of another industrial estate at Agbara by a private concern. The latter introduced centralized waste management systems to ensure efficiency. However, all industries in the estates generate industrial pollution load whose effects on the environment could not be properly assessed as they could not be quantified. Plant level monitoring of air, water and toxic emissions are virtually non- existent and the lack of trained personnel make pollution load associated with these processes virtually impossible to evaluate. This ultimately makes developing countries, unlike their developed counterparts, unable to get required information to set priorities, strategies and action plans on environmental issues. The World Bank team developed the Industrial Pollution Projection System (IPPS) as a rapid assessment tool for pollution load estimation for policy development.
The Industrial Pollution Projection system (IPPS) is a modelling system using industry data to estimate industrial pollution profiles for countries, regions, urban areas and even proposed projects. IPPS has been developed to exploit the fact that industrial pollution is heavily affected by the scale of industrial activity, its sectoral composition, and the process technologies employed in production. Although most developing countries have little or no industrial pollution data, many of them have relatively detailed industry survey information on employment, value added or output. IPPS is designed to convert this information to the best feasible profile of the associated pollutant output for countries, regions, urban areas or proposed new projects. It operates through sector estimates of pollution intensity, or pollution per unit of activity. IPPS is based on a combination of data of industrial activity (like production or employment) with data on pollution emissions to obtain pollution intensities (which is defined as pollution per unit of output or pollution per unit of employment) 7 with respect to any of three economic variables – total output, value added and employment.
IPPS was developed from a database of environmental and economic data for about 200,000 facilities spanning 1500 product categories with different operating technologies and pollutants to project air, water and solid waste emissions. It incorporates a range of risk factors for human toxic and ecotoxic effects. Although, undoubtedly the most comprehensive system of its kind in the world, the applicability of IPPS to other economies will normally be influenced by many country-specific factors hence values obtained serve as a guide to probable pollution problems.
This study estimates the pollution load to all media of industries in the two industrial estates located in Ogun state, Western Nigeria
IJSER ©2012 http://www.ijser.org
International Journal of Scientific & Engineering Research Volume 3, Issue 10, October 2012
ISSN 2229-5518
using IPPS values with respect to employment based on the four- digit levels of aggregation in the International Standard Industrial Classification (ISIC). Thirty seven (37) manufacturing concerns were divided into the sectoral groups and IPPS used to estimate
PL =
PIxTEM
![]()
1000x2204.6
pollution intensities into the various selected media.
2. EXPERIMENTAL: MATERIALS AND METHODS
2.1 Description of study area
The close proximity (figure 1) to the commercial capital of Nigeria
– Lagos obviously influenced the location of the two industrial estates in adjoining Ogun state, Western Nigeria. Ota Industrial Estate was established by the Ogun state government in 1983 to attract some manufacturing concerns out of Lagos and also provide additional revenue sources to the state. The Agbara Industrial Estate, though a private initiative, was established with similar objectives in mind. This closeness to Lagos is to encourage industrial premises in Lagos to relocate to supposedly better planned systems with some financial benefits like tax exemptions thrown in.
Where PL= pollution load in ton/y
TEM = total number of employees
PI = pollution intensity in pounds per thousand employees per year
2204.6 is the conversion factor from pounds to tons
2.3 Statistical analysis
A 2-tailed Pearson correlation and Analysis of Variance (ANOVA) were used to test the data obtained. The results indicate close correlation within sectors but across sectors, the correlation is doubtful.
3. RESULTS AND DISCUSSION
Table 1 shows the contributions of each sector to air pollution load (ton/yr) with respect to employment in the Industrial estates. Basic Metal sector (BML) has the highest number of employees during the period of study followed by Chemicals and Pharmaceuticals (CPH), Food, Beverage and Tobacco (FBT), Domestic and Industrial Plastics (DIP) and Wood and Wood Products (WWP) respectively. Paper and Pulp products (PPP), Electrical and Electronic sector (EES) and Non-metallic Mineral Products (NMP) have the least number of employees.
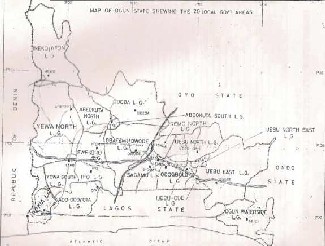
Figure 1: Map of Ogun State, Nigeria showing the location of OTA and AGBARA Industrial estates
2.2 Data acquisition
Lower bound (LB) pollution intensities by media with respect to employment obtained from the World Bank report7, 8 was used to calculate the pollution load for 9 industrial sectors obtained after merging the intensities of the 79 major categories in the ISIC code. Employment data covering the 4-year period of study (2005 – 2008) were obtained from the Manufacturers’ Association of Nigeria (MAN) and, where insufficient, from the individual companies.
Aggregated pollution intensities were estimated using the formula:
Table 1: Sectoral Air pollution load.
IJSER ©2012 http://www.ijser.org
International Journal of Scientific & Engineering Research Volume 3, Issue 10, October 2012
ISSN 2229-5518
3.1 Air Pollution Load
3.1.1 Air pollution load distribution by pollutant type
Emission into air was estimated based on emission of Total Suspended Particulates (TSP), Sulphur (IV) oxide (SO2), Nitrogen (IV) oxide (NO2), Carbon monoxide (CO), Fine particulates (FP) and Volatile organic carbon (VOC). The values obtained are given in Table 1. Chemical and Pharmaceutical (CPH) sector is the highest generator of emissions for 5 of the 6 USEPA’s criteria air pollutants accounting for 61.53% (SO2), 70.55% (NO2), 69.79% (CO), 64.9% (VOC) and 63.19% (TSP). BML is the next serious polluting sector with 24.20%, 9.72%, 26.29%, 10.23% and 23.75% respectively. The least polluting sector is the non-metallic products (NMP) with 0.23%, 0.25%, 0.03%, 0.01% and 0.78% for the pollutant types. The wide variety of chemical entities utilized in both CPH and BML sectors would account for their relative high mix of pollutants. FBT, in the emission of FP with 59.31%, is the exception to this general rule.
3.1.2 Air pollution load distribution by sector
3.2 Water pollution load
This was estimated relative to the chemical measurement terms Biological Oxygen Demand (BOD) and Total Suspended Solids (TSS) – the two US EPA’s water pollutant indicators and the values obtained are shown in Table 2.
Air pollution load is mainly from the CPH – 90799.65 ton/yr (63.03%), BML – 27960.7 ton/yr (19.41%) and FBT – 20658.44 ton/yr (14.34%) sectors contributing a cumulative load of 96.78% of total air pollution into the air. The least polluters are MVA – 76.3 ton/yr (0.05%) and EES – 21.54 ton/yr (0.01%). The relative contribution values are given in figure 2.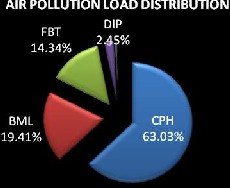
Figure 2: Relative contribution to Air pollution by sector
Table 2: Sectoral pollution Load to Water
By far the highest sector for pollution into water is BML – 43511.59 ton/yr (71.84%) followed by CPH – 10468.4 ton/yr (17.28%) and FBT – 6063 ton/yr (10.01%). The three give a cumulative load of
99.13% of total pollution load to water. Industries in these sectors are liable to washings between lots/batches and have a high tendency to use water as a medium for these processes. This would account for the high TSS values for BML -42921.45ton/yr (77.54%) and BOD values for FBT- 3065.53 ton/yr (58.81%). CPH – (16.3% TSS, 27.7% BOD) comes in between in both cases. All other sectors have negligible contributions as shown in figure 3.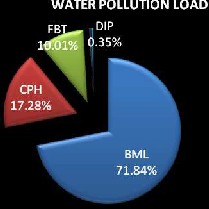
Figure 3 Relative contributions to water pollution by sector
IJSER ©2012 http://www.ijser.org
International Journal of Scientific & Engineering Research Volume 3, Issue 10, October 2012
ISSN 2229-5518
3.3 Toxic chemical pollution load
The most likely causes of chemical pollution are residues of pesticides, organic chemicals like benzene, toluene, xylene, chloroethane and chloromethane7, 8
3.3.1 Toxic chemical pollution load distribution by medium
Toxic chemical pollution load was estimated into 3 media – air, water and land and the pollution intensities are given in Table 3.
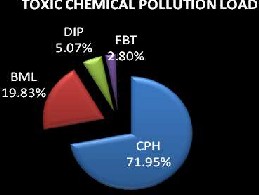
Figure 4: Relative contribution to toxic chemical pollution to all media
3.4 Toxic metal pollution load
Hettige et al7 listed metal compounds used in the estimation of toxic metal intensity as Al, V, Zn, Sb, Ba, Be, Cd, Cr, Co, Cu, Pb, Mn, Hg, Ni, Ag and their compounds, thallium, thorium dioxide and titanium tetrachloride.
3.4.1 Toxic metal pollution load distribution by medium
Table 3: Sectoral Toxic Chemical pollution load.
The major toxic chemical polluters to air are CPH - 4619.83 ton/yr (63.19%) and BML – 1736.33 ton/yr (23.75%) while PPP – 25.26 ton/yr (0.036%) and NMP – 0.78 ton/yr (0.04%) are the least contributors.
CPH – 992.01 ton/yr (84.43%) is the main polluter to water while EES – 0.03 ton/yr and NMP – 0.05 ton/yr are negligible contributors. Toxic chemical pollution to land is contributed mostly by CPH – 12349.69 ton/yr (74.95%) followed by BML – 3115.08 (18.91%). Conversely, WWP- 2.37 ton/yr (0.01%) and NMP – 0.82 ton/yr are negligible contributors. The results could be attributed to the high chemical usage in CPH and BML industries.
3.3.2 Toxic chemical pollution load distribution by sector
Toxic metal pollution load estimates for all sectors is given in Table
4. BML is the largest polluting sector for toxic metals with 82.36 ton/yr (76.96%), 2045.39 ton/yr (82.84%) and 5.53 ton/yr (31.37%) to air, land and water respectively. It is surpassed in intensity of pollution to water by CPH with 11.46 ton/yr PI (65.02%). All other sectors contribute negligibly to contamination to this medium.
CPH gives the highest emission of toxic chemicals to all media with a total intensity of 17961.53 ton/yr (71.95%). The sector is followed by BML (19.83%), DIP (5.07%) and FBT (2.80%) as the major contributors to toxic chemical pollution load. The least toxic chemicals polluting sectors are MVA (0.06%), EES (0.02%) and NMP (0.01%). The relative contributions of each sector are shown
in figure 4.
Table 4: Sectoral Toxic Metal pollution load.
IJSER ©2012 http://www.ijser.org
International Journal of Scientific & Engineering Research Volume 3, Issue 10, October 2012
ISSN 2229-5518
3.4.2 Toxic metal pollution load by sector
Toxic metal pollution load estimates show that BML is the highest polluting sector with 2133.27 ton/yr (82.24%). CPH with a pollution load of 402.32ton/yr (15.51%) and DIP with a load of 48.22 ton/yr (1.85%) make these three sectors have a cumulative pollution contribution of 99.6% emphasizing the fact the toxic metal pollution of all the other sectors are insignificant. These facts are presented in figure 5.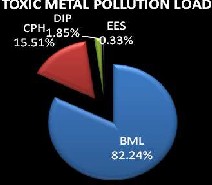
Figure 5: Toxic metal pollution load by sector
3.5 Total pollution load to all media by sector
Table 5: Total pollution load to all media by sector
Table 5 shows the pollution load by all sectors to all the studied media and their percentage contributions to total pollution load to the environment. CPH is the most polluting sector with a total pollution load of 119631.9 ton/yr or 51.52% of the emissions of the studied pollutants followed by BML with a total contribution of
33.83% (78555.58 ton/yr). The next highest polluting sector is FBT
with a total pollution load of 27420.91 ton/yr (11.81%) and DIP with a contribution of 5051.91 ton/yr (2.18%). All the other sectors contribute negligibly to pollution load and this is amply demonstrated in figure 6.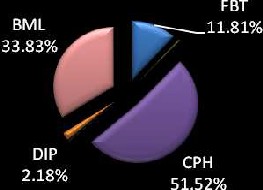
Figure 6: Total Pollution load to all media by sector
This study is a continuation of the World Bank objective of compiling cross-country and cross regional variations in economic and sectoral policies as well as strictness of regulation in various regions of the world.
IPPS has been useful in developing policy in developing countries mainly due to its relatively modest data requirements. It can be used as an early warning mechanism designed mainly to identify situations where toxics emitted by manufacturing processes could be a major concern. It is pertinent to mention that EPA data used to calculate IPPS coefficients only cover facilities releasing pollutants over a threshold level of emissions hence PI based on these data may be biased. There is also an underestimation bias in these calculations because the coefficients assume the hypothesis that non-reporting facilities have no emission (hence are assigned zero emission). The results thus obtained can only be indicators of actual emission.
IPPS estimates are not intended as an alternative to proper monitoring of pollution sources but to provide regulatory agencies with information that can help to prioritize the monitoring effort and help in allocating monitoring resources more efficiently2. While in the industrializing economies of South America, input-output data is used 2. 5 to estimate the value of production and potential PI using IPPS, in the developing economies like in West Africa, employment is the most reliable indicator of scale of activity hence production levels. The index used for measurement plays a vital role in the pollution load values obtained. The application of IPPS in Latvia9 and Lagos11 using both production and employment indices show that estimates of pollution emissions are larger using employment by a factor of approximately 1 to 10 compared to when production indices are used. This could be due to exchange rate factors with variations playing a major role. Overstaffing, especially in developing countries, would also impact on pollution load. Etim4, in a comparison of two modelling techniques – IPPS and rapid
IJSER ©2012 http://www.ijser.org
International Journal of Scientific & Engineering Research Volume 3, Issue 10, October 2012
ISSN 2229-5518
pollution inventory survey RPIS3- using employment indices found that IPPS generally gave higher pollution loads than RPIS. Benoit and Craig1 found, in Thailand, that although environmental laws and institutions were in place, weak monitoring and enforcement policies were hindering policy formulation. This is generally the situation in developing countries hence the need for modelling techniques like IPPS to formulate policy. Results from such studies could thus be used to recommend appropriate responses to emergent pollution problems especially for new projects. The fact that most industries in the developing economies of the world use older manufacturing technologies would also indicate that PI should be higher than IPPS estimates which are based on relatively newer technologies.
The overall trend in industrial pollution in an expanding economy depends on whether the scale effect of expanding output is
counteracted by the process effect and whether or not the composition effect tends to reinforce the scale effect or offset it.
4.0 Conclusion
IPPS is a veritable tool in estimating pollution load in developing countries where sufficient data for mass balance calculations from production processes are not available. This is especially useful in mitigating pollution effects from industry in countries that have no other parameters than employment figures. The results are in agreement with the trend in developing countries of Asia and South America even though the value added index is widely used in those countries due to the availability of export data. The results further reinforce the postulations of the Kuznets curve6 that relates pollution to level of wealth of an economy and is a further vindication of the apostles of “Pollution havens”.
REFERENCES
1. Benoit, L and Craig, M. (2001). Estimating conventional Industrial water pollution in Thailand. Paper presented to the development research group of the World Bank.
2. Dasgupta, S., Lucas, E.B. and Wheeler, D. (2000).
Small plants, pollution and poverty: New evidence from
Brazil and Mexico. Policy Research working paper, No.
2029.
3. Economopolos, A.P. (1979). Rapid assessment of water and air pollution in Abidjan, Ivory Coast. W.H.O. Athens. Pp 1-56.
4. Etim, E.U. (2012). Estimation of pollution load from an
Industrial estate, South Western Nigeria. African
Journal of Environmental Science and Technology, Vol.
6 (2), pp125-129.
5. Faisal, Islam., Rumi Shammiu and Juhaina Junaid. (1991). Industrial pollution in Bangladesh. Retrieved from http://www.worldbank.org/nipr
6. Hettige, H., Mani, M and Wheeler, D. (1997). Industrial pollution in economic development (Kuznets Revisited). World Bank development research group.
7. Hettige, H., Martin, P., Singh, M and Wheeler, D. (1994). The Industrial pollution projection system (IPPS) policy. Research working paper, No. 1431, Parts
1 and 2.
8. Hettige, H., Martin, P., Singh, M and Wheeler, D. (1995). The Industrial pollution projection system (IPPS) policy. Research working paper, No. 1431, Part
3.
9. Laplanta, B and Smits, K. Estimating Industrial pollution in Latvia. World Bank report, pp 1-42.
10. Oketola, A.A and Osibanjo, O. (2007). Estimating sectoral pollution load in Lagos by Industrial pollution projection system (IPPS). Science Total Environment,
377(2-3), pp 125-141.
11. Oketola, A.A. and Osibanjo, O. (2009a). Estimating sectoral pollution load in Lagos by Industrial pollution projection system (IPPS): Employment versus Output. Toxicological and Environmental Chemistry, 91, (5),
799-818.
12. Oketola, A.A. and Osibanjo, O. (2009b). Industrial pollution load assessment by Industrial pollution projection system (IPPS). Toxicological and Environmental Chemistry, 91, (5), 989-997.
IJSER ©2012 http://www.ijser.org