International Journal of Scientific & Engineering Research, Volume 5, Issue 12, December-2014 - 1341 - ISSN 2229-5518
Transmission Loss Allocation in Restructured Electrical Energy Market Based on Circuit Theory and Network Usage
A. Eladl, A. Elmitwally, S. Eskander, I. Mansy
Abstract— This paper proposes a new analytical method for transmission power loss allocation for pool-based markets in restructured power systems. It is based on circuit laws and the concept of orthogonal projection. In this method, the current flow in each branch is divided into two components by using the superposition principle. The first one is due to the power transfer from generators to distribution companies or loads. The second component is due to the voltage differences between generation companies buses. The later currents are called no-load or circulating currents. The responsibility of each load and generator to power losses in each branch of the network is derived analytically. Hence, the share of each load or generator in the overall transmission network losses is estimated. The proposed method is applied to two test systems and compared with four well known methods.
Index Terms— Transmission loss allocation, Circuit theory, orthogonal projection, restructured power systems.
—————————— ——————————
1. INTRODUCTION
ESTRUCTURING and privatization of electric power industry has expanded around the world. Restructuring is a change in structure of commercial arrangements in
selling energy. Meanwhile privatization is a change of ownership from the government to the private sector that helps create choices and competition. This introduces open electricity market for trading electricity between generators and suppliers in competitive environments. This new structure of the system leads to increase of efficiency, reliability, and then increase the social welfare [1]. There are four types of trading arrangements in the restructured power system. These are single buyer trading, pool trading, bilateral contracts trading and hybrid pool/multilateral trading. Under restructuring, all the entities are separated into three types of companies which are generation companies (GENCOs), transmission companies (TRANSCOs) and distribution companies (DISTCOs).The government no longer owns these companies [1], [2]. Due to this change of electric system structure, several problems and challenges have arisen. One of these problems is the transmission loss allocation [3]-[5].The transmission loss in a power network is influenced by a number of factors including location of generating plants and load points, types of connected loads, network configuration, and design of lines and transformers[6].The distribution of this loss among buses (Loss Allocation) modifies the distribution of revenues and payments among suppliers and consumers[7]-[10].Therefore, the transmission loss allocation is a continuous issue related to a huge amount of money and should be distributed fairly among generators and consumers [8].
Several difficulties make the allocation of transmission
————————————————
• A. Eladl is currently pursuing PhD degree program in Electrical Power and Machines, Faculty of Engineering- Mansoura University, Mansoura 35516, Egypt, , PH-01227074312. E-mail: eladle7@yahoo.com
losses among market participants uneasy job. The first is that, the transmission loss is a non-linear function of power system state variables, and it is difficult to identify which generator or load is responsible for the flow and loss in a certain line[3, 4,
11].The second is that, there is no unique solution that satisfies all market participants [4, 6]. In several countries, the loss charge is a cost embedded in the total system cost. Due to simplicity, this approach is appreciated. Nonetheless, it is imprecise and thus considered unfair [3]. To be fair and satisfactory, loss allocation algorithm should [5, 7]:
consistent with the results of a power flow.
reflecting the magnitude of the power or current
injected or consumed at each bus.
reflecting both the network topology and the voltage-
current relationships.
provide appropriate economic signals to the market
participants;
avoid volatility;
simple to understand and implement.
A number of loss allocation methods have been recently proposed in the literature. These methods can be divided into the following categories: pro rata, incremental transmission loss, proportional sharing, and circuit theory based techniques. These methods can be explained as follows:
a) Pro rata technique: is one of the most common techniques used for transmission usage and loss allocation among the market participants [7].First, the transmission system losses are assigned to the generators and/or loads, for instance 50% of losses are allocated to each category [5,
8].Then, a proportional distribution rule is used: the losses allocated to a producer (consumer) are proportional to its corresponding level of active power (or current injection) [12-
14]. This technique is simple to understand and implement but it ignores the relative location within the network (the configuration of networks) and electrical distance between
IJSER © 2014 http://www.ijser.org
International Journal of Scientific & Engineering Research, Volume 5, Issue 12, December-2014 - 1342 - ISSN 2229-5518
buses. Thus, buses close to or distant from the generation centers are similarly penalized [13].
b) Proportional Sharing technique [15-23]: in this method, the results of a converged power flow are combined with a linear proportional sharing principle to allocate transmission losses among market participants [18]. It is assumed that the power injections are proportionally shared among the outflows of each bus and trace the power flow down from the generation sources or up from the load sinks[19].The disadvantage of this approach is that, there is no possibility of allocation of loss due to generators and loads at the same time [7, 13, 19]. Furthermore, the losses allocated to the generating buses relative to the demand buses must be specified arbitrarily (typically 50%)which lacks physical and economic justification [5].
c) Marginal loss allocation technique [24-29]: In this method, the incremental transmission loss coefficients (ITLC) are used for allocation of transmission losses to network users according to the sensitivity of system loss to their power consumption or generation level [24].the choice of the slack bus is problematic in this method [24]. Since the ITLC of the slack bus is zero by definition, the slack bus is allocated no losses. Furthermore, ITLC can be either positive or negative which may result in the allocation of negative losses to certain buses. In addition, the losses are highly dependent on the incremental steps taken. This makes a loss allocation to be non-unique [25].
d) Circuit theory based techniques: these methods integrate the network characteristics and circuit theories into loss allocation [30]-[37]. Ref. [7] presents a method based on Z-bus matrix. If the network has a low value of shunt element leading to a nearly singular Y-bus matrix, then this method fails to allocate loss [1], [30].The method described in [4] partitions the Y-bus matrix to express the current of the load buses as a function of the generators’ currents and load voltage. Then it uses the modified Y-bus to decompose the load voltage dependent terms into components of generator dependent terms. In [30], [33], the transmission losses are decomposed into load loss, circulating current loss caused by the circulating current between generators, and the network loss. Analytical method is provided for allocating each loss component to the parties contributing to it. A usage-based transmission loss allocation method is proposed in [13].This method calculates the transmission loss contribution from the generators and the loads using their contract obligations in the open access environment. Some circuit-based approaches highly depend on the transmission line parameters. Any change in these parameters causes a large change in the distribution of the system losses among market participants for the same loads [30].
The methods in [8], [34] assumed an equal 50/50 loss allocation ratio to generators and to loads. Thus, the compensation received by any generator is at the expense of another generator, and the same for the loads. In [36], a method to allocate losses using a loop-based representation of system behavior and the graph theory is reported. The distribution of losses among market participants depends on the shape of the constructed trees. The shape of the tree depends on the method of construction used. Since there is
more than one way to build the trees, this method has more than one solution. Also, this method does not take into account the reactive power losses. In addition, this method adds nodes due to transforming several adjacent nodes from delta to wye. The major problem with game theory based allocation method in [12] is the huge simulation and computations time required to arrive at a solution. So, it is a difficult approach for real time implementation. The sharing ratio in [8] depends on the ratio between the orthogonal component of bus current and the total amplitude of branch current. This ratio is not fixed and depends on the loading condition. Besides, if the system contains buses having both generation and demand, such a bus is seen as generation or load bus according to the larger of them. As this method neglects the effect of counter flow, no bus can have a negative cost allocation that seems impractical.
This paper presents a new analytical method for transmission power loss allocation in restructured power systems. It is based on circuit laws and the concept of the transmission network usage. In the proposed method, the current flow in each branch is split into two components by using the superposition principle. The first one is due to the power transfer from generators to distribution companies (DISCOs) or loads. The second component is due to the voltage differences between generation companies (GENCOs) buses. These later currents are called no-load or circulating currents. The responsibility of each load and generator to power losses in each branch of the network is derived analytically. Thus, the share of each load or generator in the overall transmission network losses is estimated. The method is extended to consider the time variation of loads and wind generation. Furthermore, the impact of bilateral/ multilateral contracts is included in the transmission network energy loss allocation.
The rest of the paper is organized as follows: section two presents the problem formulation of transmission loss allocation. Section three provides the method used to distribute the loss between market participants. Fourth section presents results of the proposed approach and compares these results with four different methods on an IEEE 6 and 30 bus system followed by a conclusion.
2. PROBLEM FORMULATION
Starting from applying Kirchhoff’s law at each node of the transmission network with the network equations in YRBusR form. These equations can be written in a matrix form as follows:
[𝐼𝐵𝑢𝑠 ] = [𝑌𝐵𝑢𝑠 ] × [𝑉𝐵𝑢𝑠 ] (1)
where IRBusR is a vector of all bus currents in the system, YRBusR is
the bus admittance matrix, and VRBusR is a vector of all bus
voltages in the transmission network.
Considering a system of NRBusR nodes in which there are NRGR
generator buses that participate in producing and selling the
electrical power to remaining loads nodes NRLR, where NRLR= NRBusR
- NRGR. Additional, the bus admittance matrix of the typical
power system is large and sparse [33], therefore it can be
partitioned in a systematic way. Thus it is possible to rewrite Eq.
(1) into its matrix form as shown in the following equation:
IJSER © 2014 http://www.ijser.org
International Journal of Scientific & Engineering Research, Volume 5, Issue 12, December-2014 - 1343 - ISSN 2229-5518
𝐼𝐺
= 𝑌𝐺𝐺 𝑌𝐺𝐿
� 𝑉𝐺
� (2)
result of the loads currents flow from generation nodes to
�𝐼𝐿 �
𝑌𝐿𝐺 𝑌𝐿𝐿
𝑉𝐿
loads nodes through ZLL
. These losses are afforded by loads.
where IG is the vector of current injection at generation nodes, IL is the vector of current consumption at loads nodes, VG is the voltage vector of generation nodes, and VL is the voltage vector of loads nodes. YGG is the self-admittance matrix of generator nodes, YGL is the mutual admittance matrix between generation and load nodes, YLG is the mutual admittance matrix between load and generation nodes, and Y LL is the self- admittance matrix of load nodes.
From eq. (2), the IG and IL can be expressed in terms of VG ,
VL and YBus partitions as follows:
𝐼𝐺 = 𝑌𝐺𝐺 𝑉𝐺 + 𝑌𝐺𝐿 𝑉𝐿 (3)
𝐼𝐿 = 𝑌𝐿𝐺 𝑉𝐺 + 𝑌𝐿𝐿 𝑉𝐿 (4)
with VG and IL are considered as the state variables, it is
straightforward to find VL from eq. (4) as follows:
𝑉𝐿 = 𝑍𝐿𝐿 𝐼𝐿 − 𝑍𝐿𝐿 𝑌𝐿𝐺 𝑉𝐺 (5)
where 𝑍𝐿𝐿 = 𝑌𝐿𝐿 −1
Substituting for VL from eq. (5) into eq. (3) yields
𝐼𝐺 = ( 𝑌𝐺𝐺 − 𝑌𝐺𝐿 𝑍𝐿𝐿 𝑌𝐿𝐺 )𝑉𝐺 + 𝑌𝐿𝐺 𝑍𝐿𝐿 𝐼𝐿 (6)
or
𝐼𝐺 = 𝑌𝐺𝑀 𝑉𝐺 + 𝑌𝐿𝐺 𝑍𝐿𝐿 𝐼𝐿 (7)
where YGM = (YGG – YGL ZLL Y LG ).
These equations ((5,), (7)) can be written in a matrix form as
follows:
Nonetheless, these losses are completely separable as shown
above and as it are going to be shown in the following
sections.
3. TRANSMISSION LOSS ALLOCATION TECHNIQUE
This section proposes a method to allocate the transmission losses among GENCOs and DISCOs. Since the voltages and currents of a transmission network are linear, the principle of superposition can be applied to analyze the network [34].
3.1 Loads Loss
As the load current flow is necessary to transfer the electrical power from GENCOs to DISCOs, the load losses are unavoidable. To determine the current flow in each branch due to load currents, all voltages sources at generation nodes have to be de-energized by setting their voltages to zero. With represent the load currents as current sources, the generation node voltages can also be expressed as:
𝑉𝐺 = 𝑧𝑒𝑟𝑜𝑠[𝑁𝐺 × 𝑁𝐿 ] 𝐼𝐿 (9)
The load nodes voltages can be determined as follows:
𝑉𝐿 = 𝑍𝐿𝐿 𝐼𝐿 (10)
The voltage drops across the branches due to the load
currents can be written as follows
𝑉𝑉𝐵𝑟 = 𝐴𝑇 𝑉𝐵𝑢𝑠 , 𝑉𝐵𝑢𝑠 = [𝑉𝐺 ; 𝑉𝐿 ] (11)
Where AT is transpose of the bus incidence matrix of the
�𝐼𝐺
� = �
𝑌𝐺𝑀 𝑌𝐺𝐿 𝑍𝐿𝐿
� 𝑉𝐺
� (8)
system. This branch to node incidence matrix A of the system
𝑉𝐿
−𝑍𝐿𝐿 𝑌𝐿𝐺 𝑍𝐿𝐿
𝐼𝐿
can be partitioned into two sub-matrices, one for generation
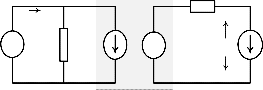
The equivalent circuit representing equation (6) is shown in
Fig. 1.
nodes AG and the other for the load nodes AL . Therefore, the voltage drops across the branches because of load currents can be also calculated from as:
𝑇 𝑉
= 𝐴𝑇 𝑍 𝐼
(12)
IG ZLL +
𝑉𝑉𝐵𝑟 = 𝐴𝐿 𝐿
𝐿 𝐿𝐿 𝐿
+ YGM
-
VG
YGLZLLIL
+
- VL
-ZLLYLGVG IL
-
Hence, the current flow in each branch due to loads current can now be calculated by multiplying the voltage drop across each branch by its admittance. In matrix form, the load current through branches are determined by multiplying the branch admittance matrix and the voltage drop vector:
Fig. 1 the equivalent circuit of transmission network.
From Fig. 1 it is clear that, the total network loss splits into
𝐼𝐵𝑟,𝐿𝑇 = 𝑌𝐵𝑟 𝑉𝑉𝐵𝑟 = 𝑌𝐵𝑟 𝐴𝑇 𝑉𝑏𝑢𝑠
𝑇 𝑧𝑒𝑟𝑜𝑠[𝑁𝐺 × 𝑁𝐿 ]
two independent components, one of them occur in ZLL and the second occur in ZGM .(the inverse of YGM ). To determine
= 𝑌𝐵𝑟 𝐴 �
𝑍𝐿𝐿
� 𝐼𝐿 = 𝐾𝐵𝑟,𝐿 𝐼𝐿 (13)
how to distribute the transmission loss among participants in the market in a fair and accurate method, the principle of superposition is used. In the first, with putting the loads
where IBr,LT is a vector of total load current in each branch,
and
𝑇 𝑧𝑒𝑟𝑜𝑠[𝑁𝐺 × 𝑁𝐿 ]
currents equal to zero, no loss occurs in ZLL . The losses occur in this case in ZGM only due to the circulating currents
𝐾𝐵𝑟,𝐿 = 𝑌𝐵𝑟 𝐴 �
𝑍𝐿𝐿
� (14)
between generators buses. This circulating currents resulting from the voltage differences between generators buses, which occur due to the limits on active and reactive power of each generator [30]. This type of losses afford by the generators. With equal voltages at the generation nodes, this caused the loss in ZGM equal to zero. The second type of losses occurs as a
where YBr is the branch admittance matrix, which is a
diagonal matrix with its main diagonal elements are the
branch admittances. Matrix KBr,L is the load current
distribution factors matrix whose element kij defines the
current fraction of jth load that flows through the ith branch.
This matrix is a Pseudo-inverse for the incidence matrix of
IJSER © 2014 http://www.ijser.org
International Journal of Scientific & Engineering Research, Volume 5, Issue 12, December-2014 - 1344 - ISSN 2229-5518
branches to load nodes AL , where AL K Br,L = ones(NL ) and KBr,L AL X= X for any matrix X of the same dimension. It is relevant to notice that KBr,L is independent of the network loading
where 𝑍𝐺𝑀 = 𝑌𝐺𝑀
𝑉𝐺 = 𝑍𝐺𝑀 𝐼𝐺0 (20)
−1
condition that is, it is determined by the network topology and impedance parameters and remains unchanged as long as no changes in the network configuration.
To determine the contribution of each load current in total branch current, the current column IL is replaced by diag(IL ),which is a diagonal matrix having load currents as its main diagonal elements as follows:
𝐼𝐵𝑟,𝐿 = 𝐾𝐵𝑟,𝐿 ⋅ 𝑑𝑖𝑎𝑔(𝐼𝐿 ) (15)
Now, the issue is to determine the fraction of losses caused
by total load current in each branch of the network. If the total
The load buses voltage at no-load condition can be
determined from (8) by substituting for VG from (20), and with
IL = 0 as follows:
𝑉𝐿 = −𝑍𝐿𝐿 𝑌𝐿𝐺 𝑍𝐺𝑀 𝐼𝐺0 (21)
The branch current flows due to the generators no-load
currents can then be determined once the voltages of all the
nodes are known in terms of IG0 . By the same steps defined in
(11)-(13), and using the voltages at all node, the total branches
currents due to the generators circuiting current in this case
are:
current through a certain branch is IBr , and the total loss in this branch is PBr , the loss, PBr,LT , due to a loads causing a partial flow IBr,LT through this line is thus calculated as follows [11]:
where
𝐼𝐵𝑟,𝐺𝑇
= 𝑌𝐵𝑟
𝑍𝐺𝑀
𝐴𝑇 �
– 𝑍𝐿𝐿 𝑌𝐿𝐺 𝑍𝐺𝑀
� 𝐼𝐺0
= 𝐾𝐵𝑟,𝐺
𝐼𝐺0
(22)
𝐼𝐵𝑟,𝐿𝑇 • 𝐼𝐵𝑟
𝑃𝐵𝑟,𝐿𝑇 =
|𝐼𝐵𝑟

|2 × 𝑃𝐵𝑟 (16)
𝐾𝐵𝑟,𝐺 = 𝑌𝐵𝑟 𝐴𝑇 � −𝑍
𝑍𝐺𝑀
𝑌 𝑍
� (23)
where • = is the dot product of a vector defined using
𝐿𝐿
𝐿𝐺
𝐺𝑀
orthogonal projection concept as follows:
𝐼𝐵𝑟,𝐿 • 𝐼𝐵𝑟 = ℜ�𝐼𝐵𝑟,𝐿 � ∙ ℜ(𝐼𝐵𝑟 ) + ℑ�𝐼𝐵𝑟,𝐿 � ∙ ℑ(𝐼𝐵𝑟 ) (17)
After these partial flows determined, it is straightforward
to determine the loss components in each branch attributed to
each load current. The loss allocated to each load is
determined as a fraction of the total load loss P Br,LT ,. This

fraction equals the ratio of the load current contribution to the
total branch load current and calculated as:
𝐼𝐵𝑟,𝐿• 𝐼𝐵𝑟,𝐿𝑇
Matrix KBr,G is the generator current distribution factors
matrix whose element kij defines the current fraction of jth
generator that flows through the ith branch, and have the same
properties as matrix KBr,L .
Similarly, to determine the contribution of each generator
current in total circulating branch current, the current column
IGO is replaced by diag(IGO ),which is a diagonal matrix having
generators no-load currents as its main diagonal elements.
𝐼𝐵𝑟,𝐺 = 𝐾𝐵𝑟,𝐿 ⋅ 𝑑𝑖𝑎𝑔(𝐼𝐺𝑂 ) (24)
In the same way as discussed above for loads loss, the
𝑃𝐵𝑟,𝐿 =
�𝐼𝐵𝑟,𝐿𝑇 �


2 × 𝑃𝐵𝑟,𝐿𝑇 (18)
generators no-load currents loss determined as follows:
𝐼𝐵𝑟,𝐺𝑇 • 𝐼𝐵𝑟
where PBr,L is the contributions of each load current in total
loss caused by loads current PBr,LT .
𝑃𝐵𝑟,𝐺𝑇 =
|𝐼𝐵𝑟 |2

× 𝑃𝐵𝑟 (25)
3.2 Generators Loss

The generator losses can be avoided if the generator voltages
Then, the branch power loss allocated to the Gth generator
PBr,G is determined in similar way to (18)as:
𝐼𝐵𝑟,𝐺 • 𝐼𝐵𝑟,𝐺𝑇
have equal magnitudes and at the same phase angle. But due to the limits of active and reactive power of each generator make it
𝑃𝐵𝑟,𝐺 =
�𝐼𝐵𝑟,𝐺𝑇�

2 × 𝑃𝐵𝑟,𝐺𝑇 (26)
impossible to achieve this condition, flat generator voltages, and satisfy the load demand at the same time [33]. The deviation from flat generators voltages gives rise to the circulating current through the network. The load has nothing to do with this loss; therefore, it has to be allocated to generators only.
The generator circulating current (no load current) is obtained by setting the load currents to zero. And to avoid floating system operation, very small shunt impedance connected between the generation nodes and ground. Setting IL in (8) to zero, and keeping the generator voltage as obtained from the power flow solution. The no-load currents of generators IG0 can be calculated using (8) with ‘IL = 0 as follows:
𝐼𝐺0 = 𝑌𝐺𝑀 𝑉𝐺 (19)
or the generation node voltages at no load equivalent to:
where PBr,G is the contributions of each generator current in
total loss caused by generators current PBr,GT . The total branch current is exactly equal to the sum of the partial currents IBr,LT and IBr,GT as determined by (13) and (22), respectively. In the same context, the transmission power loss in a branch is exactly equal to the sum of the generators-produced component PBr,GT and loads-produced component PBr,LT as determined by (17) and (25), respectively.
3.3 Allocation to DISCOs and GENCOs Plugged at the
Same Bus
If the system contains buses having GENCO and DISCO at the same time, such bus is represented by two buses. The first is a DISCO bus with a load equal to the original load. The second is a GENCO bus with the same generation of the original bus. The two buses are connected by a very low impedance branch as shown in Fig.2. Thus, the responsibility for the transmission
IJSER © 2014 http://www.ijser.org
International Journal of Scientific & Engineering Research, Volume 5, Issue 12, December-2014 - 1345 - ISSN 2229-5518
losses is computed for the load and the generator independently, which is a very important merit of the proposed method. Other methods just consider the equivalent power injection at this type of buses without separating the contributions of the load and the generator.
Start
Read system data
Run power flow
Determine: Vbus, Ibus, IBr,T, PG, PD, PLine, PBr, Ybus, YGG, YGL, YLG, YLL, YGM, A, AG, and AL
i
i very low Z
i’
i
very low Z
i’
Set VG = 0 then calculate VL(eq.
12), KBr,L (eq. 14), IBr,L (eq. 15), PBr,LT (eq. 16), PBr,L (eq. 18)
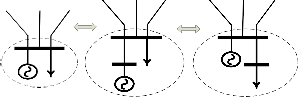
Fig.2 Representation of bus with both GENCO and DISCO at the same time.
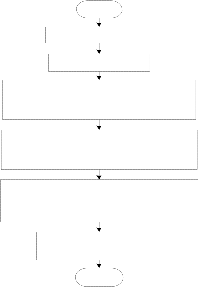
4. TRANSMISSION LOSS ALLOCATION ALGORITHM
In this section, a detailed algorithm for the transmission network loss allocation is presented:
Step 1: Read the system data (Nbus , Nline , NG , NL , ……….ets).
Step 2: Run load flow solution (Newton-Raphson). Calculate
total real power loss. Determine buses voltage, buses
current, branch current generator power, load power,
and lines flow.
Step 3: Determine the bus admittance matrix Ybus. Calculate
YGG, YGLYLG, YLL, and YGM,
Step 4: Construct branch to node incidence matrix (A),
determine, AG, and AL.
Step 5: To calculate the loads loss, set generator buses voltage
VG=0, then calculate load buses voltage (eq. 10) and
branches voltage (eq. 11).
Step 6: Determine the total branches currents due to loads
currents (eq. 13). Calculate load current distribution
factors matrix (eq. 14). Then calculate the contribution
of each load current in each branch current (eq. 15).
Step 7: Distributed the total branch loss between loads and
generators (eq. 16).
Step 8: Determine the contribution of each load in total loads
Set IL=0, then calculate IGO (eq. 19), VL(eq. 21), KBr,G (eq. 23), IBr,G (eq.
24), PBr,GT (eq. 25), PBr,G (eq. 26)
Locate transmission
Losses to each bus
Stop
Fig. 3. Flowchart for proposed technique.
5. APPLICATION AND RESULTS
In this section, the aptness of the proposed loss allocation approach is verified using two test systems. The first one is a six-bus system, and the second is the IEEE 30-bus system. The results are compared to the pro-rata (PR) method [5], proportional sharing (PS) [15], Z-Bus method [7]. and Cooperative Game Theory [25].
5.1 Six-Bus System
The modified 6-bus test system [11] shown in Fig. 4 is used to evaluate the proposed method. Data for the system are listed in tables 1and 2. Results of power flow solution are shown in Tables 3 and 4. Table 3 shows buses voltage and power, while Table 4 lists the power flows at both ends of each line, as well as the power loss in each line.

loss (eq. 18). 1 4 3
Step 9: To calculate the generators losses, set loads currents IL=0. Then repeat steps from 5 to 8 to determine the contribution of each generator in total generators losses (from eq. 19 to eq. 26).
Step 10: End.
6 5 2
Fig. 4. Six-bus test system.
TABLE 1
BUS DATA FOR SIX -BUS TEST SYSTEM
Bus no. | V (pu) | PG (MW) | P L (MW) | Q L (MVAR) |
1 | 1.05 | – | 0 | 0 |
2 | 1.1 | 60 | 0 | 0 |
3 | – | 0 | 55 | 13 |
IJSER © 2014 http://www.ijser.org
International Journal of Scientific & Engineering Research, Volume 5, Issue 12, December-2014 - 1346 - ISSN 2229-5518
TABLE 2
LINE DATA FOR SIX-BUS TEST SYSTEM
TABLE 3
BUSES VOLTAGE AND POWER OF THE TEST SYSTEM
Bus no. | V | δ | PG − PL | QG − QL |
1 | 1.0500 | 0.000 | 87.560 | 48.896 |
2 | 1.1000 | -0.428 | 60 | 28.335 |
3 | 0.9088 | -11.973 | −55 | −13 |
4 | 0.9316 | -8.881 | 0 | 0 |
5 | 0.8896 | -10.589 | −30 | −18 |
6 | 0.9078 | -11.159 | −50 | −10 |
TABLE 4
LINE FLOW DATA OF THE SIX-BUS TEST SYSTEM
Table 5 presents the transmission loss allocation components per bus for different methods. The results illustrate the difference between the previous methods and the proposed technique. in the previous methods (pro rata, proportional sharing, Z-Bus, and Cooperative Game Theory),a GENCOs bus is allocated the largest value of the losses (generator at bus 2).This makes these methods unsatisfactory for GENCOs. where he loaded the costs of generation part of this losses, and generation costs for this GENCOs in square form. Not only that, also increase the generation costs for these generators in quadratic form. The proposed method and pro rata method consider both generating and load independently. But the pro rata method does not consider the network configuration, and mainly dependent on the power at every bus. This is shown in terms of the bus 1, which has the highest power. It is loaded with largest value of the losses. The proposed technique allocates branches loss to different participants based on the circuit laws and the actual contribution of each participant to branches power losses.
Method
Bus No. Bus 1
Bus 2
Bus 3
Bus 4
Bus 5
Bus 6
Total
TABLE 5
TRANSMISSION LOSSES ALLOCATION FOR SIX-BUS SYSTEM WITH YSH
Pro-Rate Pro. sharing Z-Bus Game Theory Proposed
Method
Bus No.
Bus 1
Bus 2
Bus 3
Bus 4
Bus 5
Bus 6
Total
TABLE 6
TRANSMISSION LOSSES ALLOCATION FOR SIX-BUS SYSTEM WITHOUT YSH
Pro-Rate Pro. sharing Z-Bus Game Theory Proposed
proposed method indicate that, the generator or load can help in reducing the system losses. Therefore, negative allocation provides monetary incentives for generators and loads good- located in the network. In contrast, generators and loads poorly positioned in the network may have high participations to losses.
The negative losses allocation values provided by the
To show the effect of the transmission line model on the
IJSER © 2014 http://www.ijser.org
International Journal of Scientific & Engineering Research, Volume 5, Issue 12, December-2014 - 1347 - ISSN 2229-5518
proposed technique, the shunt admittance (Ysh ) of the lines is neglected and extra high shunt impedances are added at generator buses to overcome the floating system operation and avoid the possible numerical instability [40]. Table 6 displays the results obtained at this case. The results show that a significant change in the distribution of losses among buses occurs by other methods especially Z-Bus, and Cooperative Game Theory methods. This is deemed unreasonable. For the proposed technique, there is no change in the distribution of losses among DISCOs. Thus, the losses share of GENCOs is fixed. But the distribution of the losses among GENCOs changes only as expected. and became an equal proportion. Under no-load conditions, there are only two generators. One generator acts as a source while the other generator acts as a sink. Therefore, the transmission losses are distributed equally between them.
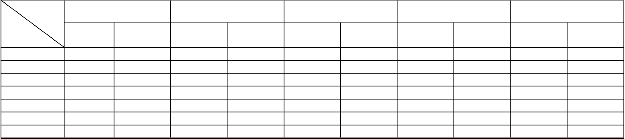
5.2 IEEE 30-Bus System
The IEEE 30-bus test system [30] is used to evaluate the proposed method. This system has 6 generators, 24 loads and
41 lines. Three buses (bus 2, 5, and 8) have both GENCO and DISCO on the same bus. Therefore, three new dummy buses (bus 2’, 5’, and 8’) are added to separate the GENCO from DISCO as discussed above. Comparative results of applying
the proposed method are shown in Table 7.
One advantage of the proposed method is that it depends
on the current contribution of each participant (generator or
load) to each transmission line power loss. Generally, the
distribution of losses among market participants is based on
either current flows or power flows. Using of power flow appears more appropriate as the specifications of the system buses are given in terms of power. However, the power flow is not constant along a transmission line. It decreases as power
losses occur in each unit length along the line. So, using sending end power, the receiving end power or an average value for transmission line loss allocation can be a problematic approximation. On the other hand, the commonly used model of the transmission lines is the π model. Therefore, the current flow in each line is constant along the line length. Moreover, the line capacity is defined in terms of current. This makes using the line current more appropriate for power loss allocation. Another advantage of the proposed technique is that there is no pre-defined assumptions (like slack bus selection in some methods and fixed power loss distribution ratios to GENCOs and DISCOs in other methods). It relies entirely on the physical model of the power system making the loss allocated to different market participants justifiable and fair.
TABLE 7

TRANSMISSION LOSSES ALLOCATION FOR IEEE 30-BUS SYSTEM
Method Bus No. | Pro-Rate | Pro. sharing | Z-Bus | Game Theory | Proposed |
Method Bus No. | Active (MW) | Reactive (MVAR) | Active (MW) | Reactive (MVAR) | Active (MW) | Reactive (MVAR) | Active (MW) | Reactive (MVAR) | Active (MW) | Reactive (MVAR) |
GENCOs | Bus 1 | 2.5088 | 0.9770 | 3.5589 | 6.8062 | 4.4212 | – | 4.4208 | 15.0163 | 2.1773 | 8.1814 |
GENCOs | Bus 2’ | 0.8993 | 0.9181 | 0.7927 | 3.0965 | 0.5786 | – | 0.5787 | 2.1936 | 1.9369 | 6.8044 |
GENCOs | Bus 5’ | 0.2275 | 3.6440 | 0.0005 | 1.1142 | -0.2853 | – | -0.2847 | - 1.0296 | 1.1146 | 3.6215 |
GENCOs | Bus 8’ | 0.3906 | 5.1994 | 0.0257 | 0.6498 | -0.1732 | – | -0.1724 | -0.5611 | 0.2074 | 0.768 |
GENCOs | Bus 11 | 0.2801 | 4.1408 | 0.0721 | 5.7101 | -0.1567 | – | -0.1562 | 1.6283 | 1.5338 | 8.3297 |
GENCOs | Bus 13 | 0.2642 | 5.0844 | 0.1207 | 6.9001 | 0.1627 | – | 0.1634 | 1.3914 | 0.3639 | 0.6403 |
DISCOs | Bus 2 | 0.3500 | 2.0090 | 0.1319 | 1.3166 | -0.215 | – | -0.2152 | - 0.8160 | 0.001 | -0.0008 |
DISCOs | Bus 3 | 0.3500 | 2.0090 | 0.0274 | 0.3384 | -0.0069 | – | -0.0069 | -0.0094 | 0.0072 | 0.0383 |
DISCOs | Bus 4 | 0.1226 | 0.2531 | 0.1127 | 0.4272 | 0.0308 | – | 0.0308 | 0.1076 | 0.0323 | 0.1127 |
DISCOs | Bus 5 | 1.5192 | 3.0056 | 1.7891 | 0.4600 | 2.1802 | – | 2.1797 | 7.8840 | 0.0027 | 0.0026 |
DISCOs | Bus 7 | 0.3677 | 1.7243 | 0.5276 | 2.0421 | 0.421 | – | 0.4208 | 1.4782 | 0.1412 | 0.5031 |
DISCOs | Bus 8 | 0.4838 | 4.7457 | 0.1331 | 0.5866 | 0.2482 | – | 0.2477 | 0.8179 | 0.0017 | 0.0001 |
DISCOs | Bus 10 | 0.0935 | 0.3164 | 0.0608 | 0.3556 | 0.0574 | – | 0.0574 | 0.5579 | 0.0329 | 0.4933 |
DISCOs | Bus 12 | 0.1806 | 1.1864 | 0.1054 | 0.4004 | -0.0109 | – | -0.0111 | 0.7225 | -0.01 | 0.6957 |
DISCOs | Bus 14 | 0.1000 | 0.2531 | 0.0929 | 0.1835 | 0.066 | – | 0.0659 | 0.5912 | 0.0496 | 0.468 |
DISCOs | Bus 15 | 0.1322 | 0.3955 | 0.1413 | 0.2807 | 0.1159 | – | 0.1159 | 0.8198 | 0.0951 | 0.678 |
DISCOs | Bus 16 | 0.0564 | 0.2847 | 0.0535 | 0.1505 | 0.0291 | – | 0.0291 | 0.3104 | 0.0217 | 0.2842 |
DISCOs | Bus 17 | 0.1451 | 0.9175 | 0.1337 | 0.7151 | 0.1106 | – | 0.1105 | 0.9058 | 0.0816 | 0.897 |
DISCOs | Bus 18 | 0.0516 | 0.1424 | 0.0691 | 0.1340 | 0.0663 | – | 0.0663 | 0.3725 | 0.0558 | 0.3201 |
DISCOs | Bus 19 | 0.1532 | 0.5378 | 0.1740 | 0.7081 | 0.2153 | – | 0.2152 | 1.1536 | 0.1826 | 1.0379 |
DISCOs | Bus 20 | 0.0355 | 0.1107 | 0.0325 | 0.1927 | 0.0435 | – | 0.0435 | 0.2563 | 0.0353 | 0.2269 |
DISCOs | Bus 21 | 0.2822 | 1.7717 | 0.2530 | 2.3323 | 0.3078 | – | 0.3075 | 1.9804 | 0.2485 | 1.9808 |
DISCOs | Bus 23 | 0.0516 | 0.2531 | 0.0727 | 0.2202 | 0.0681 | – | 0.0681 | 0.3697 | 0.0606 | 0.3432 |
DISCOs | Bus 24 | 0.1403 | 1.0599 | 0.1905 | 1.3140 | 0.2394 | – | 0.2392 | 1.1409 | 0.2166 | 1.1599 |
DISCOs | Bus 26 | 0.0564 | 0.3638 | 0.0942 | 1.4703 | 0.1309 | – | 0.1308 | 0.5386 | 0.1181 | 0.5128 |
DISCOs | Bus 29 | 0.0387 | 0.1424 | 0.0593 | 0.6651 | 0.0736 | – | 0.0736 | 0.3558 | 0.0631 | 0.3148 |
DISCOs | Bus 30 | 0.1710 | 0.3006 | 0.3161 | 1.3567 | 0.423 | – | 0.4230 | 1.7508 | 0.3695 | 1.5134 |
Total | 9.141 | 39.927 | 9.141 | 39.927 | 9.142 | – | 9.141 | 39.927 | 9.141 | 39.927 |
6. CONCLUSIONS
This paper presents analytical method for transmission power loss allocation in restructured power systems. It is based on circuit laws and the concept of the transmission
network usage. The current flow in each branch is divided into two components by using the superposition principle. The first one is due to the power transfer from generators to distribution companies (DISCOs) or loads. The second component is due to the voltage differences between
IJSER © 2014 http://www.ijser.org
International Journal of Scientific & Engineering Research, Volume 5, Issue 12, December-2014 - 1348 - ISSN 2229-5518
generation companies (GENCOs) buses. The responsibility of each load and generator to power losses in each branch of the network is derived analytically. The share of each load or generator in the overall transmission network losses is estimated accordingly. Since the proposed technique is based on direct circuit equations and power system matrices, it is computationally efficient. Besides, the proposed technique does not assume pre-defined power loss distribution ratios to GENCOs and DISCOs. It reflects the magnitude of current injected or consumed at a bus. It also reflects both the network topology and the voltage-current relationships. It can penalize or reward a market participant according to its effect on system energy loss. It is less sensitive to transmission line model and parameters changes. Hence, it is deemed to be fair and satisfactory loss allocation algorithm.
REFERENCES
[1] K. Bhattacharya, M. Bollen, and J. Daalder, Operation of Restructured Power
Systems, Kluwer Academic Publishers, Norwell, Massachusells, USA, 2001. [2] A. Ramani, and K. Baharin, “Transmission Losses Allocation in Deregulation
Electricity Market,” IEEE International Conf .Power and Energy, Kuala
Lumpur, Malaysia pp 841–845, 29 Nov -1 Dec. 2010.
[3] C. Unsihuay, and O. Saavedra, “Comparative Studies on Transmission Loss Allocation Methods for Competitive Electricity Markets,” IEEE Power Tech Conf., vol. 3, Bologna, 23-26 June 2003.
[4] S. Khalid, H. Shareef, M. Mustafa, A. Khairuddin, and A. Maungthan, “Evaluation of Real Power and Loss Contributions for Deregulated Environment,” Electrical Power and Energy Systems, vol. 38, no. 1, pp. 63–
71, June 2012.
[5] A. Conejo, J. Arroyo, N. Alguacil, and A. Guijarro, “Transmission Loss Allocation: A Comparison of Different Practical Algorithms,” IEEE Trans. Power Systems, vol. 17, no. 3, pp 571-576, Aug 2002
[6] N. Choudhury, and S. Goswami, “Artificial Intelligence Solution To
Transmission Loss Allocation Problem,” Expert Systems with Applications, vol. 38, no 4, pp 3757–3764, Apr. 2011.
[7] A. Conejo, F. Galiana, and I. Kockar, “Z-Bus Loss Allocation,” IEEE Trans on
Power Systems, vol. 16, no. 1, pp. 105–110, Feb. 2001.
[8] H. Wang, R. Liu, and W. Li, “Transmission Loss Allocation Based on Circuit Theories and Orthogonal Projection,” IEEE Trans on Power Systems, vol. 24, no. 2,pp. 868-877, May 2009.
[9] R Salgado, C. Moyano, and A. Medeiros, “Reviewing strategies for active power transmission loss allocation in power pools,” Electrical Power & Energy Systems, vol. 26, no. 2, pp 81–90, Feb. 2004.
[10] F. Galiana, A. Conejo, and I. Kockar, “Incremental Transmission Loss
Allocation under Pool Dispatch,” IEEE Trans on Power Systems, vol. 17, no.
1,pp. 26-33, Feb 2002.
[11] S. Abdelkader, “Transmission Loss Allocation in a Deregulated Energy
Market,” Elect. Power Syst. Res., vol. 76, no. 11, pp. 962–967, Jul. 2006.
[12] N. Choudhury, and S. Goswami, “Transmission Loss Allocation Using Combined Game Theory and Artificial Neural Network,” Electrical Power and Energy Systems, vol. no. 43, pp. 554–561, Dec. 2012.
[13] P. Satyaramesh, and C. RadhaKrishna, “Usage-Based Transmission Loss Allocation under Open Access in Deregulated Power Systems,” IET Gener. Transm. Distrib., vol. 4, no. 11, pp. 1261–1274, Nov. 2010.
[14] A. Parastar, B. Mozafari, A. Pirayesh, and H. Omidi, “Transmission Loss Allocation through Modified Z-Bus,” Energy Conversion and Management, vol. 52, no. 1, pp. 752–756, Jan. 2011.
[15] J. Bialek, “Tracing The Flow of Electricity,” IEE Proc—Gener. Transm.
Distrib., vol. 143, pp. 313–320, July 1996.
[16] J. Bialek, “Topological Generation and Load Distribution Factors for Supplement Charge Allocation in Transmission Open Access,” IEEE Trans. Power Systems, vol. 12, pp. 1185–1193, Aug. 1997.
[17] D. Kirschen, G. Strbac, “Tracing Active and Reactive Power between Generators and Loads Using Real and Imaginary Currents.” IEEE Trans. Power Systems, vol. 14, no. 4, pp. 1312–1319, Nov.1999.
[18] S. Abdelkader, D. Flynn, “A new method for transmission loss allocation considering the circulating currents between generators,” European Trans. Electrical Power, vol. 20, no. 8, pp.1177-1189, Nov. 2010.
[19] V.Disfani, F.Razavi, B. Kashanizadeh, and S. Dargahi, “Transmission Loss
Allocation of Bilateral Contracts Using Load Flow Permutations Average
Method,” IEEE Bucharest Power Tech Conf., Bucharest, Romania 28 June -2
July, 2009.
[20] F. Wu, Y. Ni, and P. Wei, “Power Transfer Allocation For Open Access Using Graph Theory - Fundamentals And Applications In Systems Without Loop Flow,” IEEE Trans. Power Systems, vol. 15 no. 3, pp. 923-929, Aug. 2000.
[21] S. Abdetkadcr, “Allocating Transmission Loss to Loads and Generators
through Complex Power Flow Tracing,” IET Gener. Trunsrn Distrib.,vol. 1, no. 4, pp. 584-595, Jul. 2007
[22] S. Abdelkader, “Transmission Loss Allocation Through Complex Power Flow Tracing,” IEEE Trans. Power Systems, vol. 22, no. 4, pp. 2240–2248, Nov. 2007.
[23] S. Abdelkader, “Efficient Computation Algorithm For Calculating Load Contributions To Line Flows And Losses,” IEE Proc—Gener. Transm. Distrib, vol. 153, no. 4, pp. 391–398, Jul. 2006.
[24] F. Schweppe, M. Caramanis, R. Tabors, and R. Bohn, Spot Pricing of
Electricity. Boston: Kluwer Academic Publishers, 1988.
[25] A. Rostamian, M. Hosseinzadeh, and A. Shokrollahi, “Transmission Loss Allocation in the Deregulated Electricity Market based on the Cooperative Game Theory,” The Journal of Mathematics and Computer Science, vol. 4 no.1, pp.81-92, May 2012
[26] A. Silva, and J. Costa, “Transmission Loss Allocation: Part 1–Single Energy Market,” IEEE Trans. Power Systems, vol.18, no. 4, pp. 1389–1394, Nov.2003.
[27] F. Galiana, and M. Phelan, “Allocation of Transmission Losses to Bilateral
Contracts in A Competitive Environment,” IEEE Trans. Power Systems, vol.
15, no. 1, pp. 143–150, Feb. 2000.
[28] T. Hann, J. Kim, and J. Park, “Calculation of Transmission Loss Factor
Considering Load Variation,” IEEE Power Eng. Soc. Meeting, vol. 3, pp.
1500–1503, Chicago, IL, USA, 25-25 July 2002.
[29] Q. Lu, and S. Brammer,, “Transmission loss penalty factors for area energy interchange’, IEEE Trans Power Systems, vol. 11, no.3, pp. 1387–1392, Aug.
1996.
[30] S. Abdelkader, D. Morrow, and A. Conejo, “Network Usage Determination Using A Transformer Analogy,” IET Gener. Transm. Distrib., vol. 8, no.1, pp. 81–90, Jan. 2014.
[31] J. Daniel, R. Salgado, and M. Irving, “Transmission Loss Allocation through A Modified Ybus,” IEE Proc—Gener. Trans. Distrib, vol. 152, no. 2, pp. 208–
214, Mar. 2005.
[32] Q. Ding and A. Abur, “Transmission Loss Allocation in a Multiple
Transaction Framework,” IEEE Trans on Power Systems, vol. 19, no. 1, pp.
214–220, Feb. 2004.
[33] S. Abdelkader, “Characterization of Transmission Losses” IEEE Trans on
Power Systems, vol. 26, no. 1, Feb. 2011.
[34] [34] Y. Molina, R. Prada, and O. Saavedra “Complex Losses Allocation to Generators and Loads Based on Circuit Theory and Aumann-Shapley Method,” IEEE Trans. Power Systems, vol. 25, no. 4, pp.1928-1936 Nov.
IJSER © 2014 http://www.ijser.org
International Journal of Scientific & Engineering Research, Volume 5, Issue 12, December-2014 - 1349 - ISSN 2229-5518
2010.
[35] K. Min, S. Ha, S. Lee, and Y. Moon, “Transmission Loss Allocation Algorithm Using Path-Integral Based on Transaction Strategy,” IEEE Trans. Power Systems, vol. 25, no. 1, pp. 195–205, Feb. 2010.
[36] S. Valerie, D. McDonald, and K. Tapan, “Development of a New Loss Allocation Method For A Hybrid Electricity Market Using Graph Theory,” Electr Power Syst Res., vol. 79, no. 2, pp. 301–310. Feb. 2009.
[37] N. Choudhury, M. De, and S. Goswami, “Transmission Loss Allocation in a
Power Market Using Artificial Neural Network,” Springer, Electr Eng, vol.95, no.2, pp87–98, Jun. 2013.
IJSER © 2014 http://www.ijser.org