International Journal of Scientific & Engineering Research, Volume 4, Issue 8, August-2013 177
ISSN 2229-5518
Transmission Congestion Management
Comparative Studies In Restructured Power
System
J.Srinivasa Rao, Faculty,
EEE Department,
QIS College of Engineering &Technology,Ongole. jsreee123@yahoo.co.in
Dr.J.Amarnath, Professor, Department of EEE,
JNTU College of Engineering,Hyderabad.
Amarnathjinka@yahoo.com
Abstract— The deregulated power system offers more benefits to the customers so that it is quite popular in now a days. Due to the enormous rise of power demand, the existing power system is operated very closer to its stability limits. So we get two major problems like transmission congestion and voltage instability problems in power system. These are very serious problems which causes severe damage to the total power system. Due to the congestion in the network, there is not always possi- ble to transmit the entire contracted power at all situations. The above mentioned problems are managed by using series FACTS devices. But for getting more benefits from these FACTS devices, we place those devices in optimal location. In this paper two different methodologies such as sensitivity approach and pricing approaches were going to be discussed to place the series FACTS devices in optimal location to manage the transmission congestion and voltage instability problems. These meth- ods are tested on modified IEEE 14 bus system.
Index Terms— Deregulated power system, congestion, Total VAR power losses, Thyristor Controlled Series capacitor (TCSC), Transmission Load Relief (TLR)
factors, Locational Marginal Pricing (LMP), Total Congestion Cost (TCC), Congestion Cost/Rent Contribution (CCC).
.
—————————— ——————————
The transmission network is a vital mechanism in competitive electricity markets. In present days all our basic needs are relates with electricity. Like the growth of population, the demand for electricity is also tremendously increases day to day. So there may be a need to enhance either the existing power system or establish the new system to supply the power to meet the particular load demands. The establishment of new power system is very costliest choice. So we mostly concentrate on the first choice that is enhanc- ing the existing power system. The main objective of the deregula- tion of a power industry is creating a competitive environment in between the power producers and prevents monopolies and also provides many choices to consumers to pick up a good utility. Due to the lack of coordination in between generation and transmission utilities, transmission congestion is occurs. So due to this transmis- sion congestion, there may not be possible to dispatch all contract- ed power transactions. The series FACTS device TCSC is placed in series with the line for congestion management. In [1], sensitivity approach is used to find the optimal location for placement of TCSC[6].The reduction of total system reactive power losses method is one used to find optimal location of FACTS devices [4-
5]. In this method, an over loaded sensitivity factor (power flow index) is used for optimal location of series FACTS device (i.e. TCSC) for static congestion management[7-8]. But for large sys- tems, this enumerative approach is not practical given to the large number of combinations that have to be exam. In [2], here conges- tion is managed by Transmission line relief (TLR) method used in deregulated power industry [3]. Moreover, as power flows influ-
In the new environment, it is essential to involve transmission tar- iffs in transmission pricing according to flow-based pricing and congestion-based pricing. A proper pricing scheme should allocate congestion charges to participants who cause congestion and should reward participants whose schedules tend to relieve conges- tion. In a competitive market, such an occurrence would cause different locational marginal prices (LMPs) between the two loca- tions [9]. If transmission losses are ignored, a difference in LMPs would appear when lines are congested. Congestion rent method and congestion rent contribution methods are also used to find the optimal location of placement of FACTS devices to alleviate con- gestion and as well as used to reduce congestion rents [10].
For static application like congestion management FACTS devices can be modelled as power injection model. The TCSC model shown as follows
Fig1. Modelling of TCSC
Let the complex voltage at bus i and bus j be denoted as Vi└ δi and Vj└ δj respectively. The expression for real and reactive power flows from bus i and j can be written as follows
ence transmission charges, transmission pricing may not only de-
c 2 ∆G
-V V (∆G Cosδ +∆B
Sin δ ) (1)
termine the right of entry but also encourage efficiencies in power
P ij = Vi
ij i j ij
ij ij ij
markets. During the last few years, different transmission pricing schemes have been proposed and implemented in various markets.
Qc ij =-Vi 2 (Bij +Bc )–V iVj (G ij Sinδ ij –Bij Cosδij ) (2)
Similarly, the real and reactive power flows from bus i to bus j can
IJSER © 2013 http://www.ijser.org
International Journal of Scientific & Engineering Research, Volume 4, Issue 8, August-2013 178
ISSN 2229-5518
be expressed as,![]()
Pic = Vi 2 ∆G ij -V iVj (∆Gij Cos δij + ∆Bij Sin δij ) (3) Pjc = Vj 2 ∆G ij -V iVj (∆Gij Cos δij + ∆Bij Sin δij ) (4) Qic = -V i 2∆B ij – V i Vj (∆G ij Sinδ ij – ∆Bij Cosδij ) (5) Qjc = -Vj 2∆B ij + Vi Vj (∆Gij Sinδij + ∆Bij Cosδij ) (6)
Where ∆ Gij =
tion method TCSC should be placed in a line having most positive loss sensitivity index
3.2. Load curtailment method based on TLR sensitivi- ties:
Transmission load relief sensitivities can be used for the purpose of
congestion alleviation by load curtailment. In the method of con- gestion alleviation using load curtailment, TLR sensitivities at all load buses for the most overloaded line is considered. The TLR sensitivity at a bus k for a congested line i-j is S ij k and is calculated by
& ∆ Bij = 
3 SELECTION OF BEST LOCATION FOR TCSC
![]()
Sij k= ![]() (9) The excess power flow on transmission line i-j is given by
(9) The excess power flow on transmission line i-j is given by
=![]() -
-![]() (10) Where P ij = actual power flow through transmission line i-j
(10) Where P ij = actual power flow through transmission line i-j
* = flow limit of transmission line i-j
PLACEMENT
The optimal location of FACTS devices is one of the important![]()
Pij
= change in load after curtailment at bus k
concepts. The main goal of the congestion management is to per- form a best utilization of the existing transmission lines.
3.1 Optimal placement of TCSC based on sensitivity approach
Based on sensitivity approach, we find the optimal location of TCSC for congestion management. The static conditions are con- sidering here for the placement of FACTS devices in the power system. The objectives for device placement may be one of the following:
1.Total system real power losses are reduced
2.The real power loss of a particular line is reduced
3.The total system reactive power losses are reduced
4.Maximum relief of congestion in the system
For the first three objectives, methods based on the sensitivity approach may be used. If the objective of FACTS device place- ment is to provide maximum relief of congestion, the devices may be placed in the most congested line or, alternatively, in locations determined by trail-and-error.
3.1.1 TOTAL SYSTEM VAR POWER LOSS
A method based on the sensitivity of the total system reactive pow- er loss with respect to the control variable of the TCSC.Net line series reactance (X ij ) for a TCSC placed between buses i and j,The reactive power loss sensitivity factors with respect to these control variables may be given as follows:
Loss sensitivity with respect to control parameter Xij of TCSC
placed between buses i and j,
aij =![]() (7) These factors can be computed for a base case power flow solu- tion. Consider a line connected between buses i and j and having a net series impedance of X ij , that includes the reactance of a TCSC, if present. The loss sensitivities with respect to X ij can be comput- ed as:
(7) These factors can be computed for a base case power flow solu- tion. Consider a line connected between buses i and j and having a net series impedance of X ij , that includes the reactance of a TCSC, if present. The loss sensitivities with respect to X ij can be comput- ed as:
aij =![]() =[Vi+Vj 2 –2Vi Vj Cos(δ i -δj )]
=[Vi+Vj 2 –2Vi Vj Cos(δ i -δj )]![]() (8)
(8)
With the sensitivity indices computed for TCSC following criteria can be used for its optimal placement.In reactive power loss reduc-
3.3. Pricing methods
3.3.1.locational marginal pricing (LMP) method: LMP is the marginal cost of supplying the increment of electric energy at a specific bus considering that generation marginal cost and the physical aspects of the transmission system. LMP is given as
LMP = Generation marginal cost + Congestion cost + Cost of marginal losses.
Mathematically, LMP at any node in the system is the dual variable
for the equality constraint at that node. Or, LMP is the additional cost for providing one additional MW at a certain node.
Using LMP, buyers and sellers experience the actual price of deliv- ering energy to locations on the transmission systems. The differ- ence in LMPs appears when lines are constrained. If the line flow constraints are not included in the optimization problem or if the line flow limits are assumed to be very large, LMPs will be the same for all buses, and this is the marginal cost of the most expen- sive dispatched generation unit (marginal unit). In this case, no congestion charges apply. However, if any line is constrained, LMPs will vary from bus or zone to bus or zone, which may cause possible congestion charges.
For finding the optimal location FACT device to manage conges- tion, the LMP difference method is one which makes the use of economic signal given by LMP. It is motivated from the fact that LMP contains significant information regarding level of congestion in the system. For a meshed system, generally loss component is neglected because it is small. Hence, the difference in LMP be- tween two buses gives direct hint regarding the level of congestion in that line.
The congested or over headed lines (i.e. line operating at a limit) have the highest LMP difference. The overloaded lines are not always the best location for the placement of series FACTS devic- es, a neighbourhood search method is required which will be taken care by formation of priority list.
Hence, in this method, a priority list is formed based on the magni- tude of the difference in LMPs. Priority list will essentially capture the congested lines as well as the neighbourhood lines that are linked to the congested lines through which the power can be di- verted when FACTS is placed. There are no specific rules for tak- ing the number of priorities. The number of lines to be considered for priority list depends on the size of the system. But however, it should be greater than the number of congested lines in the net-
IJSER © 2013 http://www.ijser.org
International Journal of Scientific & Engineering Research, Volume 4, Issue 8, August-2013 179
ISSN 2229-5518
work.
This LMP difference method had the benefit that is it
each line section. It can be performed relatively quickly and effi- ciently.
avoids the excessive computation and it directly founds the optimal location for placement of FACTS device from OPF result using priority list. Only few lines in the priority list need to examined in detail to access the best location. Since, these methods make use of economic signal given as LMP; it is easily applicable in the dereg- ulated electricity environments. This method presents the addition- al advantage, where historical LMP values can be used to analyze the best location and avoid risk associated with improper installa- tion.
3.3.2. Congestion rent method:
The LMP or spot price at each bus is location specific and differs by the congestion and loss components. If the transferring or retrieving of power at a particular bus increases the total system losses. Then cost of power at that particular location increases. Similarly, if any transmission line limit is binding, then corre- sponding µLij will be non- zero and will have effect on prices at all buses. If the transferring or extracting at a particular bus increase the flows across the congested interface, then LMP at that bus in- creases. For a case of real power spot price at bus i
Ρi = λ + λL,i + λC,i (11a) Similarly, for bus j, the LMP can be denoted as follows
ρj = λ + λL,j + λC,j (11b) Taking the LMP difference between two buses I and j.
Therefore ∆ ρ ij = (λL,i - λL,j )+ ( λ C,i - λC,j )
(12)
From the above equation says that the LMP or spot price difference between any two buses depend on the marginal losses and the con- gestion throughout the network. The price differential, by defini- tion gives the congestion rent. The surplus arises because genera- tors are compensated by LMP at the respective generator buses (which are generally low) and loads are charged by LMP at the respective load buses (which are generally high).
The calculation of total congestion rent is represented as follows
TCC = ![]() ∆ ρij P ij (13) Congestion rent contribution method is one of advanced method for managing congestion . In this method the percentage conges- tion contributed value is taken for priority list. The locational mar- ginal price difference method is very simple and its implementa- tion is also is easy. However, there can be a situation where a line of low rating is congested, that might lead to a large difference in LMP across that line. However, the effect in terms of congestion rent to the market participant due to such congested line may not be significant. The priority list formed by LMP difference alone may not capture the best possible location in such cases. So to make the method more reliable, a proposed method is modified with the smaller computations.
∆ ρij P ij (13) Congestion rent contribution method is one of advanced method for managing congestion . In this method the percentage conges- tion contributed value is taken for priority list. The locational mar- ginal price difference method is very simple and its implementa- tion is also is easy. However, there can be a situation where a line of low rating is congested, that might lead to a large difference in LMP across that line. However, the effect in terms of congestion rent to the market participant due to such congested line may not be significant. The priority list formed by LMP difference alone may not capture the best possible location in such cases. So to make the method more reliable, a proposed method is modified with the smaller computations.
In this new method, the LMP difference is multiplied by the power flow through the line, which is nothing but the congestion rent in the base case. This value can be divided by the total congestion rent. So this will be the congestion rent contribution value. There- fore, if the LMP difference is high but power flow is small, this line is not represented in the priority list and makes the analysis more accurate.
The priority ranking is purely based on the congestion rent contri-
bution of individual lines in the base case. If historical LMP values are used to find the best location for the placement of FACT devic- es, then additional calculation is needed for this refined method is just the load flow calculation to determine the power flow through
The formula for calculation of congestion rent of individual line section is as follows
CCij = ∆ ρij P ij (14)
The congestion rent contribution of individual line is written as
follows CCCij =![]() (15)
(15)
3.4. PROCEDURE
The procedure for calculation of LMP difference method and con- gestion rent contribution method is as follows:
Step 1: Firstly run the base case OPF to calculate the
power flow in all line sections and LMP values at all buses.
Step 2: Calculate the total congestion rent and the value of the objective function (i.e. total generation cost or total so- cial welfare) with the run OPF by placing TCSC in lines and with LMP values.
Step3: Calculate the absolute LMP difference value and arrange in descending order of magnitude to form priority list (for LMP difference method).
Step4: Calculate congestion rent contribution of individ- ual lines (using equations) using LMP values and power flows calculated in step 1 and total congestion rent calculated in step
2. Then arrange the values in descending order of magnitude to form priority list (for congestion rent contribution method).
Step5: The best location of TCSC is the one where by placing TCSC gives the minimum congestion cost or mini- mum value of the objective function (i.e. minimum generation cost or maximum social welfare). If the founded best location is in between two generator buses, then the next best location is selected.
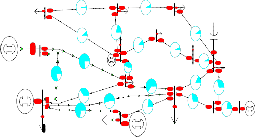
In this study the modified IEEE 14 bus system has been analysed for
congestion management by the optimal location of FACTS device such as TCSC using the power world simulator software based on sensitivity indices approach. Fig 2 indicates the single line diagram of modified IEEE 14 bus system. Fig 2 shows the transmission line flows without TCSC. It is observed that the line 1-2 is congested/overloaded compared to other lines. The percentage loadability values of modified IEEE 14 bus system is tabulated(Table.1) below. From the table 1, the
highest loadable line is 1-2. Due to the increased loading this line is congested. So by using TCSC, congestion is alleviated. For placing TCSC at optimal location we will use sensitivity analysis. The sensi- tivity indices table of modified IEEE 14 bus system is shown in below
IJSER © 2013 http://www.ijser.org
International Journal of Scientific & Engineering Research, Volume 4, Issue 8, August-2013 180
ISSN 2229-5518
6 MW
2 Mvar
A
2%
MVA
A
13 14 MW 8%
6 Mvar
A
14
4 MW
15 MW
5 Mvar
0.2 Mvar
A
A
9%
MVA
1
21%
MVA 11 MW
8 Mvar
A
12%
2 Mvar
11
A
9 MW 9%
6 Mvar MVA
slack
233 MW
-15 Mvar
A
MVA
A
71%
MVA
0 MW
22 Mvar
6
A
47%
MVA
5
MVA
8 MW
2 Mvar A
8%
MVA
A
10 5%
MVA 9
A
16% A
29 MW
17 Mvar
Table 2: Sensitivity index values
From the above table 2, the line 1-5 has the most positive sensitivity factor. So this is the best location for placement of TCSC to relieve
A
2 42%
MVA
A
56%
61%
MVA
A
MVA
4 A
28%
32%
MVA
A
congestion in the network. By placing the TCSC in line 1-5, the con- gestion in the network is relieved.
40 MW
26 Mvar
A
76%
MVA
94 MW
19 Mvar
MVA
3
24%
MVA
MVA
7 23% 8
MVA
6 MW
2 Mvar
2A%
MVA
8A%
13 14 MW
6 MMvVaAr
A
15 MW
14 5 Mvar
0.2 Mvar
22 MW
0 MW
0 MW
9A%
21%
4 MW
2 Mvar
9A%
13 Mvar
7 Mvar
48 MW
-4 Mvar
24 Mvar
slack 1
MVA
A
11 MW
MVA 8 MvaAr
12%
MVA
0 MW 6
9 MW
6 MvMaVrA
8A%
MVA A
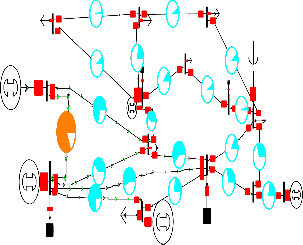
Fig 2: Modified IEEE 14 bus system without TCSC
232 MW
80A %
77%
MVA
21 Mvar
4A7%
10 4%
MVA 9
29 MW
17 Mvar
-15 Mvar
2
40 MW
MVA
39A %
MVA
74A %
MVA
54A %
MVA
3
94 MW
MVA
5
8 MW
2 MvaAr
64%
MVA
25A %
MVA
16A %
MVA
4
28A %
MVA
31A %
MVA
7 23A % 8
MVA
24 Mvar
22 MW
13 Mvar
19 Mvar
7 Mvar 48 MW
-4 Mvar
0 MW
4 Mvar
Fig 3: Modified IEEE 14 bus system with TCSC in line 1-5
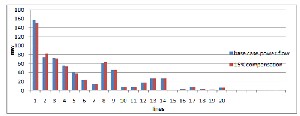
The fig 3 shows the transmission line flows with TCSC. It is ob- served that after placing TCSC the congestion in the network is relieved.The comparison of power flows of modified IEEE 14 bus system with and without TCSC is shown in fig-4. The comparison of voltage profiles of modified IEEE 14 bus system with and with- out TCSC is shown in fig-5.
Table1: OPF results without TCSC
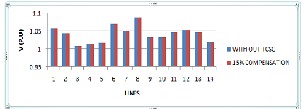
Fig 4: Comparison of power flows of modified IEEE 14 bus sys- tem with and without TCSC
Fig 5: Comparison of voltage profiles of modified IEEE 14 bus sys- tem with and without TCSC
This transmission load relief method is based on the load cur-
tailment. In this method of congestion management, TLR sensitivi-
ties at all the load buses for the most overloaded line are consid- ered.
The TLR sensitivity values of modified IEEE 14 bus system is
IJSER © 2013 http://www.ijser.org
International Journal of Scientific & Engineering Research, Volume 4, Issue 8, August-2013 181
ISSN 2229-5518
shown in table3.
Table3: TLR sensitivities
Table 5: Priority table based on OPF with TCSC for modified IEEE
14 bus systems
From the above table 5, the congestion rent values with placing of
TCSC at particular line are showed. Here we choosen10 best loca- tions for placing of TCSC. From the table the line 1[1-2] has high- er congestion rent. That means the line 1 is over loaded/ congested. So by placing the FACTS device, at that line congestion is going to be relieved. But over loaded lines are not always the best locations for placement of series FACTS devices. So by placing the FACTS device in line1 [1-2] is not so advantageous. So from the priority list we picked up the next location for placement of TCSC. Now by placing the TCSC in line 2[1-5], the congestion of the network
From the above table 3, the most positive sensitivity factor having the bus is bus3. So by doing the load curtailment on bus3 i.e. from
94.2 M.W to 83 M.W. Then the congestion of the line 1-2 is re- lieved from 84% to 79%. So by doing load curtailment based on TLR sensitivity method at bus3 the congestion is relieved ,shown in fig 6.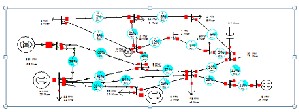
Fig 6: Congestion relief by load curtailment at bus 3
The proposed methodologies are tested on modified IEEE
14 bus system. The generator cost coefficients for modified IEEE
14 bus system is shown as follows
is relieved and also the total congestion cost is decreases from
136689.573(Rs/h) to 57752.52(Rs/h). So by placing TCSC in op- timal location, we got two benefits. One is congestion is relieved and another is congestion rent is reduced.
The priority list based on LMP difference table for modified IEEE
14 bus system is shown as follows
Priority number | LMP difference (Rs/MWH) | Priority location |
1 | 913.09 | LINE1:1-2 |
2 | 698 | LINE2:1-5 |
3 | 140.76 | LINE4:2-4 |
4 | 107.76 | LINE6:3-4 |
5 | 75.24 | LINE7:4-5 |
Table 6: Priority table based on LMP difference for modified IEEE 14 bus system
From the above table 6, shows the priority list based on LMP dif- ferences for placement TCSC in optimal location. The line 2[1-5] is best location for placement of TCSC for relieving congestion. It is the second priority in the LMP difference table. This proves the effectiveness of the LMP difference method. The LMP differences were reduced by placing the TCSC at optimal location using LMP difference method.
The priority list based on the congestion rent contribution method for modified IEEE 14 bus system is shown as follows
Table 4: Generator cost coefficients for modified IEEE 14 bus
System
These cost data is given to the generators and by using cubic cost model method, the system is analysed. The list of priority table based on OPF result with TCSC for modified IEEE 14 bus system is shown as follows
Table 7: Priority table based on congestion rent contribution for modified IEEE 14 bus system.
Table 7 shows that the result of congestion rent contribution meth-
od, where priority list is formed according to the contribution of
each line to total congestion rent. The congestion rent contribution table also reveals that the best location for placing TCSC is line
2[1-5]. This line 2[1-5] is the second priority in the congestion rent contribution table.
So these efficient proposed pricing methodologies give the best optimal location for placement of TCSC to relieves the congestion of the network and as well as reduces the congestion rents, loca- tional marginal prices.
In the environment of deregulated power system, congestion man- agement is the quite critical task. In this paper there are two differ-
IJSER © 2013 http://www.ijser.org
International Journal of Scientific & Engineering Research, Volume 4, Issue 8, August-2013 182
ISSN 2229-5518
ent approaches were proposed to predict the optimal location for placement of series FACTS devices such as TCSC to alleviate the congestion in the power system. Based on the total system VAR power loss and TLR sensitivity methods we found optimal location for placing of TCSC to manage the congestion. In pricing methods, we discussed about LMP difference, congestion rent and conges- tion rent contribution methods. These methods gave the priority list, so based on priority list we place the FACT device in proper location to manage the congestion in the power system. These pro- posed methods were successfully tested on modified IEEE 14 bus system and these pricing methods were correctly capture the best locations than sensitivity methods, for placing series FACTS de- vices to alleviate the congestion and also where the non-linearity associated with the systems too.
The authors are thankful to management of QIS College of Engi-
neering&Technology,JNTU Hyderabad&JNTU Anantapur for
providing facilities to publish this work.
[1]L.Rajalakshmi,M.V.Suganyadevi,S.Parameswari, “Congestion Management in Deregulated Power System by Locating Series FACTS Devices,” Interna- tional journal of Computer applications,Vol.13,pp 0975-8887,Jan2011.
[2] B.Likitha, J.Srinivasa Rao, J.Amarnath “Sensitivity Approach for Efficient Location of TCSC in a Deregulated Electricity Market,” IOSR Journal of Engi- neering, ISSN:2250-3021,Vol.2, pp 09-15,June 2012.
[3] A.R Abhyankar,Prof.S.A.Khaparde “Introduction to Deregulation in Power
Industry,” IIT Bombay.
[4] K.Vijayakumar, “Optimal location of FACTS Devices for Congestion Man- agement in Deregulated Power System,” International Journal of Computer Applications,Vol.16, pp.0975-8887,feb2011.
[5]J.Namaratha Manohar,Amarnath Jinka, V.Poornachandra Rao, “Optimization of Loss Minimization Using FACTS in Deregulated Power System,” Innovative System Design and Engineering,Vol.3,ISSN 2222-1727,2012.
[6] Mrinal Ranjan,B.Vedik, “Optimal Location of FACTS Devices in a Power System by Means of Sensitivity Analysis” Science Road Publishing Corpora- tion- Trends in Electrical and Computer Engineering TECE 1(1) 1-9,2011.
[7] Seyed Abbas Taher, Hadi Besharat “Transmission Congestion Management by Determining Optimal Location of FACTS Devices in Deregulated Power systems,” American Journal of Applied Sciences 5( 3):242-247, ISSN 1546-
9239, 2008.
[8] Harry Singh, Shangyou Hao, Alex Papalexopoulos, “Transmission Con- gestion Management in Competitive Electricity markets” IEEE Transactions on power systems,Vol.13,No.2,May 1998.
[9] Naresh Acharya, N.Mithulananthan, “Locating series FACTS devices for congestion management in deregulated markets” Electric Power systems re- search 77(2007) 352-360.
[10] Srinivasa Rao Pudi, S.C.Srivastava, “Optimal Placement of TCSC Based on A Sensitivity Approach for Congestion Management,” Fifteenth National Power System Conference, IIT Bombay, Dec2008
IJSER © 2013 http://www.ijser.org