International Journal of Scientific & Engineering Research, Volume 6, Issue 2, February-2015 1258
ISSN 2229-5518
Transportation Modeling of Farm Product Distribution: A Case Study of Maizube Farm, Minna, Nigeria
James I. Galadima, J. David, Obioma R. Nwaogbe, Victor Omoke, Ikechukwu A. Diugwu
Abstract—The major objective of this study is to determine an optimal way of transporting specified quantities products manufactured at Maizube Farms complex that minimizes the total transportation cost between the factory, the depots and various customer locations. W hile the analysis of data was done using the TORA software, the solution was based on the Vogel’s Approximation Method (VAM). The result of the analysis shows that the minimized transportation cost of a unit (a carton) of the products carton is N712,800.00, compared to the current cost N849,600.00; representing a 16.10% savings (or N136,800.00). The Management of Maizube Farms Limited is advised to adopt the routes used in this study in order to reduce the overhead (distribution) cost and boost its profit.
Index Terms— Cost, linear programming, logistics, maximization, minimization, supply chain, transport model.
—————————— ——————————
1 INTRODUCTION
here are indications that an efficient supply chain not only enhance the competiveness of organizations, but also pro- vides a very good opportunity to reduce the cost of goods
sold [1]. Different views have been expressed about what a supply chain is. While Towill et al. [2] describe it in terms of flow (distribution) of materials and information; others see it as comprising of dynamically managed networks of procure- ment and distribution [3], with a view to satisfying the needs of various the stakeholders [4].
According to [5], the integrating philosophy used in man- aging the total flow of a distribution channel from supplier to the ultimate customer is known as supply chain management (SCM). SCM is a principle that requires a coordinated man- agement of the flow of goods from suppliers to consumers, in a way that satisfies customer service objectives while minimis- ing inventory and related costs [6]. It is in this regard that SCM is seen as offering firms significant opportunities to cre- ate strategic advantage and achieve mutually beneficial per- formance outcome(s) ([7], [8], [9]). Although there are differ- ent elements of supply chain management through which this can be achieved, this paper shall, however, concentrate on the distribution (transportation) aspect of supply chain manage- ment.
The attainment of mutually beneficial performance out- comes in supply chains as noted earlier is achievable through the optimisation of management as well as operational pro- cesses of firms within the chain. Reed et al. [10] opine that contemporary supply chain optimisation models are rooted in classic operations research models with the aim of improving these models to include the new areas of interest in production
————————————————
• James I. Galadima & J. David (Department of Mathematics, Ibrahim
Badamosi University, Lapai, Niger State, Nigeria)
• Obioma R. Nwaogbe & Victor Omoke (Transport Management
Technology Dept., Federal Unive. of Technology, Minna, Nigeria)
• Ikechukwu A. Diugwu (Project Management Technology Depart- ment, Federal University of Technology, Minna, Nigeria)
(Corresponding Email: obioma.nwaogbe@futminna.edu.ng)
planning, purchasing and logistics. It is in this respect that operations research techniques are increasingly being applied in the optimisation of transportation options and choices with a view to reducing the total cost (in including environmental impact(s) of product(s) or services offered.
The implication of transportation options and choices on cost of product and services has been highlighted variously. While [10] highlight the influence of transportation cost on the final cost of the finished product, [11] note that mode of trans- portation contributes more to the logistical cost incurred in a supply chain than any other element. For instance, while [12] observes that transportation cost could be as much as a third of the operating cost of a supply chain, [13] believe that trans- portation cost is about 61.4% of all logistics cost. Therefore, if cost, according to [14] is a key performance measure in the management of a supply chain, then the transportation com- ponent of the supply chain must be effectively managed in order to enhance the overall performance of the supply chain [10]. Again, according to [13], product availability is a critical measure of the performance of logistics and the supply chain; and the supply chain being the lifeblood of the corporation , its efficiency and effectiveness in delivering products greatly impact on sales revenue [15].
In many organisations today, a major challenge confronting managers is how best to optimally allocate scarce resources to their various activities or projects. It is in this regard that some aspects of linear programming (LP) come handy. Mar- riott [16] describes LP as a schedule of actions used to maxim- ise or minimise a linear function of several variables when all, or some of these variables are subjected to constraints that are expressed in linear terms either as equations or inequalities.
Gupta and Hira [17] note that, generally, LP problems can be expressed either in a standard form as follows:
IJSER © 2015 http://www.ijser.org
International Journal of Scientific & Engineering Research, Volume 6, Issue 2, February-2015 1259
ISSN 2229-5518
𝑚𝑚
𝑀𝑀𝑀𝑀𝑀𝑀𝑀𝑀𝑀𝑀𝑀𝑀𝑀𝑀𝑀𝑀 (𝑜𝑜𝑜𝑜 𝑀𝑀𝑀𝑀𝑚𝑚𝑀𝑀𝑀𝑀𝑀𝑀𝑀𝑀𝑀𝑀)𝑍𝑍 = � 𝑐𝑐𝑗𝑗 𝑀𝑀𝑗𝑗 , (1)
𝑗𝑗 =1
The formulation of any transportation problem is predicat- ed on a clear indication of the quantity of a product that the plant can supply in a given period (i.e. capacities or supplies); the level or forecast of demand (or requirements); as well as
𝑀𝑀𝑠𝑠𝑠𝑠𝑗𝑗𝑀𝑀𝑐𝑐𝑠𝑠 𝑠𝑠𝑜𝑜 ∑𝑚𝑚
𝑀𝑀𝑀𝑀𝑗𝑗 𝑀𝑀𝑗𝑗 = 𝑠𝑠𝑀𝑀 , 𝑀𝑀 = 1, 2, 3, … , 𝑀𝑀,
𝑀𝑀𝑗𝑗 ≥ 0, 𝑗𝑗 = 1, 2, … , 𝑚𝑚,
unit cost (shipping and possibly production).
Existing works suggest that two types of transportation
problems – the balanced transportation problem and unbal-
𝑀𝑀𝑚𝑚𝑎𝑎 𝑠𝑠𝑀𝑀 ≥ 0.
or in a matrix-vector form,
anced transportation problem – exist. According to [20],
i) in a balanced transportation problem, the total supply equals total demand:
𝑀𝑀𝑀𝑀𝑀𝑀𝑀𝑀𝑀𝑀𝑀𝑀𝑀𝑀𝑀𝑀 (𝑜𝑜𝑜𝑜 𝑀𝑀𝑀𝑀𝑚𝑚𝑀𝑀𝑀𝑀𝑀𝑀𝑀𝑀𝑀𝑀)𝑍𝑍 = 𝑐𝑐𝑀𝑀,
𝑀𝑀
𝑚𝑚
𝑀𝑀𝑠𝑠𝑠𝑠𝑗𝑗𝑀𝑀𝑐𝑐𝑠𝑠 𝑠𝑠𝑜𝑜 𝐴𝐴𝑀𝑀 = 𝑠𝑠,
� 𝑆𝑀𝑀 = � 𝐷𝑗𝑗
𝑀𝑀 ≥ 0,
𝑀𝑀 =1
𝑗𝑗 =1
𝑠𝑠 ≥ 0,
An optimal solution to an LP problem is only possible if
carried out with certain requirements and assumptions ([18],
[17]) and could be achieved through several methods such as
ii) whereas in an unbalanced transportation problem, to- tal supply is not equal to total demand requirement
the Simplex method and Transportation Model [17]. Howev-
𝑀𝑀
𝑚𝑚
er, although the Simplex method could be applied to any LP
� 𝑆𝑀𝑀 ≠ � 𝐷𝑗𝑗
problem for which there exists a solution, computation using this method becomes more burdensome as the number of var-
𝑀𝑀 =1
𝑗𝑗 =1
iables and constraints increase; hence the preference for the distribution or transportation method or model [17].
2 TRANSPORTATON PROBLEMS
A transportation problem is a class of linear programming problems about networks, in which an attempt is made to minimize the cost of delivering integral quantities of goods produced at a given plant(s) to given outlets while balancing supply and demand [19]. The objective of the transportation model is to minimize the cost associated with the transporta- tion of goods from points of supply to a number of different destinations, in a way that satisfies destination requirement(s) within plant capacity limits [20]. Sivarethinamohan [20] notes that for a given supply (Si ), demand (Dj ), and cost (Cij ), a

When , a dummy destination is created to ab- sorb the excess supply; but if  , a dummy source is created to absorb the excess demand [20].
The solution to a linear programming problem using the transportation model or problem is guided by certain assump- tions. For instance, there are observations that a transporta- tion problem must satisfy the requirement condition (each source having a fixed supply of units, and each destination having a fixed demand for units); cost assumption which states that the cost of distributing a product from a source to a destination is directly proportional to the number of units dis- tributed; a feasibility solution property such that for a destina- tion (j), source (i), demand (d), supply (s) then,
transportation problem can be put in a standard form:
𝑀𝑀
𝑚𝑚
� 𝑀𝑀𝑀𝑀 = � 𝑎𝑎𝑗𝑗
𝑀𝑀
𝑚𝑚
𝑀𝑀 =1
𝑗𝑗 =1
𝑀𝑀𝑀𝑀𝑚𝑚𝑀𝑀𝑀𝑀𝑀𝑀𝑀𝑀𝑀𝑀: � � 𝑋𝑀𝑀𝑗𝑗 𝐶𝑀𝑀𝑗𝑗
𝑀𝑀 =1 𝑗𝑗 =1
𝑚𝑚
𝑀𝑀𝑠𝑠𝑠𝑠𝑗𝑗𝑀𝑀𝑐𝑐𝑠𝑠 𝑠𝑠𝑜𝑜: � 𝑋𝑀𝑀𝑗𝑗 ≤ 𝑆𝑀𝑀 𝑓𝑜𝑜𝑜𝑜 𝑀𝑀 = 1, 2, 3, … , 𝑀𝑀 (𝑀𝑀𝑠𝑠𝑠𝑠𝑠𝑠)
𝑀𝑀
� 𝑋𝑀𝑀𝑗𝑗 ≤ 𝐷𝑀𝑀 𝑓𝑜𝑜𝑜𝑜 𝑗𝑗 = 1, 2, 3, … , 𝑚𝑚 (𝑎𝑎𝑀𝑀𝑀𝑀𝑀𝑀𝑚𝑚𝑎𝑎)
𝑋𝑀𝑀𝑗𝑗 ≥ 0 𝑓𝑜𝑜𝑜𝑜 𝑀𝑀𝑠𝑠 𝑀𝑀 𝑀𝑀𝑚𝑚𝑎𝑎 𝑗𝑗
Si = a i = quantity of commodity available at origin, i  ; D i = bi = quanti-
ty of commodity needed at source, j; Cij = cost of transporting one unit of commodity from origin i to destination to destination j; X ij = cost of transporting one unit of commodity from origin i to destination to destination j
3 MATERIALS AND METHODS
3.1 Materials
Maizube Farms Limited produces yoghurt and fruit juice in
Minna, Niger State, Nigeria. Between August 2013 and July
2014, a total number of 144,000 cartons of yoghurt and 115,200
cartons of fruit juice were produced by the company. The av-
erage quantity of the products supplied to depots and ware-
houses are shown on Table 1, while Table 2 shows the quanti-
ties of the products demanded by customers.
IJSER © 2015 http://www.ijser.org
International Journal of Scientific & Engineering Research, Volume 6, Issue 2, February-2015 1260
ISSN 2229-5518
TABLE 1
QUANTITY SUPPLIED FROM FACTORY TO DEPOTS


S/N Quantity supplied (in cartons per year) Total

Depots Yoghurt Juice
1 Minna 7,200 7,200 14,400
2 Kaduna 8,640 5,760 14,400
3 Abuja (1) 4,800 4,800 9,600
4 Abuja (2) 11,520 7,680 19,200

Total 32,160 25,440 57,600
TABLE 2
QUANTITY DEMANDED BY CUSTOMERS FROM DEPOTS

S/N Quantity demanded (in cartons per year) Total


Customers Yoghurt Juice
1 Zungeru 960 960 1,920
2 Bida 480 720 1,200
3 Tunga 960 1,440 2,400
4 Central market 1,440 1,440 2,880
5 Sabo 1,440 960 2,400
6 Amigo 1,440 960 2,400
7 Next 1,920 960 2,880
8 Park & shop 1,200 1,200 2,400
9 Ceddi plaza 1,440 960 2,400
10 Grand square 1,440 1,440 2,880

Total 2,720 11,040 23,760
3.2 Method
Both primary and secondary data were used in the research. While the primary data was collected using questionnaires and interviews (face to face as well as through telephone con- versations), secondary data came from existing records about the company. The respondents were drawn from Maizube Farms as well as their customers (buyers) employees (supervi- sors, drivers, store keepers etc.) of the producing company as well as the buying companies.
The solution to a transportation problem could be found using methods such as the Least Cost Rule, North-West Cor- ner Rule, Simplex Method, Vogel’s Approximation Method among others. For instance, [21] used the least cost rule meth- od to determine the optimal allocation of shipments (least cost) of two manufactured products between depots and plac- es of consumption. For this study, the Vogel’s Approximation Method (VAM) has been chosen because its iterations are more effective and not bourgeois like others. This model de- termines the initial solution and a feasible solution which must satisfy all the supply and demand constraints, with a view to determining the optimal allocation of limited re- sources to meet given objectives. Tora software version 2.0 was used in the analysis.
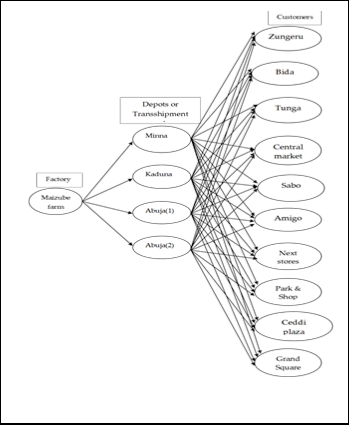
4 FORMULATION OF TRANSPORTATON MODEL
The transportation problem is shown schematically in Figure 1
below.
The cost of transporting a carton of product from the factory (source) to various depots and customers (destination) range between N10 and N172, as shown on Tables 3 and 4 below.
TABLE 3
TRANSPORTATION COST/CARTON FROM FACTORY TO DEPOTS (N)


Factory Depots

Maizube farm
Minna Kaduna Abuja (1) Abuja (2)
10 30 25 15
TABLE 4
TRANSPORTATION COSTS/CARTON FROM DEPOTS TO CUSTOMERS
(N)

Depots Zungeru Bida Tunga Central

market
Sabo Amigo Next
Stores
Park &
shop
Ceddi
plaza
Grand
square
Minna 25 80 20 20 84 86 71 84 84 70
Kaduna 105 168 84 20 20 60 50 48 48 40
Abuja (1) 107 172 86 50 60 40 30 60 60 50
Abuja (2) 105 168 84 40 48 60 50 24 25 20
Fig. 1. Maizube farm product distribution network

For the above distribution network, let the factory or source of
IJSER © 2015 http://www.ijser.org
International Journal of Scientific & Engineering Research, Volume 6, Issue 2, February-2015 1261
ISSN 2229-5518
supply i (i = 1, 2, 3……, m) produce ai units, and the destina- tion j (j = 1, 2, 3,….., n) require b j units. The cost of transporta- tion from factory i to warehouse j is Cij . The decision variable of this problem will be Xij , which is the transportation cost from factory i to warehouse j. Thus:
Xij = number of juice and yoghurt produced in a year i for ssupply in a year j
Cij = transportation cost associated with each unit of Xij
b j = number of scheduled for supply in a year j ai = production of juice and yoghurt in a year i
The general transportation problem is guven as:
4.1 Formulation of Maizube Farm Problem
The transportation problem stated in Section 4.0 above could be summarised in a transportation matrix as shown in Table 5 below.
TABLE 5

TRANSPORTATION MATRIX OF PRODUCT DISTRIBUTION
Objective Function
𝑀𝑀
𝑚𝑚
Subject to constraints
𝑀𝑀𝑀𝑀𝑚𝑚𝑀𝑀𝑀𝑀𝑀𝑀𝑀𝑀𝑀𝑀 𝑍𝑍 = � � 𝐶𝑀𝑀𝑗𝑗 𝑋𝑀𝑀𝑗𝑗
𝑀𝑀 =1 𝑗𝑗 =1
𝑚𝑚
� 𝑋𝑀𝑀𝑗𝑗 = ai, 𝑀𝑀 = 1, 2, . . . , 𝑀𝑀
𝑗𝑗 =1
𝑀𝑀
� 𝑋𝑀𝑀𝑗𝑗 = bj, 𝑗𝑗 = 1, 2, . . . , 𝑚𝑚
𝑀𝑀 =1
and Xij ≥ 0 for all i and j
Aggregating the information contained on Tables 1 to 5 above, the transportation problem could be specified as:
Z= Objective that minimized transportation cost;
a i = number of units being supplied by source i;
bj = number of units being received by destination j;
Cij = cost per unit distributed from source i to destination j; X ij = amount distributed from source i to destination j
Minimise Z = 10x11 +25x12 +80x13 +20x14 +20x15 +84x16 +86x17 +71x18 +84x19 +84x1,10 +70x1,11
30x21 +105x22 +168x23 +84x24 +20x25 +20x26 +60x27 +50x28 +48x29 +48x2,10 +40x2,11
25x31 +107x32 +172x33 +86x34 +50x35 +60x36 +40x17 +30x38 +60x39 +60x3,10 +50x3,11
15x41 +105x42 +168x43 +84x44 +40x45 +48x46 +60x47 +50x48 +24x49 +25x4,10 +20x4,11
Subject to:
Capacity constraints
x11 +x12 +x13 +x14 +x15 +x16 +x17 +x18 +x19 +x1,10 +x1,11≤14400 x21 +x22 +x23 +x24 +x25 +x26 +x27 +x28 +x29 +x2,10 +x2,11≤14400 x31 +x32 +x33 +x34 +x35 +x36 +x17 +x38 +x39 +x3,10 +x3,11≤9600 x41 +x42 +x43 +x44 +x45 +x46 +x47 +x48 +x49 +x4,10 +x4,11≤19200
Demand constraints
and
x11 +x21 +x31 +x41 =1920 x12 +x22 +x32 +x42 =1200 x13 +x23 +x33 +x43 =2400 x14 +x24 +x34 +x44 =2880 x15 +x25 +x35 +x45 =2400 x16 +x26 +x36 +x46 =2400 x17 +x27 +x37 +x47 =2880 x18 +x28 +x38 +x48 =2400 x19 +x29 +x39 +x49 =2400
x1,10 +x2,10 +x3,10 +x4,10=2800
x11 ,x12 ,x13 …x1,11 ≥0
IJSER © 2015 http://www.ijser.org
International Journal of Scientific & Engineering Research, Volume 6, Issue 2, February-2015 1262
ISSN 2229-5518
TABLE 6

TRANSPORTATION COST FROM DEPOTS TO CUSTOMERS (N)
4.2 Data Analysis
After three iterations (3) of the data using the Vogels approx- imation method, a transportation cost of N818,400.00 was got
Supply/
demand
Zungeru Bida Tunga Central
market

(Kaduna)
Sabo
(Kaduna)
Amigo
stores
Next stores Park &
Shop
Ceddi
plaza
Grand
square
supply
after the first iteration, N760,800.00 at the end of the second iteration 2 and N712,800.00 after the third iteration. The trans- portation model tableaus of these are presented on Tables 7, 8,
Minna 25 80 20 70 84 84 71 84 84 70 14,400
Kaduna 105 168 86 20 20 60 50 48 48 40 14,400
Abuja(1) 107 172 86 50 60 40 30 60 60 50 9,600
Abuja(2) 105 168 84 40 48 60 50 24 25 20 19,200

Demand 1,920 1,200 2,400 2,880 2,400 2,400 2,880 2,400 2,400 2,880 -
and 9 below, while the output summary of the iteration that yielded the minimum transported cost (N712,800.00) is shown on Table 10.
TABLE 7
TRANSPORTATION COST AFTER ITERATION 1
Names D1
Zungeru
v1=25.00
D2
Bida
v2=80.00
D3
Tunga
v3=20.00
D4
Central Market v4=40.00
D5
Sabo
v5=20.00
D6
Amigo
v6=60.00
D7
Next
Stores
v7=50.00
D8
Park & Shop
v8=24.00
D9
Ceddi Plaza v9=25.00
D10
Grand Square v10=20.00
D11
Dummy
v11=0.00
supply
S1 Minna u1=0.00 25.00
71.00
84.00
84.00
70.00
0.00
1920
0.00
S2 Kaduna u2=0.00 105.00
0.00
168.00
0.00
84.00
-30.00
20.00
-64.00
20.00
-26.00
50.00
-21.00
50.00
-60.00
48.00
-59.00
48.00
-50.00
40.00
8880
0.00
0.00
14400
-80.00
107.00
-88.00
172.00
-64.00
84.00
20.00
50.00
2400
0.00
60.00
10.00
40.00
0.00
80.00
-24.00
60.00
-23.00
60.00
-20.00
50.00
12000
0.00
0.00
14400
-82.00
-92.00
-64.00
-10.00
-40.00
20.00
-30.00
-36.00
-35.00
-30.00
9600
0.00
9600
0
0 19200
Total cost (Objective value) = ₦818,400.00
TABLE 8
TRANSPORTATION COST AFTER ITERATION 2
Names D1
Zungeru
v1=25.00
D2
Bida
v2=80.00
D3
Tunga
v3=20.00
D4
Central
Market
v4=20.00
D5
Sabo
v5=20.00
D6
Amigo
v6=60.00
D7
Next
Stores
v7=50.00
D8
Park &
Shop
v8=24.00
D9
Ceddi
v9=25.00
D10
Grand
Square
v10=20.00
D11
Dummy
v11=0.00
supply
S1 Minna u1=0.00 25.00
80.00
20.00
70.00
84.00
86.00
71.00
84.00
84.00
70.00
0.00
1920
0.00
S2 Kaduna u2=0.00 105.00
-80.00
S3 Abuja(1) u3=0.00 107.00
1200
0.00
168.00
-88.00
172.00
2400
0.00
84.00
-64.00
86.00
-50.00
20.00
2880
00.00
50.00
-64.00
20.00
2400
0.00
60.00
-21.00
50.00
10.00
40.00
-21.00
50.00
0.00
80.00
-60.00
48.00
-24.00
60.00
-59.00
48.00
-23.00
60.00
-50.00
40.00
-20.00
50.00
8880
0.00
0.00
9120
0.00
0.00
14400
14400
-82.00
S4 Abuja(2) u4=0.00 105.00
-80.00
-92.00
168.00
-88.00
-66.00
84.00
-64.00
-30.00
40.00
-20.00
-40.00
48.00
-28.00
20.00
60.00
2400
0.00
-30.00
50.00
2880
0.00
-36.00
24.00
2400
0.00
-35.00
25.00
2400
0.00
-30.00
20.00
2880
0.00
9600
0.00
0.00
6240
0.00
9600
19200
Demand 1920 1200 2400 2880 2400 2400 2880 2400 2400 2880 33840
Total cost (Objective value) = ₦760800.00
IJSER © 2015 http://www.ijser.org
International Journal of Scientific & Engineering Research, Volume 6, Issue 2, February-2015 1263
ISSN 2229-5518
TABLE 9
TRANSPORTATION COST AFTER ITERATION 3
Names D1
Zungeru
v1=25.00
D2
Bida
v2=80.00
D3
Tunga
v3=20.
00
D4
Central Market v4=20.00
D5
Sabo
v5=20.00
D6
Amigo
v6=40.00
D7
Next Stores v7=50.00
D8
Park & Shop v8=24.00
D9
Ceddi Plaza v9=25.00
D10
Grand Square v10=20.00
D11
Dummy
v11=0.00
supply
S1 Minna u1=0.00 25.00
80.00
20.00
70.00
84.00
86.00
71.00
84.00
84.00
70.00
0.00
| 1920 | 1200 | 2400 | | | | | | | | 8880 | 14400 |
| 0.00 | 0.00 | 0.00 | -50.00 | -64.00 | -46.00 | -21.00 | -60.00 | -59.00 | -50.00 | 0.00 | |
S2 | Kaduna | u2=0.00 | 105.00 | 168.00 | 84.00 | 20.00 | 20.00 | 50.00 | 50.00 | 48.00 | 48.00 | 40.00 | 0.00 | |
| | | | | | 2880 | 2400 | | | | | | 9120 | 14400 |
| | | -80.00 | -88.00 | -64.00 | 0.00 | 0.00 | -10.00 | 0.00 | -24.00 | -23.00 | -20.00 | 0.00 | |
S3 | Abuja(1) | u3=0.00 | 107.00 | 172.00 | 86.00 | 50.00 | 60.00 | 40.00 | 80.00 | 60.00 | 60.00 | 50.00 | 0.00 | |
| | | | | | | | 2400 | | | | | 7200 | 9600 |
| | | -82.00 | -92.00 | -66.00 | -30.00 | -40.00 | 0.00 | -30.00 | -36.00 | -35.00 | -30.00 | 0.00 | |
S4 | Abuja(2) | u4=0.00 | 105.00 | 168.00 | 84.00 | 40.00 | 48.00 | 60.00 | 50.00 | 24.00 | 25.00 | 20.00 | 0.00 | |
| | -80.00 | -88.00 | -64.00 | -20.00 | -28.00 | 2880 2400 2400 2880 8640 19200 -20.00 0.00 0.00 0.00 0.00 0.00 |
Demand | | 1920 | 1200 | 2400 | 2880 | 2400 | 2400 2880 2400 2400 2880 33840 |
Total cost (Objective value) = ₦712800.00
TABLE 10

LEAST RANSPORTATION COST OUTPUT SUMMARY
From To Quantity
Shipped

Objective Coefficient (N)
Objective Contribution (N)
S1: Minna D1: Zungeru 1920 25.00 48000.00
S1: Minna D2: Bida 1200 80.00 96000.00
S1: Minna D3: Tunga 2400 20.00 48000.00
S1: Minna D11: Dummy 8880 0.00 0.00
S2: Kaduna D4: Central Market 2880 20.00 57600.00
S2:Kaduna D5: Sabo 2400 20.00 48000.00
S2: Kaduna D11: Dummy 9120 0.00 0.00
S3: Abuja (1) D6: Amigo 2400 40.00 96000.00
S3: Abuja (1) D11: Dummy 7200 0.00 0.00
S4: Abuja (2) D7: Next Stores 2880 50.00 144000.00
S4: Abuja (2) D8: Park & Shop 2400 24.00 57600.00
S4: Abuja (2) D9: Ceddi Plaza 2400 25.00 60000.00
S4: Abuja (2) D10: Grand Square 2880 20.00 57600.00
S4: Abuja (2) D11: Dummy 8640 0.00 0.00

Total Minimum Cost 712800.00
IJSER © 2015 http://www.ijser.org
International Journal of Scientific & Engineering Research, Volume 6, Issue 2, February-2015 1264
ISSN 2229-5518
5 DISCUSSION OF RESULT
The information contained on Table 10 (the summary of the transportation model output) shows that the total minimal cost of transporting the product from the depots to the various
destinations is ₦712,800.00. From T abl e 9, it could be seen that
the depots have surpluses after supplying the quantity of
products demanded by the customers. For instance, Minna
depot has a surplus of 8,880 cartons of the product after sup-
plies; 9,120 cartons for Kaduna depot; 7,200 cartons for Abuja
(1) depot; 8,640 units for the Abuja (2) depot. Consequently, as
the demand from customers is less than the stocks, dummy
variables were introduced to balance the transportation model
of the factory. The result shown above is suggests that Minna
depot is the most cost-effective point for Zungeru, Bida and
Tunga customers.
From the results obtained, the minimized objective of the
overall transportation cost per carton of the products to the
depots and customers is N712,800.00 against an original trans-
portation cost of N849,600.00, thus saving Maizube Farms
about N 136,800.00 from transportation cost of their products.
6 CONCLUSION
The research explored the transportation model of optimiza- tion to solve the physical distribution problem of finished products from several depots (destination) in order to get a minimum cost (optimal) for distributing the products of the company. The transportation problem was formulated as a linear programming problem, and solved sing Tora 2.0 version software to obtain the optimal solution, using Vogel’s approx- imation method (VAM). Product distribution management from the factory to different destinations was studied to arrive at a certain result that would simultaneously increase the company’s profit and enhance the cost minimization approach. This was with a view to finding the optimal allocation in transporting two manufactured products from the factory to different destinations.
It is anticipated that the solution provided is necessary due to the high operating costs associated with physical distribu- tion when deliveries are not properly planned. Significantly, savings can be achieved by using techniques developed for determining the cheapest methods of transporting goods from several origins to different destinations. It is therefore recom- mended that the management of Maizube Farms Limited should integrate operation research techniques in their deci- sion making processes (including logistics and production processes). There is also a need to pay more attention to re- order levels in order to avoid surplus supplies which can lead to deficit in the future. There is equally a need for rational de- cisions on the transportation costs associated with each depot, using this outcome of this study as a guide.
REFERENCES
[1] V. Sehgal, Enterprise Supply Chain Management: Integrating Best in
Class Processes, Wiley, 2009.
[2] D.R. Towill, M.M. Naim, J. Wikner, Industrial dynamics simulation models in the design of supply chains. International Journal of Physical Distribution and Logistics Management 22 (1992) 3-13.
[3] J.L. Cavinato, A total cost/value model for supply chain competitiveness. Journal of Business Logistics 13 (1992) 285-301.
[4] D.M. Lambert, Developing a customer-focused logistics strategy. Asia
Pacific International Journal of Business Logistics 5 (1992) 12-19.
[5] L. Ellram, M.C. Cooper, Supply chain management, partnership and the shipper-third party relationship. The International Journal of Logistics Management 1 (1990) 1-10.
[6] J.R. Carter, B.G. Ferrin, C.R. Carter, The effect of less-than-truckload rates on the purchase order lot size decision. Transportation Journal 34 (1995) 35-44.
[7] R. Handfield, E. Nichols, Introduction to supply chain management, Prentice Hall, New Jersey, 1999.
[8] J.R. Stock, Editorial. International Journal of Physical Distribution and
Logistics Management 30 (2000) 729.
[9] H. Wen, Q. Gu, The Elements of Supply Chain Management in New Environmental Era, in: J. Xu, J.A. Fry, B. Lev, A. Hajiyev (Eds.), Proceedings of the Seventh International Conference on Management Science and Engineering Management, Springer Berlin Heidelberg, 2014, pp. 867-880.
[10] B.D. Reed, M.J. Smas, R.A. Rzepka, A.L. Guiffrida, Introducing Green Transportation Costs in Supply Chain Modeling, First Annual Kent State International Symposium on Green Supply Chains, Canton, Ohio, 2010, pp. 189-197.
[11] D.J. Bowersox, D.J. Closs, M.B. Cooper, Supply Chain Logisticn., 3rd
Edition, Management ed., McGraw-Hill/Irwin, Boston, 2010.
[12] A. Bhatnagar, Textbook of Supply Chain Management, Sanbun
Publishers, 2010.
[13] J.J. Coyle, J.E. Bardi, C. Langley, B. Gibson, R.A. Novack, Supply chain management: A logistics perspective, 8 ed., South-Western Publishing, Cengage, South-Western publishing, 2009.
[14] B.M. Beamon, Designing the green supply chain. Logistics
Information Management 12 (1999) 332-342.
[15] J.P. Dittman, R. Slone, J.T. Mentzer, Supply chain risk: It’s time to measure it, Havard Business Review, Havard Business Publishing, 2010.
[16] F.H.C. Marriott, Linear Programming, A Dictionary of Statistical Terms Longman Scientific & Technical (for International Statistical Institute), United Kingdom, 1990, pp. 223.
[17] P.K. Gupta, D.S. Hira, Operations Research, S. Chand and Company
Ltd, New Delhi, 2011.
[18] P. Chandra, Project Planning, Analysis, Selection, Financing, Implementation, and Review, Tata McGraw Hill Education Private Limited, New Delhi, 2009.
[19] Maplesoft, Definition, Transportation Problems, Waterloo Maple Inc, Waterloo (Ontario), Canada, 2014.
[20] R. Sivarethinamohan, Operations Research, McGraw-Hill Education
(India) Pvt Limited, India, 2008.
[21] O.R. Nwaogbe, V. Omoke, E.C. Ubani, S.I. Ukaegbu, Cost minimisation of product transhipment for physical distribution
IJSER © 2015 http://www.ijser.org
International Journal of Scientific & Engineering Research, Volume 6, Issue 2, February-2015 1265
ISSN 2229-5518
management : original research, 2013, pp. 1-9.
IJSER © 2015 http://www.ijser.org