poverty, high illiteracy rates, and a high prevalence of Guinea Worm.
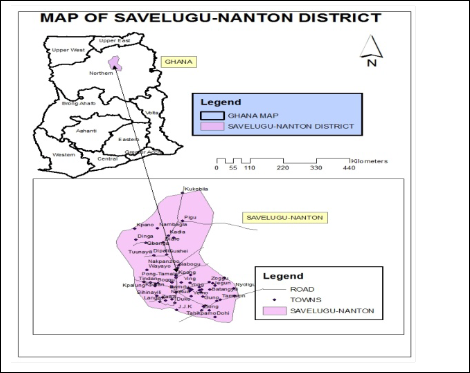
Fig 1: Map of Study Area
International Journal of Scientific & Engineering Research, Volume 4, Issue 9, September-2013 1001
ISSN 2229-5518
ABSTRACT
Dracunculiasis, or Guinea Worm Disease (GWD) is a disease of the poor, debilitating many in the most remote and disadvantaged communities in Sub-Saharan Africa, where access to potable water is limited and health care and education are either inadequate or lacking. About 75 per cent of reported guinea worm cases come from the Northern Region with Tolon-Kumbungu and Savelugu-Nanton Districts topping the list and pushing Ghana to second position in the world after Sudan. Inverse Distance Weighted approach was used to create disease risk maps to highlight the disease prevalence in space and time from 2005-2010 using Geographic Information Systems. Spatial autocorrelation analysis using Morans Index and point count statistics from the point maps was used to identify the spatial patterns as well as the trends in the disease prevalence. Two hundred and six (206) respondents were purposively selected from the low and high risk areas to ascertain their knowledge of the disease and its prevention. The risk surface and point maps produced showed that the Diare/Kadia zone was the most endemic area for the period 2005-2010. It also showed the reduction of the disease from 2008-2010 from 33% to 1%. Knowledge of the disease in the area is high and the programme mostly implemented in the communities is the provision of water filters. The maps highlighted the hot spot areas of the disease from the year 2005 to 2010. It showed a varied pattern of disease occurrence and considerable reduction from 2008-2010 due to improved safe water sources, education and effective eradication activities. The study also revealed a high awareness of the disease as of 2012 which strengthen the effort to curb the resurgence of the disease. Vigilant surveillance is still required until no Guinea worms remain anywhere in the district and Ghana at large.
Key Words: Guinea Worm, Eradication, Risk Maps, IDW and Point Count
Statistics
IJSER © 2013 http://www.ijser.org
International Journal of Scientific & Engineering Research, Volume 4, Issue 9, September-2013 1002
ISSN 2229-5518
1.0 INTRODUCTION
Guinea Worm disease (Dracunculiasis) is a painful, disabling disease of impoverished, rural villagers in 13 sub-Saharan African countries that do not have access to safe drinking water [1]. The risk of infection can be an alternating cycle if not well managed can be reintroduced by accidental or deliberate means [2]. Its effects results in absenteeism in schools, loss of productive working hours leading to impoverishment [3]. The disease is easily prevented through simple measures such as filtering of all drinking-water and educating infected people never to wade into water, which perpetuates the life-cycle of the disease [4].
In Ghana, cases of Guinea Worm disease dropped from 180,000 in 1989 to 4,000 in
1994, then rose to 8,290 in 2003 and then dropped to 3,981 cases in 2005 [5]. In 2006 about 75 per cent of reported guinea worm cases came from the Northern Region with Tolon-Kumbungu and Savelugu-Nanton Districts topping the list and pushing the country to second position in the world after Sudan [6].
Interestingly Ghana has not recorded any case since July, 2010. If this continues for the next three years, Ghana would be declared a free guinea worm zone leading the country to preparation towards certification [7].
Geographic Information System (GIS) has the ability to combine spatial data from many sources and has become a useful tool for analysing the spread of diseases as well as understanding high risk areas of disease [8].
The application of GIS and geo-statistical has proved equal to the task of exploring the disease occurrence and patterns through Point and surface maps spatio- temporarily [9]. The journey of the guinea worm eradication from 2005-2010 is explored using risk maps and depicts the pattern and progress of winning the war
against the disease in Savelugu-Nanton District Spatio-Temporarily .
IJSER © 2013 http://www.ijser.org
International Journal of Scientific & Engineering Research, Volume 4, Issue 9, September-2013 1003
ISSN 2229-5518
2.0 STUDY AREA
The study area is Savelugu-Nanton district which is one of eighteen administrative districts in the Northern Region of Ghana. The District shares boundaries with Tolon/Kumbugu District to the west, Tamale Municipality to the south and the Yendi District to the southeast. It has a total land area is 1790.70 sq. km. It has 149 local communities. Like all other districts in the Northern Region, it has high levels of
poverty, high illiteracy rates, and a high prevalence of Guinea Worm.
Fig 1: Map of Study Area
The guinea worm risk surface and point maps created covers the towns in the Savelugu -Nanton District for the period 2005–2010. Guinea worm incidence data and population at village level were obtained from the Guinea Worm surveillance Data Team in Tamale. Coordinates of the towns involved were obtained using the Global Positioning System (GPS). It was then transformed into a compatible Ghana-
grid system in Universal Traverse Mercator (UTM). The disease prevalence per the
IJSER © 2013 http://www.ijser.org
International Journal of Scientific & Engineering Research, Volume 4, Issue 9, September-2013 1004
ISSN 2229-5518
disease incidence data was obtained per 1000 people at the town level and all these data were incorporated into a geographic information system using Arc Map version for the spatial Analysis. Inverse Distance Weighted (IDW) approach was used to create the risk surface maps.
IDW interpolation is commonly used in GIS to create raster overlays from point data. Once the data are on a regular grid, contour lines can be threaded through the interpolated values and the map can be drawn as either a vector contour map or as a raster-shaded map [10]. The principle of IDW methods is to assign more weight to nearby points than to distant points based on the concept of Tobler’s First Law (the First Law of Geography) [11]. It was defined as everything is related to everything else, but near things are more related than distant things. As far as Guinea worm importation of disease is concerned close proximity of water sources to the settlements are more likely to be used however infested it is. The possibility of the disease importation nearby would be greater than very far areas because people prefer to draw water from nearer sources notwithstanding contamination. A point count statistics from the classified point maps was executed characterizing the areas into Low, Average and High risk areas using the proportion of the disease prevalence in a ratio 1:2:3. Two hundred and six (206) respondents from the high and low risk areas were purposively selected in 2012 to ascertain the eradication activities and the
knowledge of the disease that could halt any resurgence of the disease.
IJSER © 2013 http://www.ijser.org
International Journal of Scientific & Engineering Research, Volume 4, Issue 9, September-2013 1005
ISSN 2229-5518
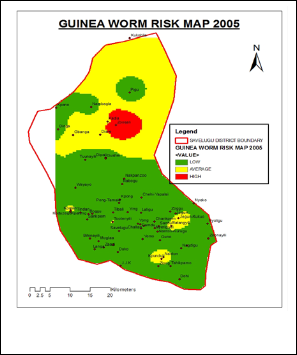
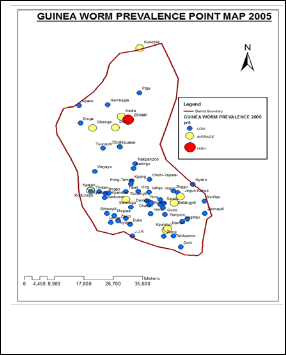
Fig 2.1: 2005 Surface Risk Map Fig 2.2: 2005 Point Risk Map
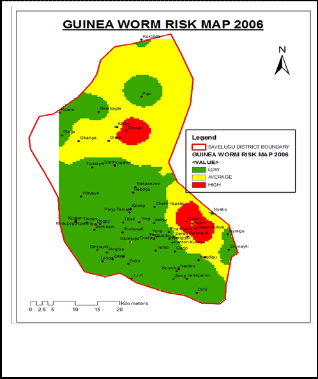
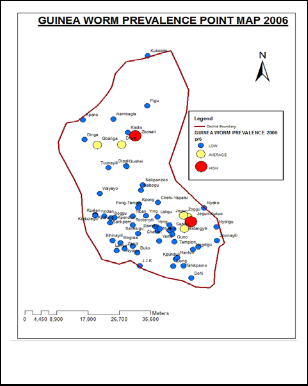
Fig 2.3:2006 Surface Risk Map Fig 2.4:2006 Point Risk Map
IJSER © 2013 http://www.ijser.org
International Journal of Scientific & Engineering Research, Volume 4, Issue 9, September-2013 1006
ISSN 2229-5518
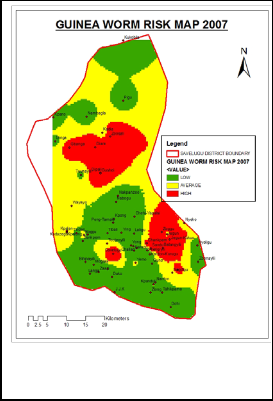
Fig 2.5: 2007Surface Risk Map
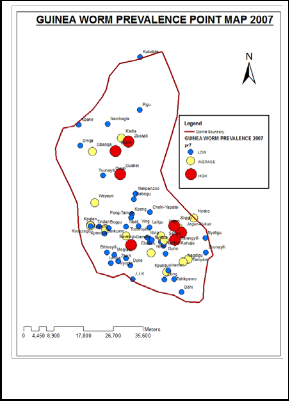
Fig 2.6: 2007 Point Risk Map
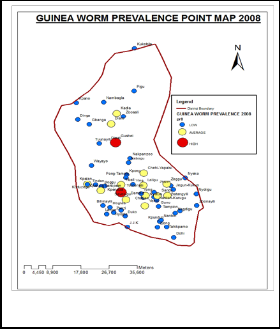
Fig 2.7:2008 Surface Risk Map
IJSER © 2013 http://www.ijser.org
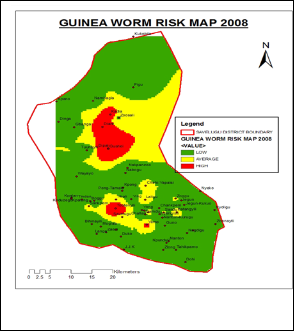
Fig 2.8: 2008 Point Risk Map
International Journal of Scientific & Engineering Research, Volume 4, Issue 9, September-2013 1007
ISSN 2229-5518
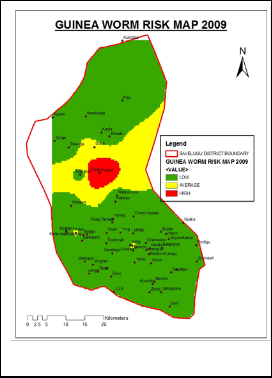
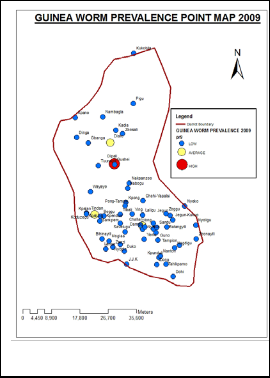
Fig 2.9: 2009 Surface Risk Map Fig 2.2: 2009 Point Risk Map
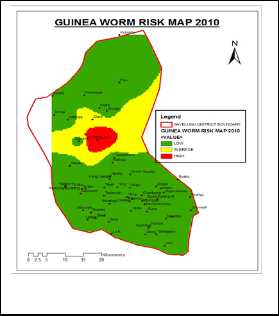
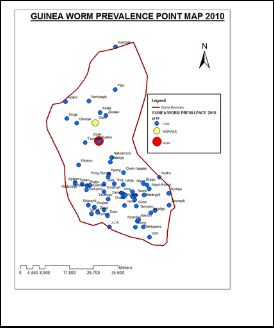
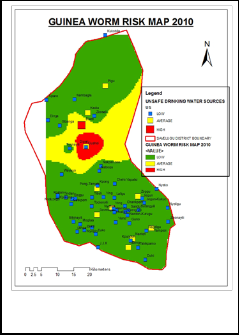
Fig 3.0: 2010 Surface Risk Map
Fig 3.1 :2010 Point Risk Map
IJSER © 2013 http://www.ijser.org
International Journal of Scientific & Engineering Research, Volume 4, Issue 9, September-2013 1008
ISSN 2229-5518
Fig 4.0: Unsafe Water Sources
5.0 RESULTS AND DISCUSSION
The guinea worm risk maps above highlighted the endemic and non-endemic communities from 2005 to 2010 in the figures in 4.0 results above. It shows the trend in the eradication process when the Carter Center and the Ministry of Health intensified their fight to eradicate the disease from 2005.
The maps showed that the Diare/Kadia zone was the most endemic area between
2005 and 2010 in the Savelugu-Nanton District. In 2005, a community around the Northern part of the District, the Diare zone, was identified as the hot spot area of guinea worm disease. Kadia and Diare in this zone were the endemic communities as a result of the people depending on ponds and dams for drinking water, and low eradication activities in those communities.
There was an increase in the disease prevalence in 2006 by 23%. This was consistent with the amount of disease clustering which showed an average Moran's Index of
IJSER © 2013 http://www.ijser.org
International Journal of Scientific & Engineering Research, Volume 4, Issue 9, September-2013 1009
ISSN 2229-5518
0.26 at a P-value<0.01 for the 2005 and 2006 disease Prevalence. The of lack of effective dam guides to prevent people with guinea worm to infect the water bodies may have escalated the disease as a result of high disease importation as evidenced by the spatial pattern showed even in 2007 .
However, from 2008 to 2010 the district experienced a reduction in cases reported through the years from 33% to 1%. This was due to the improvement and extension of the eradication activities such as provision of water filters, abatement of dams and case containment centres provision.
Gushei became the most endemic within the Diare zone in 2009 and 2010. This was as a result of drying up of wells and boreholes which compelled most of the people to depend on ponds and dams. However the district recorded a decrease in cases by 6% between 2009 and 2010.
The effectiveness of the dam guards adhering to the use of water filters proved their worth in most of the non-endemic communities. The interventions in the district such as the provision of water filters, abating of dams and drilling of more boreholes in the area proved effective by reducing the Guinea worm incidence especially in the central or middle areas of the district were the number of unsafe water sources was high as seen in Fig 4.0.
YEAR | LOW | AVERAGE | HIGH | TOTAL | |||
NUMBER | % | NUMBER | % | NUMBER | % | ||
2005 | 51 | 82% | 10 | 16% | 1 | 2% | 62 |
2006 | 55 | 89% | 5 | 8% | 2 | 3% | 62 |
2007 | 42 | 68% | 13 | 21% | 7 | 11% | 62 |
2008 | 47 | 76% | 13 | 21% | 2 | 3% | 62 |
2009 | 59 | 95% | 2 | 3% | 1 | 2% | 62 |
2010 | 60 | 97% | 1 | 1% | 1 | 1% | 62 |
IJSER © 2013 http://www.ijser.org
International Journal of Scientific & Engineering Research, Volume 4, Issue 9, September-2013 1010
ISSN 2229-5518
The point count statistics characterized form the point based maps showing Low, Average and High areas of the Guinea worm prevalence as indicated in Table 1.1 In
2005, there was a low disease prevalence later to rise by 11% in 2007 although there was a 60% reduction in the lower areas in the same year. Furthermore 2009 showed a reduction by 95% later to send the high risk area to 1% in 2010.This point count trend is consistent with the risk surface maps crated and the spatial pattern shown in the risk maps created.
Response | Frequency | Percentage |
Yes | 183 | 89 |
No | 23 | 11 |
Total | 206 | 100 |
The survey in Table 2.0 showed that eighty nine 89% of respondents had ample knowledge of Guinea worm disease. Most of the participants stated that Guinea worm disease is caused by the drinking of infested water. However, 11% cited cultural beliefs, superstition and the fact that it is a blood related disease amongst others. Health education has played a major impact in the elimination of the disease. Majority of the people know how to prevent themselves and family members from acquiring it. This is critical for the success of the intervention strategies as far as resurgence of the disease is concerned.
Activities | Frequency | Percentage |
Dam Guards | 27 | 13 |
Provision of Water Filters | 73 | 36 |
Case Containment Center | 44 | 21 |
IJSER © 2013 http://www.ijser.org
International Journal of Scientific & Engineering Research, Volume 4, Issue 9, September-2013 1011
ISSN 2229-5518
Abating of Dams | 39 | 19 |
Others | 23 | 11 |
Total | 206 | 100 |
The study revealed as in Table 3.0 that, the programme mostly implemented in the communities is the provision of water filters which represents 36% responses. Other eradication measures represent 11% which include provision of boreholes and wells, and most importantly health education, without which these other eradication measures would have failed.
6.0 CONCLUSION
The Guinea worm risk maps highlighted the endemic and non-endemic communities from 2005 to 2010. The maps have shown that the Diare/Kadia zone was the most endemic area between 2005 and 2010 in the Savelugu-Nanton District. It showed a varied pattern of disease occurrence and the considerable reduction from 2008-2010 due to improved safe water sources, education and effective eradication activities. The study also revealed a high awareness of the disease as of 2012 which strengthen the effort to curb the resurgence of the disease.
The Guinea worm disease in the Savelugu-Nanton District currently has been completely eradicated. The officials are currently actively monitoring and intensifying education on the disease. Monetary incentives have been promised to individuals who would report suspected cases of the disease in any part of the district.
7.0 REFERENCES
![]()
1. Greenaway C. (2004). Dracunculiasis (guinea worm disease). CMAJ.17;170(4):
495–500
2. Carter Center (2011): Three Countries Left in Guinea Worm Eradication Campaign: The Carter Center Waging Peace. Fighting Disease. Building Hope,http://www.cartercenter.org/news/pr/three-countries-guinea-worm-
eradication.html
IJSER © 2013 http://www.ijser.org
International Journal of Scientific & Engineering Research, Volume 4, Issue 9, September-2013 1012
ISSN 2229-5518
3. Cairncross S., Muller R., and Zagaria N., (2002). Dracunculiasis (Guinea Worm
Disease) and the Eradication Initiative. Clin Microbiol Rev, vol.15 no. 2: 223-46
4.Biswas G. (2011).WHO Dracunculiasis Eradication Program in Geneva, Switzerland. 11 March 2011 | Geneva
5. Ghana Health Service (2008). Ghana National Health Profile 2008, Country
Health Situation, Ghana Health Service, Accra.
6. Ghana News Agency (2011). Boost for Guinea Worm Eradication, http://lifestyle.myjoyonline.com/pages/health/200703/2613.php.
7. World Health Organization (2011). Dracunculiasis (guinea-worm disease), Fact sheet N°359 October 2011.
8. Brooker, S., and Utzinger, J. (2007). Integrated disease mapping in a polyparasitic world . Geospatial Health 2, pp. 141-146
9. Berke O. (2004). Exploratory Disease Mapping: Kriging the Spatial Risk Function from Regional Count Data. International Journal of Health Geographics, 3:18 .
10. Burrough, P.A. and Mcdonnell, R.A. (1998). Principles of geographical information systems. Clarendon press, Oxford, 346pp.
11. Tobler, W., and Weinberg S. (1971). A Cappadocian speculation. Nature 231 (5297): 39–42.
IJSER © 2013 http://www.ijser.org