processes take a larger fraction of the time period. If the tube is long, filling and purging take longer amounts of time and only low frequencies are possible. However, the tubes cannot be shorter than the distance it takes for DDT to occur (9).
International Journal of Scientific & Engineering Research Volume 4, Issue3, March-2013 1
ISSN 2229-5518
D Mahaboob Valli1, Dr. TK Jindal2
PhD scholar, PEC University of Technology 1
Assistant Professor, PEC University of Technology2
dmahaboobvalli@gmail.com
In this paper we present the result of measurement of thrust of single tube valve less Pulse detonation engine. The thrust generated by the repetitive detonation from a 48 mm inner diameter ,60 mm outer diameter and 70 cm length (various lengths of tube varies from 20 cm to 100 cm in the steps of 20 cm interval ) detonation tube was measured using load cell. Schelkin spiral was used an accelerator for the deflagration to detonation transition (DDT) phenomenon. Acetylene / Oxygen mixture was used as a combustible fuel air mixture for the pulse detonation engine. The amount of thrust was measured during the test reaching up to 280N. The test was done for single shot detonation only.
I. INTRODUCTION
Present days the attention of researchers in propulsion field from all over the world has turned towards Pulse Detonation Engine (PDE) as their main subject. These involve researches from United States, Russia, Japan and China, Germany, and Malaysia. Number of research publications Increased significantly in the past few decades. The main attraction of detonation combustion was it generates shock wave that is followed by combustion wave [4].The detonation has an advantage over deflagration as the former follows the constant volume combustion process. The Idea of PDE is to successfully repeat the detonation combustion in the tube at fast rate in order to achieve almost constant thrust generation. G. D. Roy [5] has mentioned that almost constant thrust is achieved by the detonation frequency of 100 Hz. The constant thrust generation was really important in propulsion applications. Pulse Detonation Engine works on the constant volume combustion process. Constant volume process has higher thermodynamic efficiency and release higher energy compared to constant pressure combustion (13). PDE eliminates the use of compressors, turbines and propellers thus offering massive weight reduction, cost reduction and reduce the complexity of the engine [6]. Even the design is very simple PDE still produce high power that is significant for the propulsion purposes. Detonation produces higher rate of energy release compared to the deflagration combustion. The rate of energy release in detonation mode normally in the magnitudes of three compare to the deflagration combustion [7]. The fact that contributes to the research is more towards the gaseous fuel rather than liquid fuels needs an additional system for PDE to evaporate the liquid fuel to gaseous state before it can be detonate. Liquid fuels however have advantages over the gaseous fuel as it best suitable for the volume-limited aerospace system and at high altitude applications [3]. Researchers also focusing on the ways to improve PDE system in order to achieve highest operation frequency using gaseous fuel [8]. In this research the focus is on the measurement of thrust by using load cell. The test was carried out at the Pulse detonation Engine test rig designed and developed by Research Team Faculty of Aerospace Engineering, PEC University
of Technology ,Chandigarh INDIA.
The Basic Operating requirement for any pulse detonation engine to run successfully that was needed to be considered what has been mentioned by Li Quiang.al [5] The first one was on the Detonation Initiation, which was the combustion occurs in the detonation tube is totally detonation at each repetition. Main constraint was on the Premature Ignition and Deflagration to Detonation (DDT) failure that can be leads to detonation combustion initiation failure [3, 8].
These two factors have to be eliminated in order to produce
constant detonation in the detonation tube. Compressed air is used as purge air during the purge stage. This air can also helps to reduce detonation tube temperature in order to avoid premature ignition of fresh fuel and oxidizer mixture that being injected into the tube during filling stage. This operation sequence of PDE was controlled by a control program that being programmed to control the time of opening, closing and duration of opening each devices. Duration of fuel and oxidizer opening was set to be open at the same time in one PDE cycle. The mixing of the fuel and
IJSER © 2013 http://www.ijser.org
International Journal of Scientific & Engineering Research Volume 4, Issue3, March-2013 2
ISSN 2229-5518
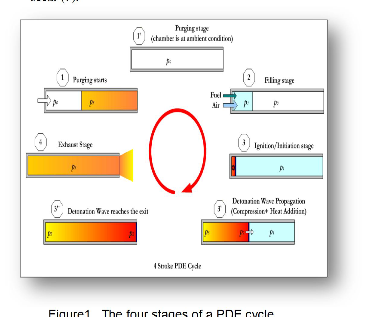
oxidizer was set to take place in the tube by the arrangement of the fuel and oxidizer injector locations. Before the filling stage end, the signal was sent to the ignition system to ignite the combustible mixture for the combustion initiations. At the end of the PDE cycle, the purge air was injected into the tube to purge the entire combustion product. Detonation can be initiated either by direct or deflagration to detonation transition (DDT) [3, 6]. Single tube valve less PDE implemented the use of low ignition energy in order to ignite the combustible mixture and therefore it requires a DDT enhancement device (Schelkin Spiral) to achieve detonation in the specific tube length. By using this method of initiation, it was claimed that the amount of specific impulse produce was equal to the direct initiation method [3]. The PDE cycle has four stages, namely fill, combustion, blow down (exhaust) and purge (15). The four stages are presented in Figure. The PDE combustion chamber is filled with fuel and oxidizer during the fill stage. The time taken for the filling is denoted as tf. When the fuel-oxidizer mixture is filled to the required volume, the combustion stage commences when a spark (arc or any other ignition initiator) is fired to start ignition. A detonation wave is soon created that moves through the mixture and causes the pressure and temperature behind it to rapidly shoot up. The time taken for the detonation wave to take shape and to move through to the end of the combustion chamber is denoted by tc. The next stage is the blow down stage, when a series of rarefaction waves travel upstream into the combustion chamber and reflect off the end wall, causing the high pressure burnt gases to exit the combustion chamber at a high speed. The time taken for the blow down stage is denoted by tb. This is then followed by the purge stage, when fresh air is blown through to clean and cool the tube before the fill stage starts again. The time taken for purging the tube with fresh air is denoted by tp. The purging process is very important as this cools the tube and prevents the fresh fuel oxidizer mixture from igniting due to residual heat on entry into the combustion chamber. It also protects
the structure of the tube from heat build up. The amount of
processes take a larger fraction of the time period. If the tube is long, filling and purging take longer amounts of time and only low frequencies are possible. However, the tubes cannot be shorter than the distance it takes for DDT to occur (9).
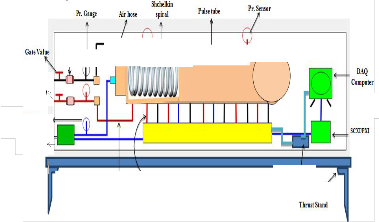
This section provides information specific to the equipment and techniques used to complete the experimentation performed in support of this work (figure 2). All testing associated with this project was done in the Aerospace Engineering Department of PEC University of Technology Chandigarh [1]. An engine capable of burning both Acetylene/oxygen and Acetylene/air mixture was required to complete the desired research. A PDE designed and used for previous experimentation was used as the baseline engine for this project [2]. A thrust stand was incorporated to measure axial thrust data, and new data acquisition software created for high-speed data capture.
time that the fuel-oxidizer mixture remains within the detonation tube is known as the residence time. At higher speeds, the residence time is very short, in the order of a few ms, and the combustion has to be initiated and advanced to detonation in as short as 1 to 5 ms. The total time period t of one cycle is the sum of all the four stages, namely,
t = t f + tc + tb + t p....... II- i
Gate
Value
Volt me te r
Magneto
Pr. Gauge
Air
Hose
Shchelkin
Spiral
Pulse tube
Pr. Sensor
FCS
DAQ Computer
SCXI/PXI
Chassis
The frequency of operation f is the inverse of the time period, measured in Hz. Thus reducing the period increases
Acetylene hose Thermocouple
Thrust Stand
the operational frequency. The filling and purging
Fig.2. Simplified schematic layout of system
IJSER © 2013 http://www.ijser.org
International Journal of Scientific & Engineering Research Volume 4, Issue3, March-2013 3
ISSN 2229-5518

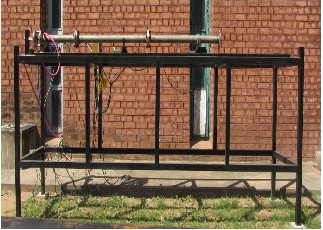
Fig.3. Pulse Detonation Engine PEC Setup
A single tube, “valve less” PDE is developed by the Research team conducting thesis research. The engine consists of a combustion tube, fuel injector system, and ignition system. Specific engine parameters and systems used during experimentation in support of this research are discussed below and photograph of the test rig is included in Fig. 3.
The fuel injection/air delivery system is the critical system of Single tube valve less pulse detonation engine. It is used to control the fuel/air mixture supplied to the combustor. Supply air delivery incorporated a valve less design in that a constant flow of supply air is provided to the engine. Control of the fuel mixture is achieved by varying the pressure of injected fuel.
V-{I} EQUIVALENCE RATIO:
φ = [(F/A) EM / (F/A) ST]
Where (F/A) EM is the mass ratio of fuel to air for the experimental mixture and (F/A) ST is the mass ratio of fuel to air for the stoichiometric mixture. Performance of pulse detonation engine varied with changing equivalence (φ) ratio. (10)
A. Oxygen/Air Delivery
Supply air is delivered from O2 cylinder at varying mass flow rates w.r.t. the pressure in the pipe line controlled by the valves in line. The supply is controlled by solenoid valve operated through Lab view software.
Fig.4. Fuel Injection/Air delivery system
B. Acetylene Injection
An independent injector system constructed to supply Acetylene from cylinder into the combustion chamber. Electrically- controlled high frequency Techno make solenoid valve injector is joined by a common feed manifold and mounted to the fuel arm downstream of the flow chokes. The gaseous fuel mixed with supply air prior to entry into the combustion chamber.
C. IGNITION SYSTEM
The ignition system consists of a 24 V DC Condenser and spark plug arrangement. The control for the spark plug ignition is with the control circuit only. The VI control gives an option to ignite the spark plug after the gas has been released into the system for the required amount of time.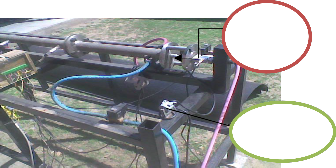
The oxygen inlet and the acetylene inlet are near the spark plug itself, which enables us to start the combustion, by imparting a high voltage spark to the gases.
Spark
Plug
Condenser
Fig.5. Ignition System Setup
D. Combustion Tube
The combustion tube is a hollow steel pipe (Grade 304) with an internal diameter of 48 mm and external diameter of 60 mm, providing us a thickness of 6 mm which is strong enough to withstand the detonation pressures generated inside the tube. The combustion tubes are of various sizes, 20 cm, 40 cm, 80 cm and
100 cm. These various sizes enable us to get any size tube for our
IJSER © 2013 http://www.ijser.org
International Journal of Scientific & Engineering Research Volume 4, Issue3, March-2013 4
ISSN 2229-5518
experiment in the steps of 20 cm with a minimum length of 70 cm.
E. Primary Structure
The primary structure comprises of the combustion tubes lying on the middle support bar. The combustion tubes are encapsulated in a curved wedge fitted on a slider, to reduce friction to the least amount possible. The fully loaded system with 3.5 m tube length has a friction of 17 N.
F. Load Cell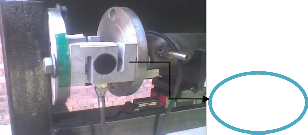
The load cells (Max Load Make) fitted in the structure are high capacity load cells with a maximum value of 500 kgf. The loads cells are fitted on the one extreme point of the structure on the axis of the tube, which allows us to measure the thrust produced on the system.
Load Cell
Fig.6. Load Cell
G. Data Collection Hardware
The data collection hardware comprises of 2 25 port boards, a low resistance cable of 16 metres length, a NI DAQ system, a USB carrier, 4 pressure sensors (MEAS make), 3 thermocouples,
3 load cells (Max load Make) (16).
H. Engine/Thrust Stand Interface
Thrust stand means the test rig fabricated that will support the entire engine on it. Engine is mounted on two bearings on the central longitudinal frame. Front side of the engine fitted with two load cells with flange and bolted to vertical member of the thrust stand and rear side of the engine kept open. 24 V Condenser is fitted on the lateral forward frame. The engine and Thrust stand covered with 1.5 feet curved cowl to prevent any mishaps to the people working nearby the structure.
I. Thrust Stand
The thrust stand is made of M.S. square tube 12 feet long, 3 feet wide, 4 feet high in dimensions,. The thrust stand is reinforced with the horizontal and vertical ribs for strengthening. The thrust stand is the mounting for the pulse detonation engine. Thrust stand is grouted on ground with RCC to protect against the
vibrations.
The first phase of the process consisted of calibration of the individual channels which transfer load cell data to the data collection system and convert voltage data to force units. Small imperfections in cable manufacturing, varying length of supply cable per channel, and other factors lead to small variances during the data transmission process which must be normalized to eliminate constant sources of bias error. This process was completed in conjunction with manufacturer representatives, with no load on the thrust stand and support pins installed. The first step was to install a load cell simulator in place of actual load cells, and apply excitation voltages at known excitation ranges.
The engine and support equipment in test cell #2 was controlled by a National Instruments (NI) Real-Time VI software program installed on a personal computer (PC) in the control room with terminations. The PC was linked to a NI PXI-1000B controller in the test cell through an internet connection to the PXI IP address. The program controlled engine operation by managing engine supply gas operation via ball valves located in the test cell. A BNC pulse generator also located in the control room controlled timing of trigger signals sent to both the fuel injectors and TPI via electrical relays located within the test cell. Also located within the control room were 24V DC and 220 VAC master power switches, and an emergency shutoff button. The electrical switches controlled electrical power within the cell for engine control and instrumentation equipment, such as temperature and pressure transducers connected through termination boxes (figure
7). The emergency shutoff button was provided as a safety
feature and would disable test cell #2 by closing all supply gas ball valves and interrupt fuel injection and ignition trigger signals.
IJSER © 2013 http://www.ijser.org
International Journal of Scientific & Engineering Research Volume 4, Issue3, March-2013 5
ISSN 2229-5518

data streamed to the control program GUI for real-time monitoring (12).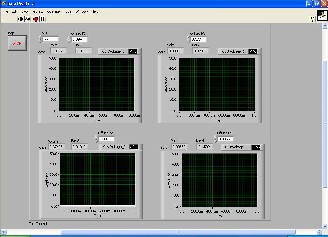
Fig.7. Test Cell Computer System Setup
Fig 9. DAQ data Console for pressure Transducers
PDE Sim ulation (Pr.) w ith 50 Hz filter
20
15
10
5 time in sec.
p1 Bar p2 Bar p3 Bar
p4 Bar
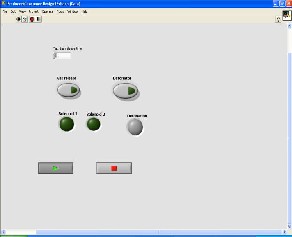
Fig.8. PDE Operation Control Console
VIII. DATA ACQUISITION
Data acquisition is controlled via the PC in the control room. The PC linked to the SCXI-1000B controller mounted on the wall in the test cell, which in turn linked to three NI data acquisition devices (DAQ) located on the engine stand. The PXI-6031E is
8channel, 16 bit card which collected operational parameters such as various engine temperatures and pressures, and supply gas pressures, at a rate of 10 kHz. A data file path designated on the control program directed data in the form of an excel spreadsheet to a selected location. These data streams were used to calibrate the stand prior to the commencement of testing, and record thrust data during engine operation. A second file path designated on the control panel directed thrust data in the form of
an excel spreadsheet to a selected location. Additionally, thrust
0
24 24.02 24.04 24.06 24.08 24.1 24.12 24.14 24.16 24.18 time in sec.
Fig 10. DAQ data of Pressure Transducers
The Single tube Valve less Pulse Detonation Engine Test Rig is the first such type of test rig designed and developed by the Research Team of Faculty of Aerospace Engineering Punjab Engineering College University of Technology Chandigarh, INDIA. The objective of research conducted is to experimentally measure the thrust profile of a PDE combusting both Acetylene and oxygen to incorporate an experimentally verified fuel mass flow rate to compute specific impulse values for both fuels at various firing rates. A significant effort was made to understand how to operate the engine and understand
IJSER © 2013 http://www.ijser.org
International Journal of Scientific & Engineering Research Volume 4, Issue3, March-2013 6
ISSN 2229-5518

fuelling, timing and ignition effects on engine operation. Several
months were spent conducting familiarization runs in preparation 40
35
for data collection events, during which time suitable fuel/timing 30
event profiles were established. As test firings began, it became 25
immediately obvious that the thrust stand is excited by 20
15
combustion events and masked the true thrust profile. At this 10
point, the objectives of this thesis evolved into designing an 5
analysis system capable of filtering undesired thrust stand 0
responses and returning accurate detonation thrust information. Additionally, system response varied with engine mounting techniques, which lead to an investigation into determining the optimal engine mounting design. A final objective of this research is to understand this phenomenon and assess its impact on the stand’s capability to accurately measure PDE thrust data.
Raw data from the experimental runs listed above displayed a
P1 P2 P3
largely sinusoidal output. Actual thrust profiles from a nominal PDE should display a series of impulse thrust spikes of positive forces at the operational frequency of the engine. An average thrust profile would then be obtained by integrating the area under the thrust curve.
The Aerospace Engineering Department of PEC University of Technology, Chandigarh independently designed filtering techniques to extract average thrust values from the raw data.
The results obtained from various test runs are analysed to draw the inferences. Comparative analysis is plotted below as desired.
The Consolidated results are shown below:
Fig12. Comparative study of Pressures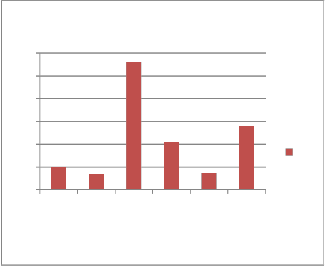
The thrusts obtained are cross plotterd for comparasion purposes:
300
250
200
150
100 T1
50
0
Fig.13. Comparative study of Thrust
Fig.11. Test results
The pressures obtained are cross plotterd for comparasion purposes in fig. 12:
X. FUTURE COURSE OF WORK
The PDE Test Rig designed and developed and Thrust for gaseous fuels C2H2& O2 had been measured successfully. Scope for Measuring of thrust of different types of gaseous fuels, and Comparison of thrust of different types of fuels .The Thrust can be optimised by changing the positions and capacity of spark Plug and Condenser. Fuel jets, input pressures manipulations, tube length / diameter optimisation, Schelkin Spiral (helical) length, change of position of igniters are the future key areas. Storage Oscilloscope, Accelerometers usage, better DAQ cards, and velocity & torque measurements can also be captured in due
course.
IJSER © 2013 http://www.ijser.org
International Journal of Scientific & Engineering Research Volume 4, Issue3, March-2013 7
ISSN 2229-5518
Authors are thankful to Director, PEC University of Technology and TBRL, Chandigarh for their support and guidance.
[1] TK Jindal, YS Chauhan, “Development of Pulse Detonation
Rig”, A Report on sponsored research by TBRL, June,
2012
[2] W.H. Heiser, D.T. Pratt, “Thermodynamic Cycle Analysis of Pulse Detonation Engines,” Journal of Propulsion and Power, Vol. 18, No. 5, 2002.
[3] M Z Ahmad Faiz, A W Mazlan Khalid Saqr and U Haffis “Single Pulse Detonation Study of natural gas “ International Conference on Theoretical and Applied Mechanics2010 (MECHANICS’10)and the international conference on Fluid Mechanics and Heat and Mass Transfer (2010)78-83
[4] G D Roy, S M Frolov,A A Borisov,D W Netzer,” Pulse Detonation Propulsion: Challenges, Current Status and Future Perspective” Progress in energy and Combustion Science30 (2004) 545-672
[5] Li Quioang ,Fan Wei, Yan Chaun-Jun, Hu Cheng-qi, Ye Bin “ Experimental Investigation on performance of Pulse detonation Rocket Engine Model” Chinese Journal of Aeronautics 20(2007) 09-14
[6] Wei Fan, ChaunJun Yan,Xiquo Huang,Qun Zhang, Nongxi
Zheng “Experimental Investigation on Two Phase Pulse
Detonation Engine”, Combustion and Flame133(2003)441-
450
[7] N Smirnov, Pulse detonation Engine Advantages and Limitations” Advanced Combustion and Aero thermal Technologies, 353-363.
[8] F K Lu, J M Mayer and D>R Wilson “Experimental study of a Pulse detonation rocket with schelkin Spiral” Aerodynamic Research Centre
[9] Philip Koshy Panicker “The development and testing of Pulsed Detonation Engine Ground Demonstrators” Doctoral Thesis ,University of Texas,Arlington,2008
[10] Brandy J Bartosh”, Thrust Measurement of Split Path Valve less Pulse Detonation Engine” Master’s Thesis, Naval Postgraduate School, Monterey, California, December 2007
[11] www.nasa.com
[12] www.ni.com
[13] www.wikipedia.com
[14] E. J. Touse, “Transmission of a Detonation Wave across a Sudden Expansion with varying Mixture Composition,” Master’s Thesis, Naval Postgraduate School, Monterey, California, December 2003. 95
[15] Pulse Detonation Engine Technology: An Overview by Matthew Lam, Daniel Tillie, Timothy Leaver, Brian McFadden
[16] www.meas.com

D Mahaboob Valli completed his Metric (SSC) from Board of secondary Education Hyderabad and secured State 9 th Rank in the year 1988. He completed his Diploma in Mechanical Engineering from State Board of Technical Education and Training from Hyderabad. Graduated in Bachelor of
Technology (B.Tech) in Mechanical Engineering from Jawaharlal Nehru Technological University (JNTU) Hyderabad. He had completed his Master of Technology (M.Tech) in Systems Engineering from DayalBagh Educational Institutes, Agra .He has also participated in many national conferences and seminars. He is currently perusing Ph. D. in Aero Space Engineering from PEC University of Technology, Chandigarh.

member of Institution of Engineers (India), Life member Indian Cryogenics Council, Life Member
IJSER © 2013 http://www.ijser.org
International Joumal of Scientific & Engineering Research Volume 4, Issue3, March-2013 8
ISSN 2229-5518
Aeronautical Society of India and Life member Solar Energy Society of India. He has participated in many national and International conferences and seminars.
IJSER ©2013