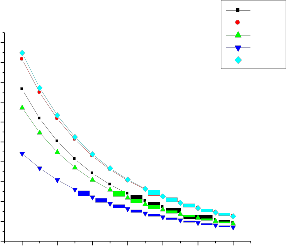
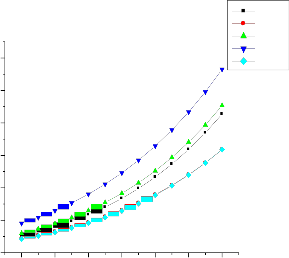
The specific volume of the refrigerant should be low in the vapour state. The figure 3.1 shows that the refrigerant R431A is having low specific volume in vapour state.
International Journal of Scientific & Engineering Research, Volume 3, Issue 10, October-2012 1
ISSN 2229-5518
Thermal analysis of vapour compression refrigeration system with R152a and its blends R429A, R430A, R431A and R435A
A.Baskaran, P.Koshy Mathews
—————————— ——————————
or the past half century, chlorofluorocarbons (CFCs) have been used extensively in the field of refrigeration due to their favorable characteristics. In particular, CFC12 has been predominantly used for small refriger-
ation units including domestic refrigerator/freezers. Since the advent of the Montreal Protocol, however, the refrigera- tion industry has been trying to find out the best substitutes for ozone depleting substances [1]. For the past decade, HFC134a has been used to replace CFC12 used in refrigera- tors and automobile air conditioners. HFC134a has such favorable characteristics as zero ozone depleting potential (ODP), non-flammability, stability, and similar vapor pres- sure to that of CFC12. A recent survey, however, showed that the performance of HFC134a in refrigerators with a proper compressor and lubricant is quite comparable to that of CFC12 [2]. In 1997 the Kyoto protocol was agreed by many nations calling for the reduction in emissions of greenhouse gases including HFCs [3].Since the Global warming potential (GWP) of HFC134a is relatively high (GWP1300)and also expensive, the production and use of HFC134a will be terminated in the near future. In an effort to reduce greenhouse gas emissions, R152a (difluoroethane) is being considered as a replacement for R134a. It has an average GWP of just 130, which in comparison has roughly ten times less GWP than R134a. B.O.Bolagi, M.A
.Akintunde, and T.O Falade investigated experimentally the performance of three ozone friends HFC refrigerants (R32, R134a and R152a) in a vapour compression refrigera- tor and compared the results obtained. The result shows that the COP of R152a was 2.5% higher than that of R134a and 14.7% higher than that of R32 [4]. Hydrocarbons are free from ozone depletion potential and have negligible
global warming potential. Wongwise et al (2006) presented an experimental study on the application of HC mixture to replace HFC -134a in automotive air-conditioner. They found that propane /butane/isobutene 50%/40%/10 % was the best alternative refrigerant to replace HFC-134a having the best performance of all other mixture being in- vestigated [5]. Wongwise and chimres presented an exper- imental study on the application of a mixture of propane, butane and isobutene to replace HFC134a in domestic re- frigerators. The results showed that a 60%/40% pro- pane/butane mixture was the most appropriate alternative refrigerant [6]. Dimethyl ether (RE170) makes a better re- frigerant than R290 / R600a blends as it has no temperature glide and doesn’t separate during leakage. It has been ex- tensively adopted by the aerosol industry as the most cost effective replacement for R134a in propellant applications. [7]. R432A(mixture of DME and propylene) is a good long term ‘drop-in’ environment friendly alternative refrigerant to replace CFC12 and HFC134a in automobile air- conditioners due to its excellent thermo dynamic and envi- ronment properties. Test results show that the COP of these refrigerants is up to 21.55 % higher than that of R12 in all temperature conditions [8] R435A(mixture of DME and R152a) is a good long term ‘drop-in’ environment friendly alternative safe refrigerant to replace HFC134a in domestic water purifiers due to its excellent thermo dynamic and environment properties . Test results show that the energy consumption and discharge temperature was 12.7% and
3.7°C lower than HFC 134a [9]. In this study, the thermal
analysis using the environment-friendly refrigerant R152a
and its blends with R290, R600a and RE170 (Di-methyl
Ether) were investigated. The composition of the Refriger-
IJSER © 2012
International Journal of Scientific & Engineering Research, Volume 3, Issue 10, October-2012 2
ISSN 2229-5518
ant blends are designated as R429A(R-152a-10%, RE-170-
60%, R-600a-30%), R430A (R152a-76%, R-600a-24%),
R431A(R-152a-29%, R-290-71%) and R435A(R-152a-20%,
RE-170-80%) The Thermodynamic properties and thermal performance of the above Refrigerants were compared with
R152a.
The software CYCLE_D 4.0 vapour compression cycle design program was used for the analysis to find the performance of the system. The ideal refrigeration cycle is considered with the following conditions.
System cooling capacity (kW) = 1.00
Compressor isentropic efficiency = 1.00
Evapora- tion(kJ/kg) At -100C |
The specific volume of the refrigerant should be low in the vapour state. The figure 3.1 shows that the refrigerant R431A is having low specific volume in vapour state.
R152a
R429A
Compressor volumetric efficiency = 1.00
Electric motor efficiency = 1.00
Pressure drop in suction line = 0.00
Pressure drop in the discharge line = 0.00
Evaporator: average sat.Temp. (0C) =-30 to +30
Condensor: average sat.Temp (0C) = 30, 40, 50
Super heat (0C) = 10
Sub cooling (0C) = 5
The analysis of the variation of physical properties
and performance parameters of R152 a and its blend refrig- erants such as evaporation pressure (Pevap), Pressure ratio
(PR), Refrigerating effect (RE), Compressor work (CW), Volumetric refrigeration capacity (VRC), Discharge tem- perature (TDis), Compressor power(CP), Condenser duty (CD), Mass flow rate (MFR) and Coefficient of performance (COP) are investigated in this theoretical study and they are plotted against the evaporating temperature (Tevap) as shown in figures from 1 to 10.
0.50
0.45
0.40
0.35
0.30
0.25
0.20
0.15
0.10
0.05
0.00
-30 -20 -10 0 10 20 30
EVAPORATION TEMPERATURE(0C)
Fig: 3.1 Variation of Vapour phase volume
R430A
R431A R435A
Table 1: Physical and Thermal Properties of Refrigerants
0.0019
0.0018
0.0017
0.0016
R152a R429A R430A R431A R435A
0.0015
0.0014
0.0013
0.0012
0.0011
0.0010
-30 -20 -10 0 10 20 30
EVAPORATION TEMPERATURE(0C)
Fig: 3.2 Variation of Liquid phase volume
IJSER © 2012
International Journal of Scientific & Engineering Research, Volume 3, Issue 10, October-2012 3
ISSN 2229-5518
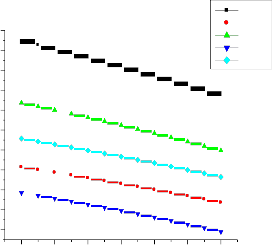
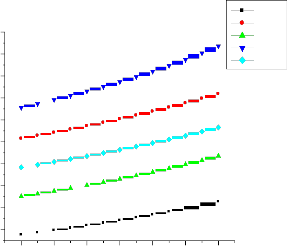
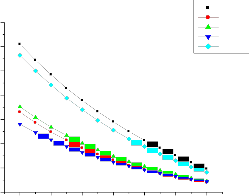
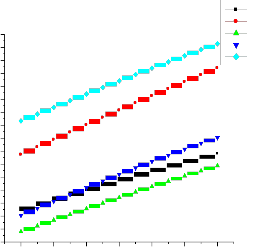
The figure 3.3 and 3.4 shows the variation of density of refrigerants in liquid and vapour phase. The vaue of liquid density decreases with increase in saturation temperature. The value of vapour density increases with increase in evaporation temperature. The refrigerant R431A has lower density at liquid phase. The refrigerant R435A has lower density at vapour phase.
R152a
the smaller will be the work of compression. The figure 3.5
& 3.6 shows that the refrigerant R435A is having smaller
value of index whereas R431A is having higher value.
Evaporating pressure should be just above the atmosphere pressure. If too low, it would result in a large volume of
suction vapour. If high, the condenser pressure and the overall pressure will be greater. A refrigerant should have low condensing pressure to avoid robust construction and to reduce the tendency of leakages. Figure 3.7 & 3.8 show that the refrigerants R152a, R429A and R435A are having
1050
1000
R429A
R431A
optimum values of pressure.
R152a
950
900
850
800
750
700
650
600
550
-30 -20 -10 0 10 20 30
EVAPORATION TEMPERATURE(0C)
Fig: 3.3 Variation of liquid phase density
1.66
1.65
1.64
1.63
1.62
1.61
1.60
1.59
1.57
1.56
1.55
1.54
1.53
1.52
1.51
1.50
-30 -20 -10 0 10 20 30
EVAPORATION TEMPERATURE(0C)
R430A R431A R435A
R152a R429A R430A R431A
30 R435A
25
20
15
1.65
1.60
1.55
1.50
Fig: 3.5 Variation of liquid index
R152a R429A R430A R431A R435A
10 1.45
1.40
5
1.35
0
-30 -20 -10 0 10 20 30
EVAPORATION TEMPERATURE(0C)
1.30
1.25
1.20
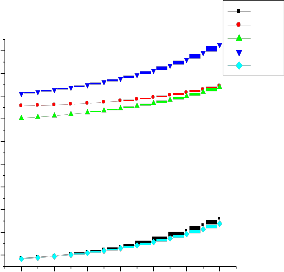
Fig: 3.4 Variation of Vapour phase density
The work of compression per unit mass
dpends on the isentropic index (γ). The smaller the index,
-30 -20 -10 0 10 20 30
Fig: 3.6 Variation of Vapour index
IJSER © 2012
International Journal of Scientific & Engineering Research, Volume 3, Issue 10, October-2012 4
ISSN 2229-5518
Evaporating pressure should be just above the atmosphere pressure. If too low, it would result in a large volume of suction vapour. If high, the condenser pressure and the overall pressure will be greater. A refrig- erant should have low condensing pressure to avoid robust construction and to reduce the tendency of leakages. Figure
3.7 & 3.8 show that the refrigerants R152a, R429A and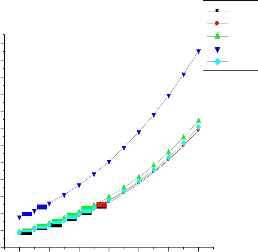
R435A are having optimum values of pressure.
R152a
R429A
Fig: 3.8 Variation of Vapour phase pressure

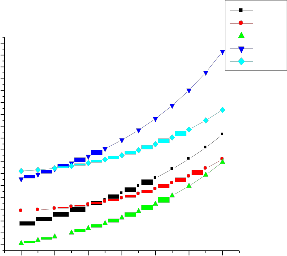
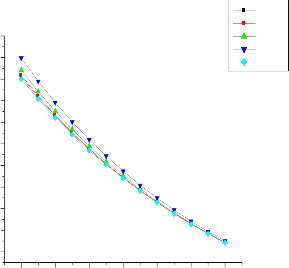
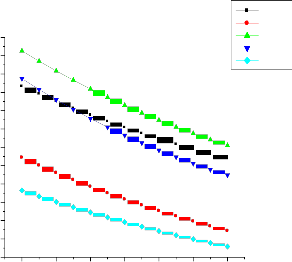
The figure 4.1 shows the variation of pressure ratio with varying evaporator temperature at 50°C condenser temper- ature for R-152a, R429A, R430A, R431A and R435A.The figure 4.1 shows that the pressure ratio decreases with in- crease in evaporator temperature . The pressure ratio re- quired for these refrigent blends at evaporating tempera- ture of -300C and 50C are lower than R152a. The trends are similar for condenser temperature 300C and 400C. Hence small size compressor will be required while using these blends.
1200
1100
1000
900
800
700
R430A R431A R435A
16
14
12
R152a R429A R430A R431A R435A
600
500
400
300
200
100
0
-30 -20 -10 0 10 20 30
EVAPORATION TEMPERATURE(0C)
Fig: 3.7 Variation of liquid phase pressure
10
8
6
4
2
0
-30 -20 -10 0 10 20 30
EVAPORATION TEMPERATURE (0C)
1200
1100
1000
900
800
700
600
R152a R429A R430A R431A R435A
8000
7000
6000
Fig: 4.1 Variation of Pressure Ratio at Tc=500C
R152a R429A R430A R431A R435A
500
400
5000
300
200
100
0
-30 -20 -10 0 10 20 30
EVAPORATION TEMPERATURE(0C)
IJSER © 2012
4000
3000
2000
1000
0

-30 -20 -10 0 10 20 30
International Journal of Scientific & Engineering Research, Volume 3, Issue 10, October-2012 5
ISSN 2229-5518
The figure 4.2 shows the variation of volumetric rfrigerating capacity with varying evaporator temperature at 50°C condenser temperature for R152a, R429A, R430A, R431A and R435A. The figures show that the volumetric refrigerating capacity increases with increase in evapora- tor temperature.TheVRCfor R429A at evaporating tempera- ture of -300C and 50C are lower than R152a and other blends have higher value. The trends are similar for con- denser temperature 300C and 400C. Hence smaller size compressor can be used for R430A, R431A and R435A.
Fig: 4.2 Variation of volumetric refrigeration capacity
Fig 4.3 shows the variation of COP with varying evaporator temperature at 50°C condenser temperature for R152a, R429A, R430A, R431A and R435A. The figure shows that the COP increases with increase in evaporator temper- ature. Results show that the COP for R435A at -300C evapo- rating temperature is 1.23% higher than R152a. At 50C evaporating temperature, the COP for R435A and R429A is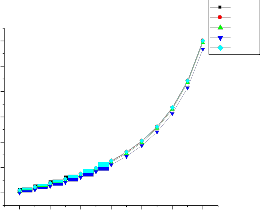
0.847% and 0.1925% higher than R152a respectively. The other blends have lesser COP than R152a at both condi- tions.
R152a R429A R430A
14 R431A R435A
12
10
show that discharge temperature decreases with increase in evaporator temperature. Results show that the discharge temperature decreases for all these refrigerant blends which means compressor life is increased while using these blends for substitute to R152a. The trends are similar for condenser temperature 300C and 400C.
Fig: 4.4 Variation of Discharge Temperature at Tc=500C
The figure 4.5 shows the variation of compressor power with varying evaporator temperature at 50°C con- denser temperature for R152a, R429A, R430A, R431A and R435A. The figures show that compressor power decreases with increase in evaporator temperature. Among the all refrigerant blends, R435A consumes less compressor power than R152a and all other blends consume more power. The trends are similar for condenser temperature 300C and
400C.
8
6
4
2
-30 -20 -10 0 10 20 30
EVAPORATION TEMPERATURE (0C)
Fig: 4.3 Variation of COP at Tc=500C
0.55
0.50
0.45
0.40
0.35
R152a R429A R430A R431A R435A
The figure 4.4 shows the varia-
R152a
tion
0.30
0.25
of 95
90
R429A
R430A R431A R435A
dis-
0.20
0.15
85 charge temperature with varying evap- orator temperature at 50°C conden- ser temperature for R152a, R
75 429A, R430A, R431A and
R435A. The figures
70
IJSER © 2012
0.10
0.05
-30 -20 -10 0 10 20 30
EVAPORATION TEMPERATURE (0C)
60
-30 -20 -10 0 10 20 30
EVAPORATION TEMPERATURE (0C)
International Journal of Scientific & Engineering Research, Volume 3, Issue 10, October-2012 6
ISSN 2229-5518
Fig: 4.5 Variation of Compressor Power at Tc=500C
The figure 4.6 shows the variation of refrigeration effect with varying evaporator temperature at
50°Ccondenser temperature for R152a, R429A, R430A, R431A and R435A.The figures show that refrigeration effect increases with increase in evaporator temperature. Results
20.761%, 7.576%, 30.477% higher than R152abut for R430A is 4.556% lower than R152a. At 50C evaporator temperature and condenser temperature 500C compressor work for R-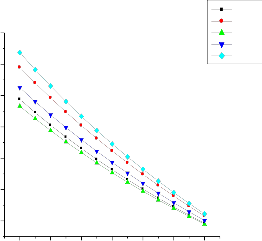
429A, R431A, R435Aare 23.032%, 8.950%, 31.335% higher than R152a but for R430A is 3.601% lower than R-152a which means less compressor work is required while using R430A for substitute to R152a. The trends are similar for condenser temperature 300C and 400C.
R152a
R429A
show that at condenser temperature 500C and evaporator temperature -300C refrigeration effect or R429A, R435A are
20.056%, 32.198 % higher than R152a but for R430A, R431A are7.639%, 1.764%lower than R152a. At 50C evaporator temperature and condenser temperature 500C refrigeration effect for R429A, R431A, R435Aare 23.286%, 2.582%,
32.470% higher than R152a but for R430A is 5.115% lower than R152a which means more refrigeration effect is ob- tained while using R435A for substitute to R152a. The trends are similar for condenser temperature 300C and
400C.
140
120
100
80
60
40
R430A
R431A R435A
20
-30 -20 -10 0 10 20 30
EVAPORATION TEMPERATURE (0C)
350
340
330
320
310
300
290
280
270
260
250
240
230
220
210
200
190
-30 -20 -10 0 10 20 30
EVAPORATION TEMPERATURE (0C)
R152a R429A R430A R431A R435A
Fig: 4.7 Variation of Compressor Work at Tc=500c
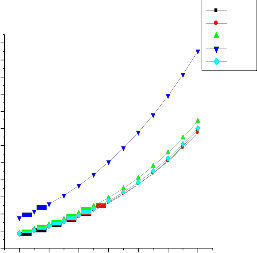
The figure 4.8 shows the variation of Condensor duty with varying evaporator temperature at 500C conden- ser temperature for R152a, R429A, R430A, R431A and R435A. The figures show that Condensor duty decreases with increase in evaporator temperature. Results show that at condenser temperature 500C and evaporator temperature
-300C Condensor duty for R429, R431A, R435A are 20.312 %
1.189 %, 31.697%, higher than R152a but for R430A is
6.646% lower than R152a. At 50C evaporator temperature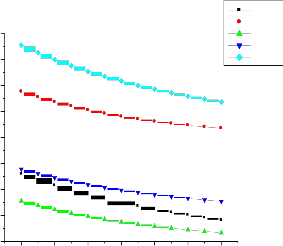
and condenser temperature 500C Condensor duty for
R152a
R429A
Fig: 4.6 Variation of Refrigeration Effect at Tc=500C
The figure 4.7 shows the variation of compressor work with varying evaporator temperature at 500C conden- ser temperature for R152a, R429A, R430A, R431A and R435A. The figures show that compressor work decreases with increase in evaporator temperature. Results show that at condenser temperature 500C and evaporator temperature
-300C compressor work for R429, R431A, R435A are
IJSER © 2012
420
400
380
360
340
320
300
280
260
-30 -20 -10 0 10 20 30
EVAPORATION TEMPERATURE (0C)
R430A R431A R435A
International Journal of Scientific & Engineering Research, Volume 3, Issue 10, October-250.212
ISSN 2229-5518
5.0
R152a R429A R430A R431A R435A
R429A, R431A, R435Aare 23.245%, 3.610%, 32.286% higher
than R152a but for R430A is 4.867% lower than R152a
which means more Condensor duty is required while using
R429A, R431A, R435A and less Condensor duty is required while using R430A for substitute to R152a. The trends are
4.8
4.6
4.4
4.2
similar for condenser temperature 300C and 400C. | 4.0 |
3.8 | |
Fig: 4.8 Variation of Condensor Duty at Tc=500C | 3.6 |
The figure 4.9 shows the variation of refrigerant mass flow with varying evaporator temperature at 500C condenser temperature for R152a, R429A, R430A, R431A
3.4
3.2
3.0
2.8
-30 -20 -10 0 10 20 30
0
and R435A. The figures show that refrigerant mass flow
decreases with increase in evaporator temperature. Results show that at condenser temperature 500C and evaporator
temperature -300C refrigerant mass flow for R430A, R431A are 8.274%, 1.798% higher than R152a but for R429A, R435A are 16.705%, 24.353% lower than R152a. At 50C evaporator temperature and condenser temperature 500C refrigerant mass flow for R430A is 5.388% higher than R152a but for R429A, R431A, R435A are 18.887%, 2.515%, 24.511% lower than R152a which means refrigerant mass flow is decreased while using R429A, R435A for substitute to R152a. The trends are similar for condenser temperature 300C and
400C.
Fig: 4.9 Variation of Refrigerant mass flow at Tc=500C
In present work the comparative performance analysis of R152a and its blends R429A, R430A, R431A and R435A have been discussed. The results obtained permit the following remarks:
Coefficient of Performance for R429A, R430A, R431A are 0.683%, 3.324% 8.789%lower and it is higher for R435A by 1.229% in comparison to R152a .
Pressure ratio required for R430A, R431A and
R435A are 10.098%, 31.869%, 7.409%
Lower than R152a. So thus the size of compressor
required for R152a is higher.
Volumetric Refrigerating capacity for R429A is
0.112% lower and 5.548%, 69.979% 7.398% higher
for R430A, R431A R435Ain comparison to R152a.
Hence, while using the above blends small size
compressor is sufficient.
Discharge temperature for R429A, R430A, R431A
and R435A are 15.469%, 14.254%, 18.232%, and
2.541% lower than R152a. Hence, compressor life is
increased while using above blends for substitute
to R152a.
Compressor power required for R429A, R430A,
R431A are 0.879%, 3.516 %, 9.67% higher and
1.098% lower for R435A. Hence, less compressor
power is required while using R435A for substitute
EVAPORATION TEMPERATURE ( C)
to R152a.
Refrigeration effect for R429A, R435A is 20.056%,
32.198 % higher and 7.639%, 1.764% lower for
R430A R431A .Hence, and more refrigeration effect
is obtained while using R-435A for substitute to R-
152a.
Compressor work for R429, R431A and R435A are
20.76%, 7.576 %, 30.477% higher and 4.556% lower
for R430A.Hence, less compressor work is required
while using R430A for substitute to R152a.
Condensor duty for R429, R431A, and R435A are
20.312 %, 1.189 %, 31.697% higher and 6.646% low-
er for R430A. Hence, less Condensor duty while
using R430A for substitute to R152a.
Refrigerant mass flows for R430A, R431A are
8.274%, 1.798% higher and 16.705%, 24.353% lower
for R429A, R435A. Hence, and refrigerant mass flow is decreased while using R429A, R435A for
substitute to R152a.
The work reported here was supported through the De- partment of Mechanical Engineering, P.A.College of Engi- neering and Technology, Pollachi-2.
[1] Anon.United Nation Environmental Programme. Montreal protocol on substances that deplete the ozone layer.FinalAct, 1987.
[2] Lim B. Private communication with a project engineer at the living Sys- tem Research and Development Center at Samsung Electronics Compa- ny, 1998.
[3] Anon. The Kyoto Protocol to the United Nation Fra-network Convention on Climate Change, December, 1997.
[4] B.O.Bolagi ,M.A .Akintunde, and T.O Falade , Comparitive analysis of performance of three ozone friends HFC refrigerants in a vapour Com- pression refrigerator ,journal of sustainable energy and environment 2 (2011) 61-64.
[5] S.Wongwises, A. Kamboon, B.Orachon , Experimental Investigation Of
Hydrocarbon Mixture to replace HFC-134a in an automotive air condi-
IJSER © 2012
International Journal of Scientific & Engineering Research, Volume 3, Issue 10, October-2012 8
ISSN 2229-5518
tioning system Energy conversion and management 46(2005)1644-1649.
[6] S. Wongwises, N.Chimres, Experimental study of hydrocarbon mixture to replace HFC134a in a domestic refrigerator. Energy conversion and man- agement 46(2005) 85-100.
[7] Nicholascox, Developments and opportunities using hydrocarbons re-
frigerant blends .Earth care products limited .www.earth care prod- ucts.co.uk.
[8] In cheol Back , ki –jung park ,Yun –Bo Shim , Dongsoo Jung, Performance of alternative refrigerants for R12 and R134a in automobile air condition- ers , Korean journal of air conditioning and refrigeration engineering vol.19.No 5(2007).
[9] Choedaeseong (Daeseongchoe) the world wide (yo-hanlee) Air-(Dangsoo Jung), Perfomance of R435A on refrigeration system of domestic water purifiers ,International Journal SAREK,vol 2010.No.11,(2010).
[10] P Srinivas, Dr AVSR Raju, Dr PS Babu, Comparative assessment of envi- ronment friendly alternatives to R12 and R134a in domestic refrigerators, IE(I)Journal- MC, Vol 92 (2011)
[11] REFPROP: Reference fluid thermodynamic and transport properties.
NIST Standard reference data base 23-version 7.1 Gaithersburg (MD) : Na- tional institute of standards and technology.
[12] CYCLE_D: vapour compression cycle design NIST Standard reference data base 23-version 4.0 Gaithersburg (MD): National institute of stand- ards and technology.
[13] T.Liancheng, G.Yunting “Thermodynamic performance analysis and test of refrigerator using R152a as Refrigerant”. International refrigeration and air conditioning conference .paper 129
[14] Mao-Gang He, Tie-Chen Li, Zhi-Gang Liu, Ying Zhang “Testing of mix- ing refrigerants HFC 152a/HFC125 in domestic refrigerator. Applied Thermal Engineering 25(2005) 1169-1181.
[15] BukolaOlalekanBolaji “Effects of sub cooling on the performance of R12 alternatives in a domestic refrigeration system”.Thammasat Int. J .Sc. Tech., vol.15, No.1 January – March 2010.
[16] J.M Calm and G.C Hourahan."Refrigerant data summary,”Engineered

Systems.18 (11): 74-88.
Mr. A. Baskaran
Assistant Professor
Department of Mechanical Engineering,
P.A.College of Engineering and Technology, Pollachi 642002, India
Email:boss120367@gmail.com
Dr. P. Koshy Mathews
Dean
Department of Mechanical Engineering,
Kalaivani College of Technology, Coimbatore 641105, India
Email:pkoshymathews@yahoo.co.in
IJSER © 2012