International Journal of Scientific & Engineering Research, Volume 5, Issue 7, July-2014 646
ISSN 2229-5518
The Relation of Combustion Phases and Emissions of ULSD & HFO in a Common-Rail HSDI Diesel Engine
Hayder A. Dhahad Mohammed A. Abdulhadi Ekhlas M. Alfayyadh T. Megaritis
Abstract— This study investigates the effect of combustion phase ( premixed and diffusion phases ) duration on the emissions emitted from a high speed direct injection (HSDI) diesel engine fueled with heavy fuel oil and run at a constant speed ( 1500 rpm ) with single injection strategy at constant fuel injection pressure (
1200 bar ) and varying fuel injection timings ( -12,-9,-6,-3,0 ) ATDC , for two loads( 2.5 and 5 bars ) BMEP . The obtained results were compared with those obtained
when the engine run at the same conditions but with ultra-low sulfur diesel fuel (ULSD). In-cylinder pressure was measured and analyzed using (LABVIWE) program. calculation program specially written in (MATLAB) software was used to extract the apparent heat release rate, the ignition delay, combustion duration and specify the amount of heat released during the premixed and diffusion combustion phases ( premixed burn fraction PMBF) and ( diffusion burn fraction DBF) . Emission measurements included; NO x , CO, THC and smoke number (SN). The results showed that ULSD generate higher NO x due to higher combustion temperature, while, HFO generate higher soot, CO and THC. Measurements and calculations indicated that ignition delay of ULSD was shorter than that of HFO, which means less PMBF. This conflicting effect is probably due to the advanced start of combustion (SOC) leading to higher combustion temperature inside the combustion chamber with ULSD and the difficulty of heavy fuel atomization and incomplete combustion of the heavy components for the heavy fuel .
1 Introduction
—————————— ——————————
(SN) and particulate matter (PM) were measured and are discussed in relation to the control parameters. In general
Heavy fuel oil (HFO) is a residue from the crude oil
refining process. It is so viscous that it has to be heated with a special heating system before use and it contains relatively high amounts of pollutants, particularly sulphur, which forms sulfur dioxide upon combustion [1]. Heavy fuel oil is used in marine main diesel engines, power plants and large diesel engines which are used for power generation. The fuel quality of HFO is quite important for smoke formation [2]. Higher sulphur, lower cetane number (CN) and higher fuel density give more smoke; aromatics and volatility have a slight increasing of smoke. Reducing fuel density lowers NOx and PM, but increases HC and CO [3].Sulphur is one of the most important fuel characteristic to address in order to reduce the emissions from diesel engines, contributing directly to PM emissions. High levels of sulphur in diesel fuel exclude the use of the most effective PM and NOx control technologies [4]. Soot formation studies [5] have shown that the diesel combustion soot is formed in the fuel-rich zone. Decreasing the fraction of the higher boiling point components in HFO linearly reduces particulate emissions. This indicates that fuel properties which determine fuel atomization or mixture formation are also important factors for formation of particulate emissions. It has been shown that nitrogen species compete with sulphur compounds to be adsorbed by diesel particulate matter (PM) before being emitted to the atmosphere [2].
Sarvi and Zevenhoven [1] investigated the emission of a large-scale medium-speed supercharged diesel engine.Emissions of NOx , CO, hydrocarbons (HC), smoke
LFO produces less gaseous or particulate emissions.
Sarvi et. al.[2] compared the emission of burning heavy fuel (HFO) and light fuel (LFO) oils. The test modes for the investigation were a propulsion mode (marine application) and a generator mode (power plant application). In comparison the emissions from HFO and LFO utilizations indicated slightly higher NO and CO emissions for HFO, while LFO gives clearly higher emissions of hydrocarbons HC .
Ushakov et al [6] studied the gaseous, smoke and particulate matter emission characteristics of a turbocharged heavy-duty diesel engine operated on conventional marine gas oil and gas to- liquid Fischer– Tropsch fuel under modes of propulsion and generator operation. The gas-to-liquid showed average reductions up to 19% in nitrogen oxides, 25% in carbon monoxide, 4% in carbon dioxide and 30% in smoke with slight increase in unburned hydrocarbon emissions.
The main focus of this work was to investigate the effects of combustion phases on the emissions of a high speed
direct injection (HSDI) diesel engine fueled with ultra-low sulfur diesel fuel and heavy fuel oil and run at constant speed (1500 rpm) with single injection strategy at constant fuel injection pressure ( 1200 bar ) , with changing the injection timing (-12,-9,-6,-3,0) ATDC and loads (
40N.m=2.5 bar BMEP and 80N.m=5 bar BMEP).
2 METHODOLGY
2.1 EXPERIMENTAL SETUP
Experiments were carried out in a 2.0 lt, 4 cylinders, 16 valves, and compression ratio18.2, direct Injection Ford’s Duratorq (Puma) Euro3 diesel engine. The engine was supplied by Ford as a prototype production unit which
IJSER © 2014 http://www.ijser.org
International Journal of Scientific & Engineering Research, Volume 5, Issue 7, July-2014 647
ISSN 2229-5518
powered Ford Transits and Mondeo cars. The engine is fully instrumented and coupled to a Schenck eddy current dynamometer. The schematic of the experimental setup is shown in Figure (1). In this investigation, the engine was operated under naturally aspirated mode without EGR. Instrumentation enables the measurement of in-cylinder pressure and exhaust gas emissions under steady-state engine operating conditions. The in-cylinder pressures were measured using a Kistler pressure transducer fitted into the first cylinder of the engine. The signal from pressure transducer was amplified by the charge amplified and then recorded by the (LabView) software in conjunction with the shaft encoder. In-cylinder pressure data were collected over 100 engine cycles per measurement, and the measurement was repeated 5 times for each point in the experimental matrix .These data were averaged from 100 cycles.
Figure (1). The schematic of experimental setup
A common rail fuel injection system with six holes injector
of 0.154 mm in diameter, and a spray-hole angle of 1540
was used in this investigation. In this work, the influence of
injection timing has been tested. A software (Gredi) was used to control and change engine running parameters by programming the ECU in real time. Injection timing could be directly controlled through the software. The gaseous exhaust emissions were acquired using a Horiba-Mexa
7170DEGR gas analyzer. A non-dispersive infrared method has been used for measuring the CO and CO2 emissions. The NOx emissions were measured using chemiluminescence technique, whereas the total un-burnt hydrocarbons (THC) were measured using the flame ionization detection technique. The engine exhaust smoke emissions were measured using the AVL – 415 smoke meter. The diesel fuel consumption was measured using an AVL fuel consumption meter, which is based on gravimetric measurement principle, measurements were carried out using the standard low sulphur diesel fuel USLD and heavy fuel oil . Table 1 presents the properties of the fuels used in this work.
2.2 Analyzing Gathered Data:
The data obtained from the experiments conducted were collected from relevant sensing setup using the instrumentation automation software package (LabView). Data batches collected were migrated to (Matlab) in order to process the data to obtain related values for peak pressure and the accompanying angle at which peak pressure occurred, the angle between start of combustion (SOC) and peak pressure, and to estimate the amount of apparent heat release rate (AHRR). The mathematical processing was carried out using an elementary methodology using the conventional first law heat release model assuming a constant specific heat ratio of 1.35 without any accompanying modeling of heat transfer or crevice effects. While this method was very elementary but was found to be adequate for conducting comparisons. For
the purpose of ensuring that a constant value cp /cv could represent both fuels satisfactorily, an approximation of the cp /cv values made from the charts of logarithm of pressure
/ logarithm of volume were used in the conducted calculations. The resulting values of specific heat came out to be fundamentally consistent between ULSD and HFO under different conditions. This has proven that the constant specific heat ratio used was very suitable for the purpose intended. Figure (2) demonstrates the definitions upon which the AHHR parameters calculations were based. For the purpose of reducing noise effect on the obtained results and maintaining the crucial characteristics of combustion, each pressure point on the trace was calculated from averaging every 100 cycle pressure data. The data acquisition system logged pressure data once for every degree of crank angle, but these data were interpolated to one decimal place by a program written to run under (Matlab) .The combustion criteria parameters listed in the points after the following paragraph were calculated using the AHRR curve of figure (2) without any filtering or averaging except for the end of combustion value and the end of premixed burn. The end of combustion value was outlined using the moving average of the AHRR for the purpose of improving its consistency. The end of premixed burn was calculated from the second derivative of the AHRR. The following points list the combustion criteria calculated from the AHRR curve:
1. Start of injection (SOI): this factor was defined from the
instructed SOI set within the engine management software. Any impending difference between the instructed and actual SOI is possible due to solenoid delay and should be uniform in conducted measurements as the engine speed was maintained constant.
2. Ignition delay (ID): the value of ID is defined as the difference between the instructed SOI and calculated SOC.
3. Start of combustion (SOC): the start of combustion is defined as the point at which the heat release rate becomes positive. On the AHRR curve, it is defined as the point where the curve crosses the x-axis.
4. Premixed burn Fraction (PMBF): the value for this factor is calculated from dividing the Integral of the AHRR curve between SOC and EOPMB by the Integral of the AHRR curve between SOC and EOC.
5. End of premix burn (EOPMB): the end of premix burn is
defined as the first point at which the second derivative of
the AHRR reaches a local maximum following a global minimum. In most conditions, the value of this factor approximates the one that corresponds to the position at which the AHRR curve reaches its first local minimum after a global maximum. But in this study, the second differential was used instead due to the reason of unclear local minimum in the AHRR curve under low load conditions which can be observed in figure (2).
6. End of combustion (EOC): this point can be defined as the first point at which the moving average of heat release
IJSER © 2014 http://www.ijser.org
International Journal of Scientific & Engineering Research, Volume 5, Issue 7, July-2014 648
ISSN 2229-5518
rate drops below zero. The moving average was used to minimize the noise impact on the results accuracy while keeping its representative consistency with the general tendencies of collected data. Additional characteristic values can be calculated from the in-cylinder pressure data, these include: the total apparent heat release, peak AHRR, angle of peak AHRR, angle between SOC and peak AHRR, PMBF, 10 – 90% burn fraction intervals, duration of partial burn fraction intervals, and average burn rates through partial intervals. Emissions data averaged over 180 s durations were recorded.
3. RESLUTS AND DISCUSSION
3.1 Combustion Characteristics
Figures (3) and (4) show the effect of injection timings on in-cylinder pressure variations with crank angles for HFO at low and high loads respectively. It can be seen that the value of the maximum pressure decrease with the retardation of the injection timing to TDC, also, it can be note that the shift in the start of combustion and its corresponding pressure peaks. For all cases, the late injection of fuel in the compression stroke or even at TDC leads to a lower peak pressure due to the occurrence of combustion in the expansion stroke.
Figure (5) shows the comparison of the in-cylinder pressure with crank angle at both high and low loads (80 N.m= 5 bar BMEP & 40N.m=2.5 bar BMEP) and injection timing (-9
ATDC) for HFO and USLD fuels. It can be clearly note that the ULSD pressure curve rises earlier for both loads, but they are advanced to a slightly greater degree under the high load. This confirmation is supported by the heat release plots depicted in Figure (6) which shows the same trend, and by the ID data presented in Figure (7). It is indicated that the ID of HFO was always longer than that of ULSD. The longer ID of HFO is due to physicochemical properties of heavy components, the ignition delay depends on the nature of the volatiles in the heavy fuel oil and on the decomposition of the asphaltene to volatile molecules of lower molecular weight during the pre- ignition stage [5].
The influence of asphaltenes on heavy oil droplet
combustion may be considered from their effect on each of
the stages of the combustion process: (a) evaporation of
lighter constituents consequent on pre-ignition heating; (b)
ignition and burning of volatiles in the droplet flame; (c) the effect of the volatiles from the decomposition of asphaltenes and other large species on disruptive burning, and (d) the formation of solid species (coke and cenospheres) via polymerisation reactions.
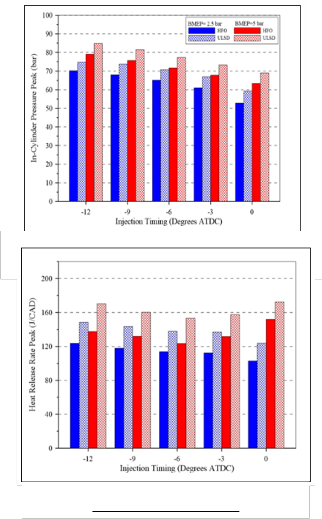
The peaks of in-cylinder pressure at different injection timing are shown in Figure (8), it shows clearly that the peaks of in-cylinder pressure are mostly higher for ULSD. This is due to the advancement of start of combustion with ULSD
Figure (9) shows the difference between heat released rate peak at high and low load at different injection timings. It is observed that AHRR peak of ULSD at high and low loads are higher than that of HFO at most conditions. This may be because incomplete combustion of heavy components for heavy fuel oil.
The longer ID of HFO should lead to increase the premixed
burn fraction compared to ULSD fuel, but because of the
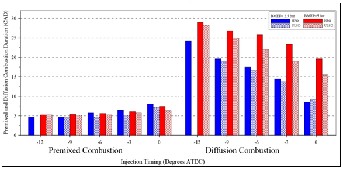
difficulty of heavy fuel atomization and incomplete combustion of the heavy components for the heavy fuel lead to reduce the premixed burn fraction compared to ULSD fuel as shown in Figure (10). It can be seen that premixed burn fraction decreases with the increasing of load and increasing of diffusion burn fraction; this is due to the increased amount of fuel burned during diffusion combustion. Duration of diffusion combustion increase with increasing of load, as shown in Figure (11) .
Figure ( 11) effect of injection timing on premixed and diffusion combustion duration for both types of fuels.
The Brake Specific Fuel Consumption (BSFC) for ULSD and HFO fuels at different injection timings are shown in figure (12). The BSFC for HFO was higher than that of ULSD at both loads; the increase in BSFC is mainly associated with the lower heat value of HFO compared with that of ULSD and incomplete combustion of the heavy components (asphaltenes) for the heavy fuel especially at low load.
3.2 Emission characteristics
3.2.1 Smoke Number
Figure (13) shows that the smoke emission of HFO was higher than of USLD fuel at low and high loads, the difference is particularly obvious at high engine load. The fuel quality of ULSD and HFO is quite important for smoke formation [1]. For HFO , higher sulphur, lower cetane number and higher fuel density give more smoke; also, aromatics and volatility have a slight increasing affect; and oxygenate have a slight decreasing effect. Diesel engine exhaust contains sulphur dioxide (SO2 ) formed during the combustion of sulphur from diesel fuel and lubricating oil. A fraction of this SO2 is oxidized in the exhaust to form SO3 , which rapidly hydrates to form sulphate (typically 1–
2% of fuel sulphur) and is emitted as particulate matter (thus contributing to total PM) [1]. The degree of conversion depends to a large extent on the exhaust temperature and the presence of catalytically active species.
Lowering the sulphur in fuel lowers the SOx fraction of PM thus lowering the overall mass of PM emitted. Soot formation studies have shown [7] that diesel combustion soot is formed in the fuel-rich zone. Decreasing the fraction of the higher boiling point components in the fuels linearly reduces particulate emissions. This indicates that fuel properties which determine fuel atomization or mixture formation are also important factors for formation of particulate emissions. It has been shown that nitrogen species compete with sulphur compounds to be adsorbed by diesel particulate matter (PM) before being emitted to the atmosphere [8]. Diesel particulates consist of many
IJSER © 2014 http://www.ijser.org
International Journal of Scientific & Engineering Research, Volume 5, Issue 7, July-2014 649
ISSN 2229-5518
agglomerated primary (size ∼0.01–0.1 nm) particles
(spherules) [9], formed by a complex series of chemical and
physical processes from combustion in over-rich (lack of
air) mixtures in diesel engines. This usually occurs at high speed or high load of the engine.
Furthermore, retarding the injection timing produces more heat in the premixed phase as shown in figure (10), thus it can be suggested that soot emissions could be lower at late fuel injection timing as shown in figures (13) . Higher injection pressure leads to smokeless emissions at low load with ULSD as has been explained previously.
3.2.2 Nitrogen oxides
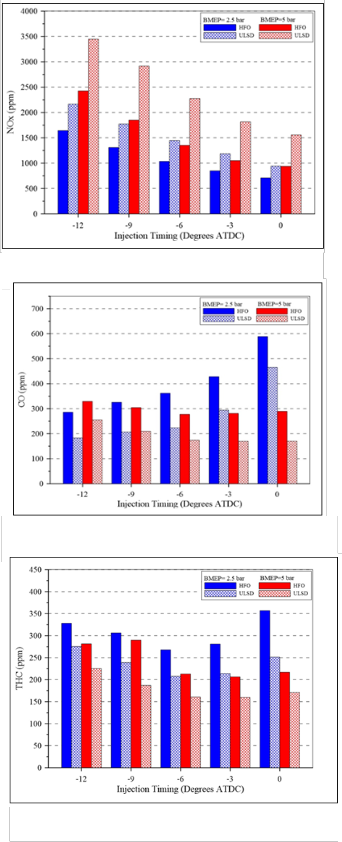
Figure (14) shows the variation of the nitrogen oxides emissions NOx with injection timing at low and high loads for both types of fuels. Higher NOx formation is normally related to a larger premixed combustion process portion with ULSD, which is less with HFO. Nitrogen oxide emissions depend strongly on the maximum local conditions of temperature of combustion composition (Zeldowich mechanism), which means that it also depends on air excess (NOx formation rates are highest in the close- to-stoichiometric region). The retarded injection timing significantly reduces the NOx emissions because of the low in-cylinder temperature resulting from the shift of the combustion into the expansion stroke. As the big difference of NOx emissions between high and low-load due to the difference of temperature in combustion chamber .
3.2.3 CO emissions
The characteristics of CO emission are shown in Figure (15). The difference between the CO emissions at high and low loads is quite clear. Carbon oxide CO burnout is not always complete and its content in exhaust gases mainly depends on combustion air excess; subsequent oxidation of CO happens after air is entrained into the spray region where it mixes and burns. Combustion of fuel-rich mixtures usually produces high amounts of CO emissions. But, otherwise since diesel combustion is usually lean, CO emissions are typically very low as a result of high combustion temperature, high oxygen content and high mixing rates [10]. At low load, the role of mixing is more important than that of temperature, which gives incomplete combustion. CO burn-out is a balance between temperature, available oxygen and water for oxidation, and mixing. Because of the difficulty of heavy fuel atomization and incomplete combustion of the heavy components for the heavy fuel, CO emissions of HFO were higher compared to ULSD fuel. The effect of the retarded injection timing at low load causes higher increase of CO emissions, as mentioned above; CO emissions are formed as a result of incomplete combustion, mainly due to the combustion taking place at low temperature in the expansion stroke. Moreover, the spray-wall impingement could be much greater for the injection of fuel at TDC. This effect was not
clear at high load due to the high temperature of the combustion chamber at different conditions.
3.2.4 THC emissions
The characteristics of THC emissions for HFO and ULSD fuels are shown in Figure (16). THC emissions are primarily unburned fuel, and form in region where the flame quenches on the walls. They are also generated where air excess dilution of fuel with air results in incomplete combustion, giving molecules of decomposed fuel and lubricating oil, and recombined intermediate compounds [11–13]. In figure (15) it can be seen that the THC emission decreases with increase of engine load for both types of fuels, due to the increase in combustion temperature associated with higher engine load . The THC emission for HFO are higher than that of ULSD, this is due to higher viscosity of HFO and incomplete combustion of the heavy components for the heavy fuel.
. As mentioned previously, an increase in THC emission can be a by-product of advanced injection timing; this is mainly due to lower charge density at the time of injection which leads to increased spray penetration and ultimately sprays wall impingement, referred to as wall wetting. This is responsible for the increase in the level of unburned fuel. THC emission can also be increased due to the presence of very lean mixture combustion (low temperature combustion) caused by over-mixing due to the longer ignition delay period at low load especially for HFO fuel. Also, fuel that vaporizes from the injector volume after injection at a later stage of combustion is a source of HC emissions.
4. CONCLUSIONS
1- At all measured conditions, HFO had a longer ID due to physicochemical properties of heavy components and the nature of the volatiles in the heavy fuel oil.
2- The ULSD pressure curve rises earlier for both
loads, but they are advanced to a slightly greater
degree under the high load. The value of the maximum pressure decrease with the retardation of the injection timing to TDC .
3- The peaks of in-cylinder pressure are mostly higher for ULSD. This is due to the advancement of
start of combustion with ULSD.
4- The difficulty of heavy fuel atomization and
incomplete combustion of the heavy components
for the heavy fuel lead to reduce the premixed
burn fraction of HFO compared to ULSD fuel.
5- The premixed burn fraction decreases with the
increasing of load and increasing of diffusion burn fraction due to the increased amount of fuel burned during diffusion combustion.
6- The BSFC for HFO was higher than that of ULSD
at both loads due to the lower heat value of HFO
IJSER © 2014 http://www.ijser.org
International Journal of Scientific & Engineering Research, Volume 5, Issue 7, July-2014 650
ISSN 2229-5518

compared with that of ULSD and incomplete combustion of the heavy components for the heavy fuel especially at low load.
7- The smoke emission of HFO was higher than of USLD fuel at low and high loads due to higher sulphur content, lower cetane number and higher fuel density.
8- Higher NOx formation is normally related to a
larger premixed combustion process portion with
ULSD, which is less with HFO.
9- CO emissions of HFO were higher compared to
ULSD fuel because of the difficulty of heavy fuel
atomization and incomplete combustion of the
heavy components for the heavy fuel.
10- The THC emissions for HFO are higher than that of
ULSD due to higher viscosity of HFO and
incomplete combustion of the heavy components for the heavy fuel.

Fig. (3) In-cylinder pressure under 40Nm ( 2.5 bar BMEP )
at different injection timing
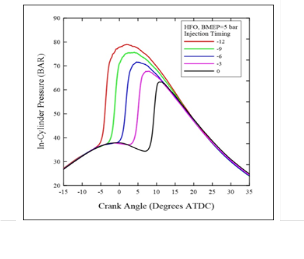
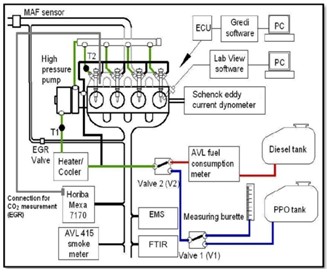

Fig. (1) The schematic of experimental setup
Fig. (4) In-cylinder pressure under 80Nm ( 5 bar BMEP ) at different injection timing

Fig. (2) Labeled plot of heat release and the derivatives used to calculate combustion criteria
IJSER © 2014 http://www.ijser.org
International Journal of Scientific & Engineering Research, Volume 5, Issue 7, July-2014 651
ISSN 2229-5518
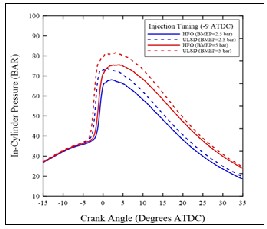

Fig. (5) In-cylinder pressure for ULSD & HFO
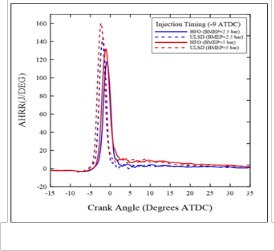
Fig. (8) In-cylinder pressure peak under high and low load at
Fig. (6) Apparent heat release rate for ULSD & HFO
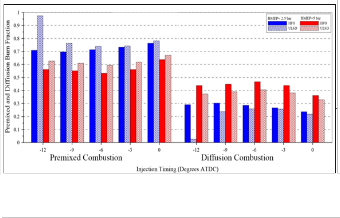
Fig. (9) Heat Release Rate peak under high and low load at different injection timing
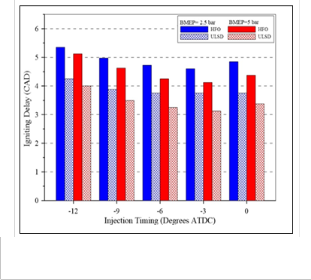
Fig. (10) Effect of injection timing on premixed and diffusion burn fraction for both types of fuels
Fig. (7) Ignition delay under high and low load at different injection timing
IJSER © 2014 http://www.ijser.org
International Journal of Scientific & Engineering Research, Volume 5, Issue 7, July-2014 652
ISSN 2229-5518

Fig. (11) Effect of injection timing on premixed and diffusion combustion duration for both types of fuels
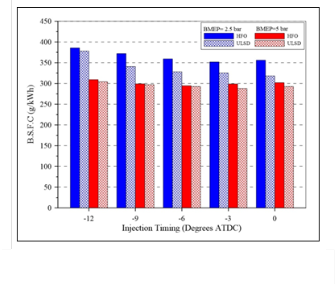
Fig. (14) NOx emissions under high and low load for both types of fuels
Fig. (12) The Brake Specific Fuel Consumption (BSFC) under high and low load
Fig. (15) Carbon monoxide emissions under high and low load for both types of fuels
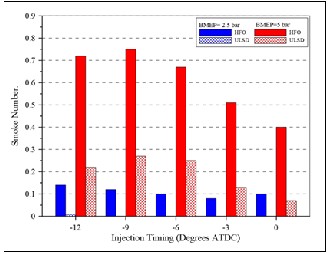

Fig. (13) Smoke number under high and low load for both types of fuels
Fig. (16) (THC) emissions under high and low load for both types of fuels
NOMENCLATURE
AHRR Apparent heat release rate
ATDC After top dead centre
IJSER © 2014 http://www.ijser.org
International Journal of Scientific & Engineering Research, Volume 5, Issue 7, July-2014 653
ISSN 2229-5518
BMAP Brake mean effective pressure BSFC Brake Specific Fuel Consumption CO Carbon monoxide
CO2 Carbon dioxide
Cp Specific heat at constant pressure Cv Specific heat at constant volume DBF Diffusion burn fraction
ECU Electronic Control Unit
EGR Exhaust Gas Recirculation
EOC End of combustion EOPMB End of premixed burn HSDI High speed direct injection ID Ignition delay
NO Nitrogen monoxide
NO2 Nitrogen dioxide
NOx Nitric oxides
PM Particulate matter PMBF Premixed burn fraction SOC Start of combustion
SOI Start of injection
SN Smoke number
THC Total hydrocarbons
ULSD Ultra-low sulfur diesel fuel
ACKNOWLEDGMETS
The experimental work of this research has been conducted in the Centre for Advanced Powertrain and Fuels Research (CAPF), School of Engineering and Design, Brunel University, London, UK. Authors are thankful to center staff and special thank is for technicians Kenneth Antiss, and to colleagues Fanos Christodoulou, David Peirce and N. Alozie for their assistance
REFERENCES
[1] Arto Sarvi , Carl-Johan Fogelholm , Ron Zevenhoven . Emissions from large-scale medium-speed diesel engines: 2. Influence of fuel type and operating mode. FUEL PROCESSING TECHNOLOGY 8 9 (2008) 520–527.
[2] M. Signer, P. Heinze, R. Mercogliano, H.J. Stein.
European Program on Emissions, Fuels and Engine
Technologies (EPEFE)—heavy duty diesel study, SAE paper
961074, 1996.
[3] Arto Sarvi , Jussi Lyyränen , Jorma Jokiniemi , Ron Zevenhoven. Particulate emissions from large-scale medium-speed diesel engines: 2. Chemical composition. Fuel Processing Technology 92 (2011) 2116–2122.
[4] Md. Nurun Nabi , Richard J. Brown, Zoran Ristovski , Johan Einar Hustad. A comparative study of the number and mass of fine particles emitted with diesel fuel and marine gas oil (MGO). Atmospheric Environment 57 (2012)
22-28.
[5] K.D. Bartle, J.M. Jones, A.R. Lea-Langton, M. Pourkashanian, A.B. Ross, J.S. Thillaimuthu, P.R. Waller, A. Williams. The combustion of droplets of high-asphaltene heavy oils. Fuel 103 (2013) 835–842.
[6] Sergey Ushakov , Nadine G.M. Halvorsen , Harald
Valland, Dag H. Williksen, Vilmar Æsøy. Emission characteristics of GTL fuel as an alternative to conventional marine gas oil. Transportation Research Part D 18 (2013) 31–
38.
[7] J. Dec, A conceptual model of DI diesel combustion
based on laser-sheet imaging, SAE paper no. 970873, 1997. [8] J.B. Heywood, Internal Combustion Engine Fundamentals, McGraw-Hill, New York, 1988.
[9] C.A. Amann, D.C. Siegla, Diesel particulates: what they
are and why, Aerosol Sci. Technol., vol. 1, Ann Arbor
Science Publ., Ann Arbor, 1982, pp. 73–101.
[10] Karonis D, Lois E, Stournas S, Zannikos F. Correlation of exhaust emissions from a diesel engine with diesel fuel properties. Energy & Fuels 1998; 12:230–8.
[11] Aaronson AE, Matula RA. Diesel odor and the
formation of aromatic hydrocarbons during the combustion of pure cetane in a single-cylinder diesel engine. In: 13th Symp. (Int.) on Combustion. Pittsburgh (PA): The Combustion Institute; 1971. p. 471–81.
[12] Bascom RC. Design factors that affect diesel emissions.
SAE Lecture Series, Engineering know-how in engine design; March 1971.
[13] Hurn RW. Air pollution and the compression–ignition engine. In: 12th Symp. (Int.) on Combustion. Pittsburgh (PA): The Combustion Institute; 1969. p. 677–87.
IJSER © 2014 http://www.ijser.org